Mongolia Daily 2011 December 19 - Eurasia Capital
Mongolia Daily 2011 December 19 - Eurasia Capital
Mongolia Daily 2011 December 19 - Eurasia Capital

You also want an ePaper? Increase the reach of your titles
YUMPU automatically turns print PDFs into web optimized ePapers that Google loves.
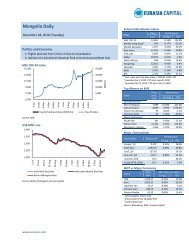
<strong>Mongolia</strong> <strong>Daily</strong> <strong>December</strong> <strong>19</strong>, <strong>2011</strong>MSE AND MONGOLIA-FOCUSED INTERNATIONAL MINING COMPANIESSTOCKS PERFORMANCE SUMMARYMSE TOP-20 (<strong>December</strong> <strong>19</strong>, <strong>2011</strong>)NameSymbolPrice Market Cap Performance <strong>Daily</strong> Volume P/E P/BMNT US$ MNTmn US$mn 1D chg y-t-d Shares MNTmn US$'000 2010 2010Tavan Tolgoi TTL 8,500 6.18 447,654 325.5 -3.4% 47.6% 2,760 23.46 17.06 5.8 4.5APU APU 3,790 2.76 281,550 204.7 14.9% 90.5% 39,665 150.33 109.30 14.3 5.6Baganuur BAN 9,500 6.91 <strong>19</strong>9,256 144.9 -3.1% -9.5% 551 5.23 3.81 24.6* 53.8*Shivee Ovoo SHV 13,000 9.45 174,448 126.8 0.0% 0.0% 269 3.50 2.54 13.9* 35.6*Sharyn Gol SHG 11,152 8.11 113,4<strong>19</strong> 82.5 0.0% 6.2% 600 6.69 4.86 527.5* 14.5*<strong>Mongolia</strong>n Telecom MCH 2,800 2.04 72,437 52.7 3.7% -20.0% 40 0.11 0.08 39.4 2.2BDSec BDS 3,700 2.69 40,700 29.6 0.0% 48.0% 0 0.00 0.00 49.7 6.4Gobi GOV 4,900 3.56 38,226 27.8 -2.0% -12.5% 18 0.09 0.06 11.4 1.6Suu SUU 65,000 47.26 22,360 16.3 0.0% 209.7% 0 0.00 0.00 8.3 2.6Mogoin Gol BDL 26,000 18.90 21,570 15.7 -9.6% 120.3% 59 1.53 1.12 626.4* 9.7Khukh Gan HGN <strong>19</strong>0 0.14 <strong>19</strong>,250 14.0 -1.6% 1.6% 4,912 0.93 0.68 -13.2* 2.3State Department Store UID 485 0.35 17,852 13.0 0.4% 12.8% 3,452 1.67 1.22 -12.6* 4.8Aduunchuluun ADL 4,801 3.49 15,129 11.0 -11.1% -40.0% 66 0.32 0.23 31.6 6.0<strong>Mongolia</strong>n DevelopmentResourcesMDR 1,100 0.80 15,125 11.0 0.0% -15.4% 50 0.06 0.04 15.1 1.1Bayangol Hotel BNG 35,000 25.45 14,807 10.8 0.0% 46.4% 8 0.28 0.20 6.5 0.8Remicon RMC 180 0.13 14,162 10.3 5.9% 150.0% 13,767 2.48 1.80 33.6 2.3Genco Tour Bureau JTB 94 0.07 10,340 7.5 0.0% 0.0% 50 0.00 0.00 92.6 1.2Talkh Chikher TCK 10,000 7.27 10,237 7.4 -2.9% 170.3% 39 0.39 0.28 11.5 3.2Hotel <strong>Mongolia</strong> MSH 799 0.58 7,990 5.8 0.0% 42.7% 60 0.05 0.03 53.0 2.5Bayanteeg BTG 23,000 16.72 5,810 4.2 0.0% 228.5% 0 0.00 0.00 NA NASource: MSE, <strong>Eurasia</strong> <strong>Capital</strong> estimatesSelected 5 Non-MSE TOP-20 Member Largest Companies (<strong>December</strong> <strong>19</strong>, <strong>2011</strong>)NameSymbolPrice Market Cap Performance <strong>Daily</strong> Volume P/E P/BMNT US$ MNTmn US$mn 1D chg y-t-d Shares MNTmn US$'000 2010 2010UB Hotel ULN 45,999 33.44 15,423 11.2 0.0% 67.3% 0 0.00 0.00 12.3 2.4Eermel EER 2,696 1.96 9,380 6.8 -3.7% -6.2% 50 0.13 0.10 26.8 0.9Makh Impex MMX 2,120 1.54 8,058 5.9 -1.4% 17.8% 30 0.06 0.05 88.0* 116.2*Darkhan Nekhii NEH 6,999 5.09 7,737 5.6 0.0% 42.8% 0 0.00 0.00 6.3 1.3Nako Tulsh NKT <strong>19</strong>5 0.14 2,460 1.8 0.0% -40.0% 0 0.00 0.00 -21.5* 2.1Source: MSE, <strong>Eurasia</strong> <strong>Capital</strong> estimates*Note: These PE and PB ratios are not meaningful, in our view.www.eurasiac.com 4