Embley
Social impact assessment - part 1 (PDF 821 KB) - Rio Tinto Alcan
Social impact assessment - part 1 (PDF 821 KB) - Rio Tinto Alcan
- No tags were found...

You also want an ePaper? Increase the reach of your titles
YUMPU automatically turns print PDFs into web optimized ePapers that Google loves.
Environmental Impact Statementfor South of<strong>Embley</strong> ProjectSection 16Social Impact Assessment
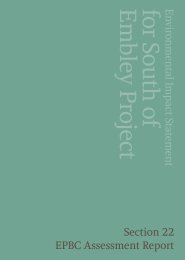
Rio Tinto AlcanEnvironmental Impact StatementSouth of <strong>Embley</strong> ProjectLegendArea RoadsI= Other leasesRio Tinto mining lease rylL7024Rip Tinto mining lease VIL7031Vacant crown landParks or government reservesPrivate land holdingsDOGIT !andsPepan Land TrustAurukun ShireScherger RAAF BaseCullen Point camping areaShe Oakscamping areaMAPOONPonArmy Creakcrampfn9 etasTJUNGUNFirRIO TINTO ALCANML 7024CAPEPennefathercamping areaRi0 TINTO ALCANML TO31GULFCAPE ALUM1NIAIStones Crossingcamping area ).ANATHANGAYTHHitlys LagoonDeynten PondWEIPAPEPPAN \;26....T.'1'jYO RKNAPRANUMOFALBATROSSHAYBoyd PoktrWIK WAYPere He. :Ri0 TINTO ALCANML 7024thud PamFalse Pera Headcamping groundCARPENTARIAWatson River 0WESTERN CAPE YORK PENINSULA REGIONAL MAPllllll ddd iiiihxretres0 5 10 IS SS 4C. 45Figure 16-1Western Cape York Peninsula Regional Map of Indigenous Groups
Rio Tinto AlcanEnvironmental Impact StatementSouth of <strong>Embley</strong> ProjectThe area of land south of the <strong>Embley</strong> River is recognised as the traditional lands of the Wik andWik Way people. The Wik and Wik Way people, by birthright, are the Traditional Owners of thelands which occupy a large area along the coastal floodplains lying between Pormpuraaw andWeipa and inland to the middle reaches of rivers such as the Archer, Kendall and Holroyd Rivers(O'Faircheallaigh 1996). There are probably more than 50 clan estates and many languagegroups. The Wik estate occupies more than 72,000 hectares.The Aurukun community is comprised of approximately 1,200 people, many of which representthe Wik and Wik Way Traditional Owners of the area. While Aurukun is the central location formany people living in the area, there are also a number of "outstations" stretching over 125kmfrom Pera Head south to the Kendell River. There are also a number of Wik and Wik WayTraditional Owners who have relocated and now live in other communities across Cape York.Throughout history, the Wik and Wik Way people have demonstrated a strong commitment totheir rights as the Traditional Owners and native title holders for their traditional lands. Themost historic example of this commitment was the Wik and Wik Way native title case in whichthe High Court found in 1996 that the grant of a non-exclusive pastoral lease did notnecessarily extinguish native title and that native title rights could co-exist with the rights of alessee.In July 2009, the Federal Court determined by consent (FCA 789) the native title rights of theWik and Wik Way Native Title Claim Group. The court held that native title did exist in relationto the determined area that includes the area of RTA's mining lease (ML 7024) located south ofthe <strong>Embley</strong> River. This consent determination was the first over a mining lease in Queensland.The Wik and Wik Way people were the first Traditional Owner signatory group under theWCCCA to have native title recognised by the Federal Court under the Native Title Act 1993(Cwlth).16.2 Description of Social ValuesInformation presented in this section is based on the Weipa Community Baseline Study (April2008) commissioned by RTA and carried out by SGS Economics and Planning (SGS). The dataused in the SGS report was largely sourced from the 2001 and 2006 Australian Bureau ofStatistics Census of Population and Housing (2006 Census). The data was extracted from aseries of ABS Census Collection Districts that have been combined to represent the study areasof Weipa, Napranum, Aurukun and Mapoon. It should be noted that the data collected forIndigenous communities can be limited due to the nature of the communities and theirorganisational structure, however it is also important to note that the ABS takes comprehensivemeasures to ensure the data is as accurate as possible for these communities. The datacontained in this section is complemented with recently published ABS data on population,housing and employment and other socio-economic indicators from other sources such as the(former) Department of Employment and Workplace Relations, the Queensland Government'sPlanning Information and Forecasting Unit (PIFU) and information available from publishedinformation on the operations, Weipa and the Cape York Region.The Socio-Economic Index of Disadvantage, which was produced by the ABS in 2006, is asummary measure of social and economic conditions by geographic area focussing on lowincomeearners, relatively lower education attainment, high unemployment and dwellingswithout motor-vehicles. Table 16-1 shows the percentage of the population in each quintile(one-fifth or 20% of the population). By definition, Queensland has 20% of the population ineach quintile. In comparison, 100% of the Aurukun population was in the most disadvantagedquintile, while 0% of the population of Weipa was in the most disadvantaged quintile.Section 16 Social Impact Assessment Page 16-3
Rio Tinto AlcanEnvironmental Impact StatementSouth of <strong>Embley</strong> ProjectTable 16-1Socio-Economic Index of DisadvantageLocal GovernmentAreaQuintile 1 (mostdisadvantaged)Quintile2Quintile3Quintile4Quintile 5 (leastdisadvantaged)Aurukun Shire Council 100.0 0.0 0.0 0.0 0.0Weipa Town Area 0.0 0.0 32.8 67.2 0.0Queensland 20 20 20 20 20Source: ABS (2006)16.2.1 Population and DemographicsPopulationAt the time of the 2006 Census, the total population of the four communities in the WesternCape region was 5,191 people. Weipa accounted for most of the region's population with 3,089people, followed by Aurukun (1,039 people), Napranum (829 people) and Mapoon (234people).Population growth occurred in all study communities between 2001 and 2006. Weipa increasedby almost 4% per annum, Aurukun increased by 0.3% per annum, Napranum increased by2.3% per annum and Mapoon increased by 3.5% per annum (refer Table 16-2).Table 16-2 Change in Population, 2001 to 20062001 Population 2006 Population Average Annual ChangeWeipa 2,580 3,089 3.67%Aurukun 1,024 1,039 0.29%Napranum 740 829 2.30%Mapoon 197 234 3.50%Source: ABS Census of Population & Housing, 2001 and 2006Population ProjectionsThe workforce for RTA's current operations predominantly resides in Weipa. Aurukun andMapoon are too distant for daily work commutes and the majority of Indigenous employeestend to base themselves in Weipa rather than Napranum. Population estimates for Weipa havebeen made using the population multiplier determined from the relationship between populationat the time of the 2006 Census and RTA's overall workforce numbers. RTA is by far thedominant local employer and the size of the mine-related workforce is the key driver of theresidential population. At the time of the 2006 Census, the population of Weipa (3,089)amounted to 3.5 people for every RTA employee (777) and contractor (107). Table 16-3shows Weipa population estimates in relation to historic and forecast workforce numbers usinga resident-to-workforce multiplier of 3.5.The population estimates assume that the Project commences at a production rate of15Mdptpa. Production would also continue at Andoom simultaneously until those bauxitereserves are depleted. The population projections indicate that under this scenario Weipa wouldhave a marginally smaller population than in 2007-2008. Future demands on infrastructure andgovernment services are expected to be no higher than in recent years.Under the 30Mdptpa production scenario, when Andoom production is likely to have ceased, theoverall operational workforce would decrease as the Project has thicker bauxite reserves andshorter average haul distances and hence higher labour productivity than Andoom. The Weipapopulation is projected to return to levels that are slightly higher than what they were in 2006.Section 16 Social Impact Assessment Page 16-4
Rio Tinto AlcanEnvironmental Impact StatementSouth of <strong>Embley</strong> ProjectTable 16-3Population Projections for Weipa.Year Average Mining Workforce Projected PopulationEmployee Contractor Total Weipa2006 777 107 884 3,089 (Census)2007 825 345 1,170 4,0982008 912 245 1,157 4,0522009 826 85 911 3,191SoE 15Mdptpa and Andoom 800 200 1,000 3,502SoE 30Mdptpa 760 190 950 3,327SoE 50Mdptpa 1,020 255 1,275 4,465Source: RTA, based on actual workforce numbers 2006-2009At 50Mdptpa, the population of Weipa is projected rise to approximately 400 above the peak of2007-2008. Such a population rise would require development of more residential land andhousing, and provision of expanded government services. It is not possible to predict whenmarket conditions would enable a production increase above 30Mdptpa. The Golf Links IIresidential estate of 65 lots is available for development in Weipa when, and if, required. Thereis adequate suitable land for additional development to meet demand. While this land iscurrently outside the Weipa town boundary, the boundary can be extended, as has been donein the past.The Office of Economic and Statistical Research (OESR) population projections for AurukunShire for the years 2011, 2016, 2021 and 2026 are 1,170, 1,203, 1,233 and 1,264 respectively(OESR 2009), assuming an average growth rate scenario of 0.6% per annum. The ORSR hasnot made projections for Mapoon and Napranum due to lack of data. If a 0.6% growth rate isapplied to the 2006 population, the Mapoon population would rise to 241 in 2011, 248 on 2016,265 in 2021 and 264 in 2026. Likewise, the Napranum population would rise to 854 in 2011,907 in 2021 and 934 in 2026.Indigenous Population ProfileThe Indigenous population, as counted in the 2006 Census, refers to Indigenous people living inthe geographic area concerned. Weipa has a lower proportion of Indigenous people than theother Western Cape communities with a total of 702 Indigenous persons, or 23% of the totalpopulation (refer Figure 16-2). In Aurukun, there were 955 people who reported being ofIndigenous origin accounting for 92% of the population. In Napranum there were 782Indigenous people or 90% of the local population. Mapoon's population consisted of 219indigenous people, or 90% of its population. All four communities show a high proportion ofIndigenous residents compared to the Queensland average of 3.2%.Section 16 Social Impact Assessment Page 16-5
Rio Tinto AlcanEnvironmental Impact StatementSouth of <strong>Embley</strong> Project100%90%80%AboriginalTorres Strait IslanderBoth Aboriginal and Torres Strait IslanderNon-IndigenousIndigenous status not stated70%60%50%40%30%20%10%0%171Weipa Aurukun Napranum MapoonFigure 16-2Source: ABS Custom Indigenous Population Profile, 2006Indigenous Populations, Weipa, Aurukun, Napranum and Mapoon,2006The Indigenous and non-Indigenous population of the four local communities (local communityarea), in terms of absolute numbers, is presented in Table 16-4. The total population figurespresented in this table differ marginally to those in Table 16-2 showing the total population foreach of the communities of interest. This is a common occurrence when comparing totals orsub-totals drawn from different ABS data sets.Table 16-4 Indigenous and Non-Indigenous Population, 2006Weipa Aurukun Napranum MapoonAboriginal 347 934 436 129Torres Strait Islander 133 4 99 8Both Aboriginal and Torres Strait Islander 222 17 247 82Total Indigenous 702 955 782 219Non-Indigenous 2,145 64 47 23Indigenous status not stated 249 25 9 0Total population 3,096 1,044 838 242Source: ABS Custom Indigenous Population Profile, 2006WeipaWeipa has a large proportion of young to middle aged residents, of both sexes, predominantlybetween the ages of 25 and 45, the age range coinciding with the majority of the miningoccupational workforce. Weipa's median age is 31, younger than the Far North Queensland(FNQ) Statistical Division (SD) population median age of 36 years. Figure 16-3 highlights thereare relatively fewer persons aged between 15 and 25 in Weipa when compared to the agecohorts surrounding them. This is most likely the result of high school-aged students attendingboarding schools located elsewhere and young adults moving to larger centres for employment.Section 16 Social Impact Assessment Page 16-6
Rio Tinto AlcanEnvironmental Impact StatementSouth of <strong>Embley</strong> ProjectAurukunAurukun's population grew an average of 0.3% per annum between 2001 and 2006. Comparedto the FNQ SD and Weipa, Aurukun has higher proportions of people aged between 0 and 39years (refer Figure 16-5). In total, 75% of males and 76% of females responded as beingyounger than 40 years of age. Compared to Weipa, Aurukun has a larger proportion of peopleaged 40 years and under. Aurukun's relatively young population has potential implications forthe demand for social services and the provision of recreational and leisure facilities for youngfamilies. The population structure also has significant implications for employment and trainingwhich are discussed in Section 17. It must be noted that there is no data to compare Aurukun,Napranum or Mapoon age profiles with 2001 figures.90 years and over85-89 years80-84 years75-79 years70-74 years65-69 years60-64 years55-59 years50-54 yearsvo 45-49 yearsa)is40-44 years35-39 years30-34 years25-29 years20-24 years15-19 years10-14 years5-9 years0-4 yearsFemales15% 10% 5% 0% 5%Percentage of Total PopulationFigure 16-5 Age/Sex Structure, Aurukun and FNQ SD, 2006CI Far North SDAurukunMales10% 15%NapranumNapranum has a higher proportion of youth and children compared to Weipa. Napranum alsohas a higher proportion of people aged 60 years and over compared to Weipa (refer Figure16-6). This could perhaps be partly explained by the high proportion of working age peopleliving in Weipa who are there because they work in mining-related industries including RTA.There is a higher proportion of younger people in Napranum, as well as fewer older people,when compared to the FNQ SD.Section 16 Social Impact Assessment Page 16-8
Rio Tinto AlcanEnvironmental Impact StatementSouth of <strong>Embley</strong> Project90 years and over85-89 years80-84 years75-79 years70-74 years65-69 years60-64 years55-59 years50-54 yearsvo 45-49 yearsa)is40-44 years35-39 years30-34 years25-29 years20-24 years15-19 years10-14 years5-9 years0-4 yearsFemalesCI Far North SDMalesNapranum15% 10% 5% 0% 5% 10% 15%Percentage of Total PopulationFigure 16-6 Age/Sex Structure, Napranum and FNQ SD, 2006Source: ABS Census of Population & Housing, 2006MapoonThe absence of females in the 10-19 and 60-74 age cohorts in the chart below is likely to be anartefact of the low population (234) and other factors associated with the timing of the 2006Census (refer Figure 16-7). Whilst Mapoon has a small population, the figure shows that thereis a significantly high proportion of children aged ten years and under when compared withother communities in the Western Cape region as well as the FNQ SD. Recent data indicatesthat the population of Mapoon is gradually increasing as extended family members aremigrating to the area from New Mapoon, Cairns and other areas of Cape York (SGS 2008).Section 16 Social Impact Assessment Page 16-9
Rio Tinto AlcanEnvironmental Impact StatementSouth of <strong>Embley</strong> Project90 years and over85-89 years80-84 years75-79 years70-74 years65-69 years60-64 years55-59 yearsJD50-54 years45-49 yearsa) 40-44 years35-39 years30-34 years25-29 years20-24 years15-19 years10-14 years5-9 years0-4 yearsFemalesMalesCI Far North SDMapoon15% 10% 5% 0% 5%Percentage of Total Population10% 15%Figure 16-7 Age/Sex Structure, Mapoon and FNQ SD, 2006Source: ABS Census of Population & Housing, 2006Indigenous Age/Sex ProfileAccording to the 2006 Census, there is a high proportion of Indigenous people aged nine yearsand under living in Weipa. In 2006, the median age of Indigenous people living in Weipa wasbetween 15-19 years which compares to 20-24 years in the FNQ SD (refer Figure 16-8).065-69 years60-64 years55-59 years50-54 years45-49 years40-44 years35-39 years30-34 years25-29 years20-24 years15-19 years10-14 years5-9 years0-4 yearsFemalesFar North SDWeipa20% 15% 10% 5% 0% 5% 10% 15% 20%Percentage of Total Indigenous PopulationFigure 16-8 Indigenous Age/Sex Structure, Weipa and FNQ SD, 2006Source: ABS Census of Population & Housing, 2006Section 16 Social Impact Assessment Page 16-10
Rio Tinto AlcanEnvironmental Impact StatementSouth of <strong>Embley</strong> ProjectWeipa Population Projections by Age/SexThe age/sex profile of Weipa in 2006 compared to Weipa's forecast age/sex profile for the year2026 is shown in Figure 16-9. The data is taken from PIFU projections. PIFU makes certainassumptions concerning the main components of population change, being fertility, mortalityand migration, to generate their population forecasts. Importantly, PIFU notes that they cannotmodel changes in the main components of population change, other than the ones assumed,and therefore cannot account for influences such as the establishment of a mine or an industrialproject.The PIFU projections show an expected increase in the proportion of the population aged 55years and over as well as an increase in the proportion of the local population aged between 20and 29 years. The expected ageing of the population is evident in the chart with a significantincrease in the proportion of the population aged 65 years and over between 2006 and 2026 aswell as a fall in the proportion of the population aged 19 years and under over the next 20years. It must be noted that population projections were not available for Napranum, Aurukunand Mapoon.0cr)85-89 years80-84 years75-79 years70-74 years65-69 years60-64 years55-59 years50-54 years45-49 years40-44 years35-39 years30-34 years25-29 years20-24 years15-19 years10-14 years5-9 years0-4 yearsFemalesCI Weipa 2026Weipa 2006Males15%10% 5% 0% 5% 10% 15%Percentage of Total PopulationSource: Queensland Government, Planning Information & Forecasting Unit (PIFU), Population Projections, 2006Figure 16-9 Population Projections by Age/Sex, Weipa, 2006 and 2026Mortality, Morbidity and CausesAccording to Health Determinants Queensland 2004 (Queensland Health 2004), the majorcauses of death in the Western Cape region include coronary heart disease, stroke, chronicobstructive pulmonary disease, depression and lung cancer. Health determinants of significantimpact in this population include harmful alcohol consumption, smoking, excess weight andobesity, poor nutrition, physical inactivity and risk and protective factors for mental health.Specific death and illness data was not available for each of Weipa, Aurukun, Napranum andMapoon, only for the Western Cape region as a whole.Marital StatusAt the time of the 2006 Census, 45% of Weipa residents were married (down from 57% in2001) and 43% have 'never married' (increased from 33% in 2001) which is high whencompared to the 38% in the FNQ SD. Proportions of divorced people were, however, lower inWeipa than in the FNQ SD (8% compared to 10%).Section 16 Social Impact Assessment Page 16-11
Rio Tinto AlcanEnvironmental Impact StatementSouth of <strong>Embley</strong> ProjectIn contrast, the communities of Aurukun, Mapoon and Napranum have a predominantly highproportion of people who have never married (87%, 65% and 80% respectively). Analysis bySGS (2008) suggests that this could be attributable to the large proportion of young people inthese communities.During the Community Baseline Assessment process, Centre link and other communityorganisations (such as Weipa Community Care) were interviewed (SGS 2008). According tothose interviewed at the time, anecdotal evidence suggests there is a high incidence ofseparation and relationship breakdowns among Weipa residents. However, this has not beenconfirmed by any quantifiable data source as none is available.Family TypeThe 2006 Census indicates that the most common family type in Weipa is couples with children,accounting for 54% of total family groups. This is higher than any other Western Capecommunity with Aurukun at 40%, Napranum at 33% and Mapoon at 39%. Couples with nochildren were the second highest family type in Weipa at 34%. Single parent families accountedfor 10% of all family households in Weipa; however, this figure was significantly higher in theother communities at 40% in Aurukun, 43% in Napranum and 27% in Mapoon. The percentageof each family type in each community is shown in Figure 16-10.The 'other family' category makes up a small proportion of the family types in each communityand is defined by the ABS as households of related individuals who can not be classified asbelonging to a couple or single parent family. This can include, for instance, two sisters livingtogether where neither have a partner or are a parent or a child of someone living in the house.100%90%80%Couple family with no childrenCouple family with children00ne parent family0ther family70%60%50%40%30%20%10%0%Weipa Aurukun Napranum MapoonFigure 16-10 Family Type, 2006Source: ABS Census of Population & Housing, 2006Table 16-5 shows the average annual change in the number of each family type between2001 and 2006. This data provides an indication of the change in the number of familyhousehold types rather than a proportion of total family households. Weipa was the onlycommunity to experience increases in the numbers of all family types between 2001 and 2006.The number of couple families (without children) in Aurukun decreased by 4.5%, other familytypes decreased in Napranum by 4.7% and single parent families decreased by 1.2% inSection 16 Social Impact Assessment Page 16-12
Rio Tinto AlcanEnvironmental Impact StatementSouth of <strong>Embley</strong> ProjectMapoon. According to Centre link, single parent families often struggle to meet the high cost ofliving and child care in Weipa as single parent benefit payments are just sufficient to coverbasic living expenses but not the costs of child care.Table 16-5 Annual Change in Family Type, 2001-2006Weipa Aurukun Napranum MapoonCouple family with no children 7.4% -4.5% 3.8% 8.4%Couple family with children 4.9% 3.7% -0.3% 13.9%One parent family 7.7% 1.4% 8.8% -1.2%Other family 36.1% 5.2% -4.7%Source: ABS Census of Population & Housing, 2006Ancestry/EthnicityWhile there is strong proportion of Weipa residents with Indigenous ancestry (23%) comparedwith Queensland (3.2%), Weipa has a high proportion of people of non-Indigenous and northwestern European ancestry compared with the other study communities. This is attributable tothe skilled workers who migrate to Weipa for work from outside of the Western Cape region.The remaining communities all contained populations that were well over 50% Indigenous.Indigenous people made up 91% of the population in Aurukun, 93% in Napranum and 90% inMapoon. This is particularly important, as RTA is committed to providing local Aboriginal peoplewith employment in line with its company philosophy and corporate culture and as part of itsWCCCA commitments. According to RTA records, Indigenous employees accounted for 19% ofRTA employees and local Aboriginal employees accounted for 14% of employees in 2008.Disability/DisadvantageThe total number of disability service users in the local community area was 25 in 2008. Detailsof the types of disabilities are shown in Table 16-6. Locations have been grouped by post codeand disability counts of one or two have been rounded up to three to protect the privacy ofindividuals.This represents approximately 0.47% of the population which is slightly lower than theQueensland state average of 0.49%.Table 16-6 Disability Service Users, 2008WeipaPrimary DisabilitiesNapranumAurukunQueenslandMapoonIntellectual 4 6 8,146Specific learning/ADD 130Autism 2,192Physical 6 3,730Acquired Brain Injury 3 936Neurological 3 1,501Deaf blind 39Vision 351Hearing 3 150Speech 3 56Psychiatric 3 2,112Section 16 Social Impact Assessment Page 16-13
Rio Tinto AlcanEnvironmental Impact StatementSouth of <strong>Embley</strong> ProjectWeipaPrimary DisabilitiesNapranumAurukunQueenslandMapoonDevelopmental Delay 765Not Stated/Unknown 792Total Population (2006) 4,212 1,138 4,290,000Source: Qld Department of Communities Population by Age and Sex, Australian States and Territories, June 200816.2.2 Community Infrastructure and ServicesChild Care/Kindergarten FacilitiesThere are childcare facilities in Weipa, Napranum and Aurukun. All centres currently operate atfull capacity.The Creche & Kindergarten Association of Queensland (C&K) currently operates the Cape KidsChildcare Centre in Weipa which is currently licensed to provide day care services for amaximum of 28 places for children aged 6 weeks to school age. Weipa Community CareAssociation operates a Family Day Care Scheme through the Weipa Community Centre. Thiscaters for children up to the age of twelve years of age. There is also a kindergarten and Preprepoperated by the C&K.Aurukun has a childcare centre which is operating at full capacity. The Napranum ChildcareCentre also has a shortage of places for children. Mapoon does not have a childcare centre atthis time and plans are underway for the development of an early childhood centre through thelocal Indigenous partnership initiative under the auspice of the Queensland Government.In recent years a shortage in childcare places has been identified as one of the priority concernsfacing Weipa and its surrounding communities (SGS 2008). This shortage has often resulted inlengthy waitlists at many of these facilities. In July 2009, Cape Kids had a waitlist of 157families and the waiting time was approximately two years. The Centre was unable to providefor additional childcare places as the number of licensed places was dictated by the physicalsize of the Centre. Similarly Weipa Family Day Care experienced similar shortages. In 2009, theAustralian Government announced funding of approximately $2.1 million to refurbish andexpand the existing Cape Kids Childcare facility in Weipa. This will provide up to 75 places whenit is opened. C&K will operate the new facility using land provided by RTA.None of the childcare facilities provide before and after school care and vacation care. Howeverthe Napranum Police Citizens Youth Club offers a children's activity club which offers a relatedservice.Weipa Community CareThe Weipa Community Care Association is a not-for-profit organisation operating as acommunity centre for individuals and families living in Weipa. The Association is funded by theDepartment of Communities and provides social services and support including: support andreferral for people in crisis situations; counselling to women and children experiencing family ordomestic violence in the communities of Weipa, Napranum and Mapoon; assistance tonewcomers to Weipa who require local information; support for community groups andorganisations to run local events; and local functions that raise awareness of, and fundraisingfor, the Association and other not for-profit organisations. In addition, it manages a communitycafe, second-hand clothing store and family day care.According to Weipa Community Care Association, 2006 data showed that one woman was takenout of the community service provision area every month due to incidents of domestic violence.(At the time of writing, a breakdown of incidents by each community was not available owing toconfidentiality issues in small populations). In the period July-September 2008, WeipaCommunity Care recorded that 36 clients were provided with personal support, includingcounselling services, for incidents of domestic violence. Weipa Community Care also providesSection 16 Social Impact Assessment Page 16-14
Rio Tinto AlcanEnvironmental Impact StatementSouth of <strong>Embley</strong> Projectservices to Napranum, including a healing service, and management of a women's shelter inWeipa to support domestic violence victims.Aged CareThe new Weipa Integrated Health Service (WINS) was opened in February 2009 and providesten aged care beds. The Home and Community Care (HACC) services is a State andCommonwealth-funded service aimed at providing basic maintenance and support services forolder people and young people with disabilities. HACC services are currently provided atNapranum, Mapoon and Aurukun and include community nursing, social support, personal care,centre-based respite, transport, information and advocacy and home maintenance.Given the absence of a dedicated aged care centre in Weipa, as well as the growing numbers ofRTA employees and others retiring in the region, there will be a continuing demand for agedcare facilities and services to cater for the needs of the ageing population. There is also a needfor facilities and services supporting people with disabilities and mental illness.Electricity, Telecommunications, Water and WasteThe electricity supply to Weipa and Napranum is provided by a power station built and operatedby RTA. The plant currently adequately meets the electricity requirements of Weipa, Napranum,and the RTA mining operations. RTA distributes electricity to private consumers under a licencefrom the Queensland Department of Employment, Economic Development and Innovation(DEEDI) (formerly Department of Mines and Energy). All households and businesses are billedfor their electricity based on the regulated price set annually by the Queensland Government forother small and rural communities in Queensland. All RTA employees have their electricitysubsidised.Telstra provides a range of telecommunication services to the communities across the WesternCape including the availability of a landline for residents, Next G mobile phone coverage andinternet services that includes broadband connections.Drinking water in Weipa is sourced from a series of shallow aquifer bores which are then held ina holding dam and elevated reservoir that allows the water to be gravity fed to dwellings. Dueto the low pH levels, lime and chlorine are added to the drinking water to adhere to nationalwater standards. Weekly testing is undertaken to monitor bacteria levels and quarterly testingto determine levels of mineral, hardness and pH variations. At the time of consultation, therewas no metering system in place for Weipa Town Authority (WTA) to charge for residential andcommercial use of water.The Awonga Point Sewage Treatment Plant (STP) which services the entire Weipa town areainvolves a combination of gravity and pump systems and is managed and operated by the WTA.The Lorim Point STP services the Napranum town area and is managed and operated by RTA.The treated effluent enters a series of retention ponds. The treated effluent from the AwongaPoint STP is eventually released into the Mission River and the treated effluent from the LorimPoint STP is released into the <strong>Embley</strong> River. The garbage collection service for Weipa isprovided by the WTA through an external contractor. The waste disposal landfill is locatedwithin the mining lease however it falls outside of the Weipa town boundary. Garbage collectionand waste removal for Mapoon, Napranum and Aurukun communities are all managed by theirrespective Shire Councils. Each of the Shire Councils also operates their respective wastedisposal facilities.Section 16 Social Impact Assessment Page 16-15
Rio Tinto AlcanEnvironmental Impact StatementSouth of <strong>Embley</strong> ProjectTransport InfrastructureThe major road infrastructure in Weipa is supported by the Peninsula Development Road (PDR).The road stretches approximately 800km from Cairns and is the only link, by road, to the otherareas of Far North Queensland. The PDR is maintained by RTA within the lease boundary (ML7024), which is approximately 30km out of Weipa. This road is a vital piece of infrastructurethat supports and facilitates economic development for the Western Cape region. Themaintenance of local Weipa roads is managed by WTA. Roads within communities ofNapranum, Mapoon and Aurukun are maintained by their respective Shire Councils.The existing road network in the vicinity of the Project area, together with details of theproposed traffic routes and infrastructure have been described in Section 14.Air passenger transport in Weipa is available through QantasLink services. QantasLink operatesup to three daily flights from Cairns. The Weipa Airport is owned by RTA and is within the townof Weipa. According to the WTA and Weipa Chamber of Commerce, improving the aesthetics ofthe Airport is one of the key priorities for supporting tourism and business activities in Weipa.Skytrans operates air passenger services to Aurukun from Cairns. In addition to Skytrans thereare also a number of private air charter companies based in Cairns and Weipa who providecharters between Weipa, Mapoon and Aurukun.Australian Customs operates aerial surveillance, with aircraft from the Coastwatch fleet basedand operating out of the Weipa airport. The Royal Flying Doctor Service (RFDS) aircraft are ableto land at airstrips located at Aurukun, Weipa and Mapoon in the case of emergencies.The Port of Weipa is managed by the North Queensland Bulk Ports Corporation Limited (NQBP).The Port of Weipa handles approximately 350 vessels per year (2008 data). The Port of Weipahas wharves at Lorim Point, which is used for the export of bauxite; at Humbug Point, whichhandles general cargo and heavy equipment; and at Evans Landing, which is used forpetroleum products, naval purposes and commercial fishing activities.16.2.3 Health and Emergency ServicesHealthThe Western Cape region is serviced by the Queensland Government through the WINS Unitwhich provides 12 acute beds, 10 residential aged care beds, primary health care, dental,physiotherapy, and District Office administration. Primary health care centres are located inAurukun, Napranum and Mapoon. These facilities are operated by Queensland Health (QH).In addition the communities across the region are serviced through a number of other serviceproviders, including RFDS, various outreach primary health care teams and HACC. A summaryof the all health services provided across the region listed in Tables 16-7 to 16-9.Table 16-7Type of MedicalPractitionerMedical Services in the Weipa Catchment AreaType of Service Local or Visiting Base Frequency/AvailabilityGeneral PracticeFar North Queensland RuralDivision of General Practice(FNQRDGP)Private GPLocal WIHS 51/2 days a week & chargeableafter hours call serviceGeneral Practice(Queensland Health)outpatients/ inpatientsLocal WIHS Eight hours per day five days aweekMedical Emergency (Queensland Health) Local WIHS Medical Officer on callGeneral Practice(Queensland Health)outpatientsVisiting to WIHS GP service four mornings a weekSection 16 Social Impact Assessment Page 16-16
Rio Tinto AlcanEnvironmental Impact StatementSouth of <strong>Embley</strong> ProjectType of MedicalPractitionerType of Service Local or Visiting Base Frequency/AvailabilityNapranumfor three to four hoursGeneral Practice(Queensland Health)outpatientsVisiting to Mapoon WIHS GP service one day per weekequivalent to five hoursGeneral Practice(RFDS contracted toQueensland Health) Primaryhealth careVisiting toAurukunRFDS19hr/weekGeneral Practice(RFDS contracted toQueensland Health) Primaryhealth careVisiting to Coen RFDS 6hr/weekGeneral Practice(RFDS contracted toQueensland Health) Primaryhealth careVisiting toPormpuraawRFDS10hr/weekGeneral Practice(RFDS contracted toQueensland Health) Primaryhealth careVisiting toKowanyamaRFDS6 1/z day coverage, after hourscall arrangements with RFDS callcentreSource: Department of Community Services, Qld HealthTable 16-8Allied Health and Community Health Services Provided in Weipa AreaService type Name of provider Local or visiting Base/locationFrequency/availabilityPharmacy S. McCahon Weipa (shopping centre) 51/2 days a weekAmbulanceQueensland AmbulanceService/QueenslandHealth MOULocal WIHS On callAcute care Queensland Health Local WIHS 12 bedsAllied healthDietetics & diabeteseducationFNQDGP Visiting WIHS Cairns 12 visits per yearPhysiotherapy(private contractor toQueensland Health)Local WIHS 24-hrs publicOccupational therapy Queensland Health Visiting WIHS Cairns 4 visits per yearOral health Queensland Health Visiting WIHS Cairns 4 visits per yearPodiatry FNQDGP Visiting Cairns 9 times yearDentist (currently vacant) Visiting Cairns FortnightlySocial work Queensland Health Local Weipa WeeklyNutritionist Queensland Health Local Weipa WeeklyMaternal and childhealthQueensland Health Local Weipa DailySection 16 Social Impact Assessment Page 16-17
Rio Tinto AlcanEnvironmental Impact StatementSouth of <strong>Embley</strong> ProjectService type Name of provider Local or visiting Base/locationFrequency/availabilityDomestic violence Queensland Health Visiting WIHS Cairns 4 visits per yearSexual assault services Queensland Health Visiting WIHS Cairns 4 visits per yearMental healthPsychology Queensland Health Visiting WIHS Cairns FortnightlyAdult MH Queensland Health Local Weipa WeeklyC&Y MH Queensland Health Visiting WIHS Cairns 6 visits per yearAlcohol and Drugs ServiceEarly identification andintervention serviceQueensland Health Local Weipa WeeklyAged Care AssessmentTeamQueensland Health Visiting WIHS Cairns 2 visits per yearPalliative care supportserviceQueensland Health Local Weipa As requiredContinenceProgram/advisorQueensland Health Visiting WIHS Cairns 12 visits per yearFalls PreventionProgram/educatorQueensland Health Visiting WIHS Cairns 12 visits per yearHACC Servicescommunity nursing Queensland Health Local Weipa As requireddomestic assistance HACC Local Napranum As requiredsocial support HACC Local Napranum As requiredpersonal care HACC Local Napranum As requiredcentre based respite HACC Local Napranum As requiredhome maintenance Council Local Napranum As requiredhome modification Council Local Napranum As requiredtransport HACC Local Napranum As requiredinformation & advocacy HACC Local Napranum As requiredsocial support HACC Local Mapoon As requiredpersonal care HACC Local Mapoon As requireddomestic assistance HACC Local Mapoon As requiredtransport HACC Local Mapoon As requiredSection 16 Social Impact Assessment Page 16-18
Rio Tinto AlcanEnvironmental Impact StatementSouth of <strong>Embley</strong> ProjectService type Name of provider Local or visiting Base/locationFrequency/availabilitycentre based respite HACC Local Mapoon As requiredhome maintenance Council Local Mapoon As requiredAged accommodationResidential Aged Care Queensland Health Local WIHS 10 bedsHostel Napranum Council Local Napranum As requiredCarer support programs HACC Local Napranum As requiredSource: Department of Community Services, Queensland HealthTable 16-9Other Health and Aged Care Services Provided in Weipa AreaOrganisation Hospital/Health Service Services provided Frequency /AvailabilityQueensland Health WIHS 12 acute care beds Medical Superintendent &Senior Medical Officer24/7 emergencyQueensland HealthOutreach primary health careteams (as listed)Nurse and Health workers,Women's healthSexual HealthMental HealthNutritionAll teams run clinics at WIHS intheir specialties, offer training tostaff, taking referrals for individualpatients or groups.However their main role isproviding outreach services towhole of Cape York Health ServiceDistrict PHC Centres.Provide periodic Nurse & Healthworker based services on theWIHS campus (e.g. Women's andSexual health clinic every secondFriday)Renal/Diabetes PreventionAlcohol Tobacco and otherDrugsQueensland HealthNapranum PrimaryHealth Care Centre(PHCC)Primary health care andchronic disease management3 x Registered Nurses,5 x Indigenous Health workersMonday to Friday. After hourscare is provided at WIHSQueensland HealthMapoon PHCCPrimary health care andchronic disease management2 x Registered Nurse and2 x Indigenous Health WorkersMonday to Friday. After hourscare is provided at WIHSQueensland HealthAurukun PHCCPrimary health care andchronic disease management6 x Registered Nurses,6 x Indigenous Health workersSeven days per weekSource: Department of Community Services, Qld HealthRTA operates an Occupational Health Centre on-site for all employees to utilise for any healthissues or concerns. Services offered include specialist physiotherapy, wellness assessments,optometry and general health checks. Counselling services for all RTA employees are providedby Assure Programmes through their Employee Assistance Programme. This includes fortnightlyvisits to Weipa by counsellors.There are a number of key social and health issues that have been reported as key barriers toachieving positive health outcomes and which also affect employment. These have beenhighlighted in both the Weipa Community Baseline Assessment (SGS 2008) and in theAboriginal and Torres Strait Islander Partnership (ATSIP) Quarterly Reports on Key Indicators inQueensland's Discrete Indigenous Communities (Queensland Government 2008). The issueshighlighted include alcohol and drug use, alcohol related harm, poor diet and hygiene, andfamily relationship breakdowns. Alcohol and drug related illnesses are common to bothIndigenous and non-Indigenous populations in the Western Cape region. RTA has adopted aSection 16 Social Impact Assessment Page 16-19
Rio Tinto AlcanEnvironmental Impact StatementSouth of <strong>Embley</strong> Projectstrict alcohol and drug policy to ensure that RTA employees and contractors operate and fulfiltheir duties in a safe work environment.Alcohol Management Plans (AMPs), a Queensland Government initiative, are currentlyimplemented across a number of Cape York communities, including Aurukun, Napranum andMapoon. AMPs contain a set of recommendations on reducing alcohol related crime andviolence via restrictions in the sale and consumption of alcohol. The regulations apply to allpeople in the restricted area, whether they are a resident, visitor or tourist passing through.Weipa does not have an AMP which, at times, has resulted in people from neighbouringcommunities driving to Weipa to purchase and consume alcohol. The Queensland Police Servicenotes that incidents of drink driving are considered to be high amongst the people travelling toand from the restricted communities.ATSIP notes that Aurukun is one of four communities working with the Queensland andAustralian governments to address the impacts of alcohol abuse (Queensland Government2008). The aim of the Alcohol Reform Program, which is part of the broader Welfare ReformProgram that commenced in 2007, is to improve service delivery to Aurukun residents. Thisincludes the provision of alcohol and drug treatment services and enhanced community andsport and recreation activities that form a key component of alcohol demand reductionstrategies.One of the key components of the program is the formation of Family and ResponsibilitiesCommission (FRC) that has membership from the Aurukun community. The role of FRC is torefer those individuals and families in difficulties to the relevant services and program providedby various government agencies and service providers. The Commission's inaugural meetingwas held in June 2008 and the Aurukun Commissioners have been active in the communitysince that time.A community wellbeing centre that provides drug and alcohol, family violence, gambling andgeneral counselling support has operated in Aurukun since December 2008. The Aurukun Well-Being Centre is designed to improve the availability of health services. It provides a communitybasedapproach to treating addiction and related mental health issues, addressing familyviolence, reinforcing social norms and facilitating pathways out of treatment to employment andeducation. The services offered by the Well-Being Centre include assessments, counselling,support, case co-ordination and referrals to other services. The Centre is being managed underthe auspices of the Royal Flying Doctor Services (RFDS). Well-Being Centres are also beingestablished in other Cape York communities, including Coen, Hope Vale and Mossman.Emergency Services and ResponseRTA's Weipa fire and rescue services team comprises ten fire and rescue officers and a fire andrescue crew leader. Fire and rescue officers are based at both Lorim Point and Andoomstations. The stations are manned 24 hours a day, seven days a week.The primary role of the fire and rescue team is to provide emergency (fire and first aid)response to the Weipa operations, deliver training on-site and issue permits (e.g. confinedspace, hot work). In specific prescribed circumstances the fire and rescue team may berequested to support the local Queensland Ambulance Service in responding to communityincidents.An ambulance service is provided through the WHIS to the Weipa local area, includingNapranum and is on call 24 hours a day, seven days a week. There are State EmergencyService units in Weipa and Aurukun. The Weipa unit services Napranum and Mapoon.RTA's Weipa operations maintain, and implement as required, a detailed Business Resilienceand Recovery (BRR) Plan (otherwise known as an "Emergency Management Plan").The current BRR Plan is written to allow for management and development of an appropriateresponse to any type of emergency situation. However the plan includes specific proceduralguidance for appropriate response to a wide range of threats that have been identified as apotential risk at the Weipa operations. It includes, but is not limited, to:Section 16 Social Impact Assessment Page 16-20
Rio Tinto AlcanEnvironmental Impact StatementSouth of <strong>Embley</strong> Projectaircraft incident;major fire/explosion;fatality/fatalities;natural disaster (including cyclone);vehicle incident;loss of communications / information technology;workplace violence;widespread illness (including influenza pandemic);loss of utilities; andloss or potential for loss of structural integrity of tailings storage facility.The implementation of the BRR Plan during construction and operational phases of the Projectis detailed in Section 19.3.16.2.4 Educational Facilities and ServicesPre-prep to Year 12The Western Cape College (WCC) is the main education service provider in the Western Caperegion. The College currently services the schooling needs of Weipa, Mapoon, Napranum andAurukun communities. In 2009, the WCC had enrolled approximately 1,200 students across thethree campuses of Mapoon, Aurukun and Weipa. According to the WCC, the enrolment ofAboriginal students has increased in the last seven years. The average attendance rate for allstudents in 2007 was 81%. The Weipa campus caters for approximately 960 students from Preprepto senior (Year 12). The Aurukun campus offers classes from years 1 10, and had a totalenrolment of 253 in 2008, whilst the Mapoon campus provides classes from pre-prep to year 6with an enrolment of 28 in 2008. The Napranum campus of the WCC was closed in 2005 withNapranum students now attending the Weipa campus, travelling by bus each day.In 2008, the WCC Special Education Unit had 47 students enrolled from pre-prep to year 12across campuses in Aurukun, Mapoon and Weipa (refer Table 16-10). The facilities for theSpecial Education Unit in Weipa and Aurukun are both new.Table 16-10 Special Education Unit Demographics (2008)Pre-prep to Year 12Aurukun Weipa MapoonIndigenous 20 16 1Non Indigenous 0 10 0Total 20 26 1A new resource centre (library) was completed in 2008 at the Weipa campus and a newperforming arts complex, administration building, and multi-purpose facility was completed in2009. In 2010, a new science and technology centre was constructed at the Weipa campus.The WCC also maintains a strong partnership with the Weipa Youth Hostel which provides livingaway from home boarding facilities for Indigenous students from neighbouring communities.The WCC is committed to the Senior Education and Training Plan Service Guarantee for Capeand Torres Strait Schools. This ensures that all high school students upon graduation receiveeither an Overall Position (OP) score (an eligible OP score is required for school leavers to enterinto Queensland tertiary education providers such as universities), complete a school-basedapprenticeship or traineeship, be on a clearly articulated vocational and technical educationSection 16 Social Impact Assessment Page 16-21
Rio Tinto AlcanEnvironmental Impact StatementSouth of <strong>Embley</strong> Projectpathway or gain employment. The outcomes for year 12 students completing their schooling in2008 are reflected in Table 16-11.Table 16-11 Outcomes for Year 12 Students (2008)Outcomes Number / 0/0Total number of Senior Certificates awarded 29Percentage of Overall Position (OP)-eligible students with OP 1 15 67%Percentage of students awarded Senior Certificates and awarded a Vocational Education and training (VET)qualification76%Percentage of students awarded Senior Certificates with OP-eligibility or awarded a VET qualification 79%Percentage of Queensland Tertiary Admissions Centre (QTAC) applicants receiving an offer 100%Vocational and Technical Education ProgramThe Tropical North Institute of TAFE has a regional campus located in Weipa that also servicesthe communities across the Western Cape region. Post-secondary education and trainingprograms are delivered in Weipa for specific courses. Another role of the TAFE campus in Weipais to link employers and employment service providers with qualified trainees and apprentices.The campus currently delivers the following training programs:4x4 Vehicle TrainingDriver TrainingVocational Literacy and NumeracyCertificate II IV Business and Business AdministrationCertificate III & IVCertificate III & IVVisual Arts and Contemporary CraftAboriginal and Torres Strait Islander Cultural Arts.A number of other programs are delivered by distance learning through the main campus inCairns with local support provided by the Weipa campus.Available traineeships in the region are filled largely by local Aboriginal people (LAP). Traineesare generally placed into roles at RTA, with State Government agencies or local businesses.As at the end of December 2009, RTA employed 24 trainees (approximately 1/3 female and 2/3male) across a range of areas including plant operators, mine operators, laboratory assistant,administration, rail maintenance, electrical maintenance, childcare, warehousing, environment,hospitality, engineering and local law/animal control. Recent years have seen the retention ratefor trainees increase with the introduction of a range of support programs by RTA.Since the commencement of the RTA Local Aboriginal Traineeship Program in 2002 there havebeen over 160 participants in the program. The number of trainees who have now transitionedinto full time employment is 39. This includes trainees who have progressed to anapprenticeship.RTA also currently hosts 37 apprentices (including 11 Indigenous apprentices) who areemployed by Cairns Regional Group Training. Apprenticeships are offered across site in a rangeof areas including diesel fitting, electrical, fitting and turning, civil construction and boilermaking.Education and training has a direct impact on recruitment of local people by RTA. The companysupports education and training programs in the community and various initiatives have beenestablished with RTA's support and as partnerships with key stakeholders to increase educationand employment outcomes of Indigenous non-Indigenous people in the Western Cape region.Some examples of these include:university scholarships for Western Cape College graduating students;Section 16 Social Impact Assessment Page 16-22
Rio Tinto AlcanEnvironmental Impact StatementSouth of <strong>Embley</strong> ProjectRTA sponsored academic awards for English, Science and Mathematics;vacation work opportunities for students attending university who come from Capecommunities;support through RTA Donations Program for the Foot In The Door Program, UniversityTours and various school groups attending regional and state academic programs suchas Tournament of the Minds; andcareer education, including site visits and work experience for local students attendingboarding school.Tertiary EducationWeipa has a higher proportion of residents with post-secondary education qualificationscompared to Aurukun, Napranum and Mapoon. Those residents with university degrees are alsoconcentrated in Weipa. Holders of Certificate qualifications (either Certificate I, II, III or IV)accounted for 26% of people aged 15 years and over in Weipa compared to 2% in Aurukun,10% in Napranum and 20% in Mapoon. The percentage of Certificate holders in Weipa (26%)and Mapoon (20%) is greater than the Queensland state average of 18% while the percentagesin Aurukun (2%) and Napranum (10%) are lower. Between 2001 and 2006 people aged 15 andover who possessed a Certificate qualification rose 1% in Weipa. However, this groupdecreased by 0.9% in Aurukun, 8% in Napranum and 10% in Mapoon (SGS 2008).16.2.5 Employment and Economic ProfileThe 2006 labour force numbers and participation rates in the four communities of the WesternCape region are presented in Table 16-12 [note: Community Development EmploymentProject (CDEP) program participants are counted by the ABS as employed persons]. Weipa hasthe region's highest labour force participation rate of 79% followed by Mapoon (66%),Napranum (48%), and Aurukun (47%). The Weipa and Mapoon labour force participation rateis higher than that for the FNQ SD and Queensland (63% and 62% respectively). TheNapranum and Aurukun labour force participation rates are significantly lower. The labour forceparticipation rate refers to the number of people who are either employed or actively seekingwork, as a percentage of the total population aged 15 years and over.Table 16-12 Labour Force Participation, 2006Total labour forcePopulation aged 15 yearsand olderLabour force participationrate2001 2006 2001 2006 2001 2006PercentagechangeWeipa 1,481 1,751 1,989 2,235 74.5% 79.1% 4.7%Aurukun 430 334 717 704 60.0% 47.4% -12.5%Napranum 299 261 466 546 64.2% 47.8% -16.4%Mapoon 83 113 131 172 63.4% 65.7% 2.3%Source: ABS Census of Population & Housing, 2006The employment rates in the local area community in the 2006 Census data have been stronglyinfluenced by the inclusion of CDEP participants in employment statistics. The CDEP is aCommonwealth Government-funded initiative. The program operates in remote areas andprovides work-readiness training and work experience. It also supports community developmentprojects and aims to build the capacity of Indigenous organisations and communities.The CDEP program continues to operate in communities where there are limited economicopportunities, including Aurukun, Napranum and Mapoon. The program ceased in areas withestablished economies on 1 July 2009.Section 16 Social Impact Assessment Page 16-23
Rio Tinto AlcanEnvironmental Impact StatementSouth of <strong>Embley</strong> ProjectIn the Western Cape communities of Aurukun, Mapoon and Napranum, the CDEP isadministered by Community Enterprise Australia (CEA), which manages a number of CDEPfunded enterprises.The latest available data on CDEP participant numbers in the Western Cape region is availablefrom the 2006 Census. Because CDEP payments are classified as a wage, the ABS counts CDEPparticipants as 'employed' in the Census. However, the participation in CDEP projects fluctuatesregularly and the CDEP employment can be extremely variable in terms of the nature ofactivities undertaken and the degree to which those activities could be considered 'gainfulemployment'.The CDEP payment is equivalent in monetary terms to an unemployment benefit payment.According to CEA, the perception of 'employment' generated by the ABS data on CDEP fails toidentify some important qualifications. Perhaps the most important of these is that, while CDEPis classified as a wage, many of the participants have expressed the opinion that they "don'twant to participate in CDEP work but are told that they have to". For CEA's part, this presentschallenges administering and managing the CDEP. These challenges are compounded byfluctuating participation (i.e. participants failing to show up for work on a regular basis,participants not willing to work more than a few days a week, etc.) and the on-going challengeof funding operations such as the machinery and equipment required for the various CDEPenterprises run by CEA in the region.If, as the ABS defines it, CDEP is considered 'real' employment, then it can be considered toprovide for a significant share of employed persons in Weipa and the Western Cape (as at2006). However, if CDEP is not considered as 'real' employment, unemployment rates amongstthe Aboriginal communities in the region can be considered to be much higher than otherwisestated. This would also reduce the labour force participation rate so long as those people werenot considered to be actively seeking work, that is, those registered as unemployed.Employment by SectorFigure 16-11 shows the number of jobs available in each of the four communities based onthe sector of employment and Indigenous status of the employees. Private sector employmentis relatively high in Weipa for both Indigenous and non-Indigenous people in comparison to thatof the other communities, where government employment is dominant. Weipa's high proportionof Indigenous and non-Indigenous private sector employment is largely attributable toemployees and contractors engaged in RTA's operations. Employee and contractor workforcenumbers for 2006-2008 are presented in Table 16-3 along with projections for the stageddevelopment of the Project. The local, regional and State-wide direct and indirect employmentgenerated by the Project is discussed in Section 17.4.Section 16 Social Impact Assessment Page 16-24
Rio Tinto AlcanEnvironmental Impact StatementSouth of <strong>Embley</strong> Project100%90%80%GovernmentPrivate70%60%50%40%30%20%10%0%incccula)'5 cWeipacozincin cc ca)cucr,'5 cla)'5cozincca)cr,'5incccula)'5cozincca)cr,'5in=ccula)'5cozincca)cr,'5AurukunNapranumMapoonSource: ABS Census of Population & Housing Working Population Profiles, 2006Figure 16-11 Employment by Industry Sector (Government and Private), 2006UnemploymentThe unemployment rate at the time of the 2006 Census was 1.4% for Weipa, significantly lowerthan FNQ SD (4.4%) and Queensland (4.7%) (refer Table 16-13). However, theunemployment rates were higher than both the State and the region in Aurukun (8.1%) andNapranum (5.7%).Table 16-13 Employment in Weipa, Aurukun, Napranum and Mapoon, 2006EmployedpersonsUnemployedpersonsLabour forceUnemploymentrate 2001Unemploymentrate 2006Weipa 1,729 22 1,751 2.6% 1.4%Aurukun 307 27 334 3.5% 8.1%Napranum 246 15 261 4.3% 5.7%Mapoon 110 3 113 3.6% 2.7%FNQ SD 107,468 4,991 112,459 7.0% 4.4%Queensland 1,824,997 90,950 1,915,947 8.2% 4.7%Source: ABS Census of Population & Housing, 2006As identified above, if CDEP is not considered as 'real' employment, the numbers of unemployedpeople in the Aboriginal communities of the Western Cape are significantly higher than thosefigures shown in Table 16-13.In Weipa, according to the 2006 Census data, CDEP participation is minor with a total of 63Indigenous workers and three non-Indigenous workers involved in the program during 2006.Nevertheless, according to the 2006 data, this constituted 4% of total employment, 22% ofIndigenous employment and 0.2% of non-Indigenous employment. Whilst these figures maySection 16 Social Impact Assessment Page 16-25
Rio Tinto AlcanEnvironmental Impact StatementSouth of <strong>Embley</strong> Projectappear to be small, given the smaller proportion of Indigenous people in Weipa, it has asignificant impact on their unemployment rate.If the CDEP is considered employment, the Indigenous unemployment rate in 2006 was 3%. IfCDEP is considered to be unemployment, then the rate of Indigenous unemployment in 2006was significantly higher at 24%. Non-Indigenous unemployment averaged 1% in both cases(refer Table 16-14).Table 16-14 Indigenous and Non-Indigenous Emp oyment, Weipa, 2006If CDEP was classified as employmentIf CDEP was classified as unemploymentIndigenous Non-Indigenous Indigenous Non-IndigenousEmployed: CDEP 63 3 0 0Employed: Other 225 1,438 225 1,438Total Employed 288 1,441 225 1,438Unemployed 9 13 72 16Total Labour Force 297 1,454 297 1,454Not in the labour force 99 169 99 169Not stated 24 11 24 11Total Population (15years and over)420 1,634 420 1,634Unemployment rate 3.0% 0.9% 24.2% 1.1%Proportions of employmentdue to the CDEP21.9% 0.2% 0.0% 0.0%Source: ABS Census Indigenous Population Profile, 2006In 2006, 21% of Indigenous employment present in Weipa was directly attributable to CDEP,which is low when compared to the other Western Cape communities with 81% in Aurukun,71% in Napranum and 66% in Mapoon.In summary the employment classification of CDEP workers significantly affects theunemployment statistics of Aboriginal communities of the Western Cape.Indigenous Employment and Training InitiativesRTA Weipa operations have increased the representation of local Indigenous and overallIndigenous people in their workforce steadily since 2004 (refer Table 16-15). Under theWCCCA, local Indigenous employees are defined as people with direct links to one of the 11Traditional Owner groups who are signatories to the Agreement. This includes any Indigenouspeople connected to the Traditional Owner group by marriage or adoption or a personrecognised as a local Indigenous person by the WCCCC.Section 16 Social Impact Assessment Page 16-26
Rio Tinto AlcanEnvironmental Impact StatementSouth of <strong>Embley</strong> ProjectTable 16-15Employee CategoryIndigenous Employment, Weipa OperationsYear2004 2005 2006 2007 2008Total Employees 688 723 777 825 912Local Indigenous Employees 53 (9.4%) 90 (12.4%) 101 (13.3%) 109 (13.0%) 128 (14.0%)Total Indigenous Employees 90 (13.0%) 118 (16.3%) 136 (18.0%) 156 (19.0%) 181 (19.8%)During 2009, market conditions were significantly affected by the Global Financial Crisisresulting in lower demand for Weipa bauxite. RTA's Weipa operations reduced production to16.8Mdpt. As a consequence, RTA undertook a series of initiatives to reduce labour whilstminimising reductions in employee numbers. Overall, RTA reduced approximately 90 employeeroles and significantly restructured the Weipa operations. During this period, local Indigenousemployment rates were maintained at between 13.8 15.2% of the total workforce throughoutthe year and the total Indigenous representation was approximately 21%.RTA recognises that the employment of local Indigenous persons offers the opportunity for thebusiness to increase retention rates. The retention rate for local Indigenous employees hastypically been close to the site average and during the second half of 2009 trended higher thanthe site average. At the Weipa operations, Indigenous employees have proportionally highernumbers in semi-skilled/operator and administrative roles, however there is currently underrepresentationin professional and leadership roles.Whilst RTA has continued to increase representation of local Indigenous and other Indigenouspersons in its workforce, it is recognised that a number of significant social barriers continue toaffect the work-readiness levels of people living in Western Cape communities. This hasrequired RTA to take a long term approach to employment and training and implementstrategies targeting specific communities, rather than adopt a one-size-fits-all approach.An example of this has been the implementation of a pilot program specifically for Aurukunknown as the RTA Destinations Program. The program has recently completed its second yearof the pilot program and provides a staged approach to employment for people moving fromCDEP to full time employment in RTA's operations. The program involves a structuredrecruitment and selection process that includes site visits to the mining operations in Weipa andextensive community and stakeholder engagement. Stage 1 provides a 13-week focus on workreadiness and life-skills development conducted by Myuma Pty Ltd at its facilities nearCamooweal in north-west Queensland. Participants successfully completing this stage progressto Stage 2, a 4-month work sampling placement at RTA Weipa operations. The final stage is a4-month fixed-term contract at RTA's operations. All participants who successfully completethree stages are guaranteed a full-time position with RTA at the end of the program. The pilotprogram has provided the opportunity to identify a number of aspects of the program that needto be addressed to increase the success rate of participants moving through each stage. Aformal review of the program is now planned, in collaboration with Traditional Owners and theWCCCC in order to identify and implement improvements to the program.Programs such as the Local Aboriginal Traineeship Program and the RTA Destinations Programhave highlighted the significant barriers that still exist for many Aboriginal people looking topursue a career in the mining industry. The most significant of these are; low levels of literacyand numeracy, high levels of dependence on other people to assist with day-to-day tasks (e.g.banking, transport arrangements, financial management), lack of a driver's licence, familyrelatedissues (e.g. multi-family households, family obligations, caring for family members,homesickness, living away from children, inter-family disputes), poor ability to self-managealcohol and drug consumption, and health concerns (including cardio-vascular disease anddiabetes).As part of an organisational restructure conducted at RTA's operations in 2009, the HumanResources and Training department, incorporating Indigenous Training and Development andSection 16 Social Impact Assessment Page 16-27
Rio Tinto AlcanEnvironmental Impact StatementSouth of <strong>Embley</strong> ProjectEmployee Support Teams was established. The new department oversees the development andimplementation of Indigenous employment, training and development initiatives includingcoaching and mentoring, employee support, school-to-work pathways, local Indigenoustraineeships, career pathway development, stakeholder engagement (including workingcollaboratively with job network providers, local/state/federal government agencies andcommunity organisations) and engagement with Traditional Owners through the structure andprocesses established through the Employment and Training Sub-Committee, under theWCCCA.Employment by OccupationThe occupations of employed persons in the study area at the time of the 2006 Census areshown in Figure 16-12. The majority of employed residents from Weipa are technicians andtrade workers (23.3%), followed by machinery operators and drivers (18.7%), andprofessionals (13.5%). In the three communities of Aurukun, Napranum and Mapoon, workingresidents are mostly employed as labourers (46.6% of residents in Aurukun, 48.2% inNapranum and 49.5% in Mapoon). These occupations reflect the occupations of mining andrelated industries.There are also a significant number of community and personal service workers in thesecommunities, and Aurukun also has a relatively high proportion of professionals.60%50%40%Wei p aAurukunNapranumMapoon30%20%10%0%Ncnita) a)ozS .,2>ozS 473. a,c)E o a) u .072 oE ( 30o E03L) a.)0_OccupationILAa) EC o a.)'_E >V )-03 a) -o( r.seLFigure 16-12 Occupational Profile, 2006Source: ABS Census of Population and Housing, 2006Employment by IndustryThe proportional representation of employment by Australia and New Zealand StandardIndustrial Classification (ANZSIC) in Weipa compared to the FNQ SD is presented inFigure 16-13. There is no data available for Aurukun, Napranum and Mapoon. Mining andMineral Product Manufacturing was clearly the largest employer, accounting for 43% of residentjobs in Weipa followed by Education and Training (9%), Public Administration and Safety (9%),Healthcare and Social Assistance (6%) and Retail Trade (6%). By way of comparison, RTA datashows 884 persons were engaged by RTA in 2006 as direct employees or contractors. The 2006Census data shows a total employed workforce of 1,729 in Weipa. Assuming the mineSection 16 Social Impact Assessment Page 16-28
Rio Tinto AlcanEnvironmental Impact StatementSouth of <strong>Embley</strong> Projectworkforce was all based in Weipa, the mine-related workforce would have constituted 51% oftotal employment at that time. However, if it is assumed that the mine-related workforceconstituted 43% of total Weipa employment (as per 2006 Census data) this would imply thatabout 58 members (6.6%) of RTA's 2006 workforce were residing outside Weipa,predominantly in Napranum.The industry breakdown clearly shows the integral nature of the mining industry to the Weipacommunity.a)0>a)>-0o croE Ea)L.r.)"C)rom45%40%35%30%25%20%15%100/05%0%WeipaFar North SD6 .z.e" 'c-., o). 'c.' "C. C4,-0, . (.7 e 7woe,,-i,.e' & 0*-. oc c6- e oc ,tCKo , c, , ,c. .6, 4 ,c. sc,.* co- ,-Asc\c' ce- \ce- \e,(1 6, ,,,.).9
Rio Tinto AlcanEnvironmental Impact StatementSouth of <strong>Embley</strong> Project45%40%35%30%+e25%20%15%10%5%0%n,e ;4,yyyo4,, e40 e etiop toYWeipaAurukunNapranumMapoonFar North SDFigure 16-14 Gross Individual Income, 2006Source: ABS Census of Population & Housing, 2006The weekly household income in the four communities for 2006 is presented in Figure 16-15,and compared with the FNQ SD. Household income was largely in the higher income ranges forthe Weipa area whilst for the Aurukun, Napranum and Weipa communities, household incomewas lower. Weipa performed better than the FNQ SD with regard to household income, havingover 50% of households with weekly income in the top four income ranges. The other threecommunities were lower than the FNQ SD as a whole, with over 50% of households for bothNapranum and Mapoon with a household income of between $1 and $649.30%25%Weipa Aurukun0 Napranum MapoonFar North SD20%15%10%5%+e0%Hunt,c) of, ,c) cp 0, e1, '1, Cs Co A cP '32 CP ci) cPtati 4,0' cfy cy 51 51 51N. 5.? 51.1' 521'' ecP t2 t2 51 sot r 4 § te e 0,5§) e .:§Y etoY toY taY toYFigure 16-15 Household Income, 2006Source: ABS Census of Population & Housing, 2006Section 16 Social Impact Assessment Page 16-30
Rio Tinto AlcanEnvironmental Impact StatementSouth of <strong>Embley</strong> ProjectWeipa Household Expenditure PatternsThe Queens /and Household Expenditure Survey published by the ABS for 2003-2004 provides abasis to estimate the average household expenditure on goods and services by Weipa residentsin 2008 (refer Figure 16-16). No data was available for Aurukun, Napranum and Mapoon. Thedata was extracted based on a trending of the expenditure items by the income profile of theWeipa study area (extracted from 2006 Census data), with all figures expressed in 2008 dollars.The major expenditure items for households in Weipa are currently housing costs (rent andmortgage), food and beverage costs and transport, with approximately $200 a week spent oneach.$250$200$150$100$50$ 04.e.: 469 & ofp.c K:- K\ 69oe' 0 43 cv4' 4' 69 N6 e 1> If.(- .-.` - a c° ,.x.e%
Rio Tinto AlcanEnvironmental Impact StatementSouth of <strong>Embley</strong> ProjectIndustry Businesses % of TotalAccommodation, Cafes & Rest. 15 22.4 %Transport & Storage 8 11.9 %Finance & Insurance 1 1.5 %Property & Business Services 4 6 %Health & Community Services 3 4.5%Cultural & Recreational Services 6 8.9 %Total 67 100 WoSource: Weipa Biz, 2009; localbusinessguide.com.au, 2009The number of businesses in Napranum, Aurukun and Mapoon is low and it is not possible tobreak them into a percentage of industry type (refer Table 16-17).Table 16-17 Local Businesses in Aurukun, Napranum and Mapoon, 2009BusinessAurukun General StoreAurukun Wetland ChartersAurukun EarthmovingWik ProjectsWik MediaAurukun Arts and Craft CentreCape York Turtle Rescue/Camp ChivareeMapoon SeafoodsMapoon StoreNapranum Takeaway ShopNanum TawapNapranum FarmAthelpen & PuuchAddressAurukunAurukunAurukun / CairnsAurukun / CairnsAurukunAurukunMapoonMapoonMapoonNapranumNapranumNapranumAurukunSource: Weipa Biz, 2009 and information provided by RTA, August 2009.16.2.6 Housing and AccommodationHousehold SizeThe 2006 Census found that in Weipa the most common household sizes were two people perdwelling (30%) and single person households (21%). The average Weipa household size was2.7 people, marginally above the Queensland average of 2.6. The most common household sizein Aurukun and Napranum was six or more (49% and 26% respectively). The average Aurukunhousehold size was 5.7 people, which indicates a high degree of overcrowding. The mostcommon household size in Mapoon was single person occupancy (28%, or 14 of 60 householdssurveyed). These households probably represent relatively short term residents involved insupport services for the community. Household sizes are shown in Figure 16-17.Section 16 Social Impact Assessment Page 16-32
Rio Tinto AlcanEnvironmental Impact StatementSouth of <strong>Embley</strong> Project60%50%OneTwoThreeFourFiveSix or more'15 30%a)roro(1)id 20%a)10%0%rWeipa Aurukun Napranum MapoonFigure 16-17 Household Size, 2006Source: ABS Census of Population & Housing, 2006Housing TypeThe 2006 Census found separate houses comprised the large majority of housing stock in allfour communities, with only Weipa containing semi-detached houses and unit type dwellings.Each community had a small proportion of "other dwellings", defined by the ABS as improvisedhomes, tents, sleep outs and caravans. Housing types are shown in Figure 16-18.100%90%80%70%60%50%40%30%20%10%0%WeipaIIAurukunNapranumMapoonSeparate houseEl Flat, unit or apartmentDwelling structure not statedSemi-detached, row or terrace house, townhouse0 Other dwellingFigure 16-18 Household Type, 2006Source: ABS Census of Population & Housing, 2006Section 16 Social Impact Assessment Page 16-33
Rio Tinto AlcanEnvironmental Impact StatementSouth of <strong>Embley</strong> ProjectHousing TenureThe housing tenure profile of the four communities is presented in Figure 16-19. According tothe 2006 Census, fully owned dwellings accounted for 6% of all dwellings in Weipa, whilst 85%of dwellings were rented. This data is now outdated due to the sale of houses by RTA toemployees. Rental accommodation is the most prominent tenure type in Aurukun (61%),Napranum (95%) and Mapoon (91%). The housing in Napranum is owned by the Council, withthe exception of State housing and one church house which is not the same as "privateownership" in the mainstream sense. Aurukun reported 35% "other tenure types", a categorywhich includes households which are occupied under arrangements other than by renting,owning or under the process of purchase. The likely reason that this tenure classification is soprevalent in Aurukun is because almost all of the housing stock is owned by the Aurukun ShireCouncil.100%90%80%70%60%50%40%30%20%10%0% NMWeipa Aurukun Napranum MapoonFully owned Being purchased Rented Other tenure type Tenure type not statedFigure 16-19 Tenure Type, 2006Source: ABS Census of Population & Housing, 2006According to 2006 Census data, housing cooperative/community/church groups provided 70%of all rental accommodation in Aurukun, 61% in Napranum and 66% in Mapoon. The Stateprovided 39% of rental households in Napranum.In Weipa, 77% of rental properties were categorised as a residential/caravan park, governmentemployer and private employer. In 2006, RTA as a private employer would have dominated thiscategory. This data is now outdated due to the sale of houses to RTA employees.Details of rental accommodation types are presented in Figure 16-20.Section 16 Social Impact Assessment Page 16-34
Rio Tinto AlcanEnvironmental Impact StatementSouth of <strong>Embley</strong> Project90%80%2" 700/o60%50%10%0%WeipaAurukunNapranumMapoonPrivate landlord0 Person not in same householdState or territory housing authorityo Housing co-operative/community/church groupResidential/Caravan park, government employer and private employer 0 Rental type not statedFigure 16-20 Rent Type, 2006Source: ABS Census of Population & Housing, 2006Rental Costs and AvailabilityWeekly rental costs in Weipa, Aurukun, Napranum and Mapoon based on the 2006 Census arepresented in Figure 16-21. The high proportion of low rental costs in Weipa in 2006 reflectedthe high proportion of RTA supplied rental accommodation at the time. The vast majority ofrental properties in Aurukun, Napranum and Mapoon rented for less than $100 per week in2006. In September 2009, Weipa Real Estate listed 10 dwellings (houses, units, duplex) forrent. Three bedroom house rents ranged from $440 to $650 per week. This compares to typicalweekly rentals of $250 to $350 for three bedroom houses in Cairns. The cost differential istypical of remote area rents when compared to large east coast urban centres.Section 16 Social Impact Assessment Page 16-35