Embley
Marine - part 1 (PDF 960 KB) - Rio Tinto Alcan
Marine - part 1 (PDF 960 KB) - Rio Tinto Alcan
- No tags were found...

You also want an ePaper? Increase the reach of your titles
YUMPU automatically turns print PDFs into web optimized ePapers that Google loves.
Environmental Impact Statementfor South of<strong>Embley</strong> ProjectSection 6Marine
Rio Tinto AlcanEnvironmental Impact StatementSouth of <strong>Embley</strong> Project6 MARINEThis section describes the existing physical and biological marine environment including waterquality and sediment properties in the vicinity of the SoE Project area, the associatedenvironmental values, and any potential impacts associated with the Project.The general study area, used to describe the existing marine environment and predict theenvironmental impacts from the Project, includes:Albatross Bay (including rivers and creeks) bound by Jantz Point in the north andPera Head in the south, and extending further south to Thud Point (refer Figure1-1);<strong>Embley</strong> and Hey River estuaries; andan area extending 17km westward, offshore from Boyd Point.This area includes all marine components of the Project including the proposed port site, theproposed spoil ground offshore of Boyd Point, the existing Albatross Bay spoil ground, thelocation for barge and ferry facilities at Hornibrook Point and Humbug Wharf in the <strong>Embley</strong>River, and the location for the proposed barge/ferry terminal in the Hey River.The State Coastal Plan describes how the coastal zone is to be managed as required by theCoastal Protection and Management Act 1995 (Qld). Within the State Coastal Plan, RegionalCoastal Management Plans specify the policy framework at the regional level and identify keycoastal sites requiring special management within the region. Of the 11 coastal regionsidentified for Queensland, four Regional Coastal Management Plans have been finalised andthree are under development. Development of Gulf of Carpentaria and Cape York PeninsulaCoast regional plans has not yet commenced.Following public consultation and review of the 2002 State Coastal Management Plan, the draftQueensland Coastal Plan was released for public comment on 25 August 2009 and closed on 30November 2009. Submissions made during this period are currently being considered. TheQueensland Coastal Plan will replace the State Coastal Plan once finalised.6.1 Physical Environment and Coastal Processes6.1.1 BathymetryThe bathymetry (seabed topography) from Boyd Point to Thud Point was surveyed by 3-DMarine Mapping Pty Ltd during August 2006. In the vicinity of the proposed port developmentbetween Boyd Point and Pera Head, the mapping identified an upper-beach perched below highcliffs. The existing beach profile and proposed wharf jetty structure are presented in Figure6-1. The nearshore bathymetry contours indicate that depth increases rapidly offshore. Theseabed falls from 3m to 12m at Lowest Astronomical Tide (LAT) over the first 500m, levellingto 16m approximately 2km from shore. Detailed bathymetry beyond 2km from shore, for theextent of the departure channel, has not been completed and is not proposed. Navigationcharts indicate a uniform grade. Description of the seabed and bathymetry in the vicinity of keyoffshore areas, including the new spoil ground, entrance channel and Nine Mile Reef, is basedpredominantly on drop-camera video inspection.The nearest substantial sensitive seabed features include reefs and outcrops at Boyd Point2.8km north-east of the proposed port area and Pera Head 2km south-west. Isolated reefs alsooccur south of Pera Head to Thud Point (refer Figure 6-18). Satellite imagery indicates theremay be numerous small reef outcrops between Thud Point and Aurukun; however theirpresence have not been verified via bathymetric survey due to their distance from the proposedPort site and very low likelihood of impact from turbid plumes generated by dredging.Seabed features in the departure channel area have been investigated using drop camera videoand essentially comprise open seabed with infrequent low density aggregations of soft corals orsponges.Section 6 Marine Page 6-1
Rio Tinto AlcanEnvironmental Impact StatementSouth of <strong>Embley</strong> ProjectThe proposed new spoil ground located 17km (central point) offshore from Boyd Point islocated in approximately 23m water depth to LAT and is locally characterised by a flat,unvegetated, soft sediment seabed. The spoil ground is proposed to have a radius of 0.5nautical mile (nm). Drop camera video survey within and adjacent to the spoil ground did notidentify any small scale features, such as patch reefs. The nearest substantial seabed feature tothe proposed spoil ground is Nine Mile Reef which is located approximately 6km to the southsouth-west.18inSea Level (RL = Om).RE 3.2.6 (Casuarina Equisetifdia Woodlandj.SandTransitionRedBauxiteFigure 6-1Beach Marine Profile and Proposed Jetty Structure.6.1.2 Existing Coastal Processes and HydrodynamicsCoastal processes and the hydrodynamics around the proposed port development area wereassessed in the study using numerical models and analysis of collected field data. Currents,water levels, wave heights, plumes, and sediment transport were predicted with numericalmodels and compared against recorded data where practical. The predicted results were alsoused to ascertain the level of impact on the marine environment from proposed development inthe coastal zone.Full hydrodynamic modelling was undertaken using MIKE21 software (Danish Hydraulic Institute(DHI), a two-dimensional depth-integrated hydrodynamic modelling program. This software isan industry standard for modelling marine environments.A large-scale hydrodynamic model of the Gulf of Carpentaria (referred to as the Outer model)and a fine-scale model around the proposed port development site (referred to as the Innermodel) were developed (refer Figure 6-2 and Figure 6-3). Bathymetry data from thefollowing sources was used to assess coastal processes and hydrodynamics, sedimentmovement and turbidity effects from dredging at the proposed port and placement at theproposed new spoil ground:Australian Bathymetry and Topography Grid June 2005, Geoscience Australia;Australian Hydrographic Chart 410, Booby Island to Cape Wessel including the Gulf ofCarpentaria. Scale 1:1,000,000 at Latitude 27°15';Australian Hydrographic Chart 376, Australia to Papua New Guinea. Scale 1:300,000at Latitude 27°15'; andHydrographic survey of the study site between Boyd Point and Pera Head to producebed contours between 3 and 15m at one-metre intervals to LAT datum (3D MarineMapping Pty Ltd).Hydrodynamic modelling of dredging at Hornibrook ferry terminal, Humbug barge terminal andHey River barge/ferry terminal and disposal at the Albatross Bay spoil ground was notundertaken given the relatively minor volumes to be dredged (i.e. approximately 19,000m3,10,700m3 and 17,300m3 respectively).Section 6 Marine Page 6-2
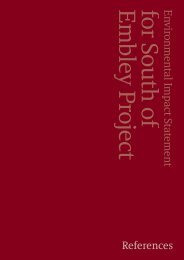
Rio Tinto AlcanEnvironmental Impact StatementSouth of <strong>Embley</strong> Project92000009100000900000089000008800000 ,8706060860000085000008400000Bathymeiry [rn]0- 5-5- 0I8300000 -10- -5I. -15- -10liM -20- -15= -25- -20-30- -258200000=I -35- 30IM -4o- -35- -45 - -40-so-4s8100000 ME -55- -50-60 55=I - 55 --80-70 558000000 = Below -70Undefined Value, .0200000 400000 600000 800000Figure 6-2Gulf of Carpentaria Bathymetry and Model BoundariesSection 6 Marine Page 6-3
Rio Tinto AlcanEnvironmental Impact StatementSouth of <strong>Embley</strong> ProjectLEGENDStorm tide gaugeDERM wave buoyBeacon 886600008650000Beacon 2Acoustic Doppler Current Profiler864Q0008630000-6620000 =86100008600000WeipaE85900002 858000008570000-8560000-SoE Port site8550000854000085300008520000 j85100008500000480000II.I,....II.,,,,,,500000 520000 540000 560000 580000 600000EastingBalhymetryAbove-4-I-1 -8 - 4Al -12- -a- 18 - -12I= -20 1824 -2028 -24- 32 - -28-36 32- -35I= -44 - -40- 48 --44- 52 --48MI -56 -52Below -58Undefined ValueFigure 6-3Inner Model Flexible Mesh Bathymetry and Model Boundaries withObservational Data Locations.The Outer (Gulf) model has two open boundaries (refer Figure 6-2):the western boundary, which extends from Cape Wessel to the south-western tip ofDolak Island; andthe eastern boundary, which extends from Shelbourne Bay to Bramble Cay.Global tide model predictions, incorporating the major tidal constituents, were obtained at theouter model open boundary extents and are presented in Figure 6-4. The timing andmagnitude of the tidal water level over the length of each open boundary was expected toshow variation. This was represented in the model by applying a linear variation in predictedtide level between:Cape Wessel and Dolak Island for the western boundary; andShelbourne Bay and Bramble Cay for the eastern boundary.Section 6 Marine Page 6-4
Rio Tinto AlcanEnvironmental Impact StatementSouth of <strong>Embley</strong> Project2.0Cape Wessel trnjDolak Island [m]Shethoume Bay [m]Bramble Cay [m]1.0E0.0Co7C0 -1.0IA,p -2.0,r)-3.0-4.000:00 00:00 00:00 00:00 00:00 00:00 00:002007-05-22 05-24 05-26 05-28 05-30 05-01 06-03Figure 6-4Global Tide Model Prediction at Outer Model Open Boundary ExtentsAcoustic Doppler Current Profiler (ADCP) instrument deployment at the proposed port site(location indicated in Figure 6-3) provided measurements of current speed, current direction,and water level useful for hydrodynamic model verification. Additional water level data for theWeipa region collected by the Queensland Department of Environment and ResourceManagement (DERM, formerly the Queensland Environmental Protection Agency, EPA) wasprovided by Maritime Safety Queensland (MSQ). The data included both the Weipa storm tidegauge predictions and observations (MayJune 2007) and a time-series (JulyAugust 2003) ofobservational data from "Beacon 2", located toward the western extent of the existing Weipashipping channel (refer Figure 6-3).Three model simulations were performed, with each simulation covering a differentobservational data period. Outer model verification plots of MSQ observed/predicted versussimulated water levels are presented in Figure 6-5 and Figure 6-6. Model verification at theWeipa storm tide gauge (MayJune 2007) and at Beacon 2 (JulyAugust 2003) was generallygood in terms of the magnitude and timing of flood and ebb tide peaks, noting some overpredictionof peak water levels during neap tides. Small discrepancies between the observedand predicted water levels may be attributed to meteorological effects (e.g. atmosphericpressure or local wind effects) which are not typically included in the simulations during modeldevelopment and/or the Outer model boundary conditions not incorporating the minor tidalconstituents.Section 6 Marine Page 6-5
Rio Tinto AlcanEnvironmental Impact StatementSouth of <strong>Embley</strong> ProjectGulf model predictionImiWeipa storm surge gauge (MSQ) - observed (mj -,Weipa storm surge gauge (IvISCI) - predicted [m] '30.5Ai0' Aii' AiGtty -0.507-1.500:00 00:00 00:00 00:00 00:00 00:00 00:002007-05-22 05-24 05-26 05-28 05-30 06-01 06-03Figure 6-5Outer Model Water Level Prediction Compared with Weipa Storm TideGaugeGulf model predictionWeipa No 2 Beacon observed [m]0.5Co2-15-00:00 00:00 00:002003-07-28 08-02 08-0T00:0008-12Figure 6-6Observed Water Levels at Beacon 2 Compared with Gulf ModelPredictionVerification of the Inner model was achieved by comparing water level, and current speed anddirection against measurements from the ADCP deployed at the Boyd Point site. Goodagreement between measured and modelled hydrodynamics in the study area was found (referFigure 6-7).The Inner hydrodynamic finite-volume model (flexible mesh) was used in plume modelling andto quantify current speed and direction information to assess the potential impacts of turbidity,siltation, and sediment mobilisation as a result of dredging and disposal.Section 6 Marine Page 6-6
Rio Tinto AlcanEnvironmental Impact StatementSouth of <strong>Embley</strong> ProjectADCP water level [m]Inner model water level [rn]E0.5co 0.0-1 509:00 00:00 00:00 00:00 00:00 00:002007-05-08 05-10 05-12 05-14 05-16 05-180.25ADCP current speed Irnis1Inner model current speed [Ws]0.200.15V, 0.100.0500:002007-05-0800:0005-1000:0005-1200:0005-1400:0005-1500:0095-18I I IADCP current direclion [deg]Inner model current direction [deg]200150-100I5009:00 00:00 00:00 00.00 00'002007-05-10 05-12 05-14 05- 6 05-18Figure 6-7Measured (ADCP) Data Compared with Inner Model PredictionPredicted peak flood (incoming) and ebb (outgoing) tide current vectors at the proposed portsite are presented in Figure 6-8 and Figure 6-9. Current vectors over the tide cycle indicateflow from the north-east or south-west depending on the tidal phase. Peak model currents areapproximately 0.3m/s. ADCP measurements demonstrate the current speed is relatively uniformover depth.The existing wave climate within the area is described in Section 6.1.4 and the estimate ofannual longshore sediment transport is reported on in Section 6.1.5.The coastline between Boyd Point and Pera Head is relatively straight and has a bearing of 2100with respect to true north (i.e. 210°N). Above the water line the beach is relatively wide andcontains a substantial volume of sand material. Nearshore beach slope immediately above andbelow the water line is steep inferring a reflective beach type (i.e. convex profile that reflectslow wave energy).Under existing coastal conditions, the shoreline either side of the proposed port developmentarea appears to be uniform, inferring a balance of sediment supply in and out of thecompartment.Section 6 Marine Page 6-7
Rio Tinto AlcanEnvironmental Impact StatementSouth of <strong>Embley</strong> Project65731300 ////.////85721}GG ///////////.,., '/////1,- '/------- '\-:',..'--///////// i:////// " M1,, -..,-//// pl i17/61/611111/1/1857"" /////////////////////:.V.4f.85700cc//////////////////////////// /.////////i///////// p/Vlif7/// f'8569000 / 0/ / Z.,,-"'.1--- .g"' / si./..- :. 0..5 mes85680013560090 562000 564000 E:ECCC EEMCC E7CCCC E72CCC21:00:00 1940442007 Time Step 1646 of 6760.>Figure 6-8Predicted Peak Flood Tidal Currents at Proposed Port Dredging Area35730008572000857100C85700008569000856800056000C 5E2000 56400C1 2:?C:00 20(04(2007 Time Step 1fiagwpo.5E6000 E.:8CCC E7CCCC E72CCCFigure 6-9Predicted Peak Ebb Tidal Currents at Proposed Port Dredging AreaThe supply of sediment to this part of the coast appears to originate from:nearby river systems such as the <strong>Embley</strong> and Archer River catchments;dunes and indurated sand and clay cliffs; andoffshore marine sediments.During severe storms, scarping or lowering of the existing beach profile is expected. The typeof response will depend on the presence and depth of firmer underlying strata. During severestorms, when surge is combined with high tide, wave run-up will also erode the cliff at the backof the beach, transporting sediment into the littoral system.Coastal process modelling was undertaken to assess the potential for shoreline change due tothe construction of the proposed wharf and dredging. In particular, two aspects were analysedin detail to determine the influence on coastal processes:potential long-term changes to the alongshore profile and back-beach brought aboutby the required deepening of the inshore area through dredging and a qualitativedescription of the potential influence of the wharf trestle structure; andSection 6 Marine Page 6-8
Rio Tinto AlcanEnvironmental Impact StatementSouth of <strong>Embley</strong> Projectpotential for upper beach profile sediments reaching the berths due to cross-shoretransport during storm events.A discussion of these potential impacts is provided in Section 6.9.1.6.1.3 Currents and TidesWeipa is the closest standard port to the Project area with sufficient tidal data for analysis. Thetidal signal at Weipa is predominantly diurnal (daily cycles) with short periods of semi-diurnaltides at times of neap tides.The tidal planes at the Weipa tide gauge located at Humbug Point (1.752m above LAT) areshown in Table 6-1. Heights are also shown in Australian Height Datum (AHD).Table 6-1Weipa Tidal PlanesTidal Plane Metres above LAT Metres above AHDHAT (Highest Astronomical Tide) 3.38 1.63MHHW (Mean High High-Water) 3.0 1.2MLHW (Mean Low High-Water) 2.2 0.4MSL (Mean Sea Level) 1.85 0.10MHLW (Mean High Low-Water) 1.5 0.3MLLW (Mean Low Low-Water) 0.7 1.1LAT = Lowest Astronomical TideAHD = Australian Height DatumThe tide prediction does not always fully explain the tidal observations at Weipa. Meteorologicalconditions acting over time can transfer additional energy to tidal signals, resulting in higher orlower water levels than the predicted values.The tidal signal in the Project area is almost identical to Weipa, with a slight phase shiftresulting in the high tide being slightly later than at Humbug Point.Current data at the proposed port site was collected over the 2006-07 and 2007-08 periods.Measurements were taken with an ADCP located in 10 to 14m of water at Boyd Point. TheADCP recorded data at six-minute intervals and currents were measured at every half-metredepth over the water column. Little variation of current was observed with depth. Average peakspring tide currents were approximately 0.25 meters per second (m/s). Average peak neap tidecurrents were 0.15m/s. Currents are predominantly aligned with the coast, typically between210 and 220°N during flood tides and between 30 and 40°N during ebb tides. The depthaveragedmeasured current speed and direction over a four-week period during AprilMay 2007is presented in Figure 6-10.Section 6 Marine Page 6-9
IRio Tinto AlcanEnvironmental Impact StatementSouth of <strong>Embley</strong> ProjectADCP current speed tails]02572 0.20-in a)a)e - O. 15C0.10U0.050.00 1 100:002007-04-2300:0004-2800:00 00:00 00:00 00:0005-03 05-08 05-13 05-18ADCP current direction [deg]2502- 200coI 1 iI)J 01 0 il II il 0 f I rili illW.2 isci-100-C-7 5G00:00 00:00 00:00 00:00 00:00 00:002007-04-23 04-28 05-03 05-08 05-13 05-18Figure 6-10Depth-averaged Measured Current Speed and Direction at Study Site6.1.4 WavesSmooth seas are frequently present at the Project site in the dry season (May to November).The westerly afternoon summer sea breezes are the only conditions favourable for generationof local seas.Other than local seas, wave events are generated by the following during the wet season:tropical cyclones, tracking some distance away, that propagate waves towards BoydPoint;tropical cyclones that track over the proposed SoE Port site. The largest waves areproduced if conditions are conducive to onshore winds; andmonsoon winds that occasionally blow over long fetches that may commence in theArafura Sea. Although these winds are not the same strength as cyclonic winds theystill generate very active sea conditions in the Weipa area.DERM has operated a long-term wave buoy site in Albatross Bay since 1978. Recorded summerdata from this site indicates that significant wave heights (Hsig) are below 1m for more than95% of the time. Hourly wave data statistics were also collected at the study site from August2006 to March 2008. During this time two notable wave events occurred, one associated withTropical Cyclone Nelson on 6 February 2007 and the other with ex-Tropical Cyclone He /en on 7January 2008. The highest significant wave heights at the site during Tropical Cyclone Nelsonwere 3.5m from the north-west, characterised by peak energy wave periods (Tn) of tenseconds.Section 6 Marine Page 6-10
Rio Tinto AlcanEnvironmental Impact StatementSouth of <strong>Embley</strong> ProjectThe wave measurements shown in Figure 6-11 are associated with strong winds from thenorth-west that were generated by Tropical Cyclone Nelson's low pressure system in thesouthern half of the Gulf of Carpentaria, as shown in Figure 6-12.L.crd4.03.53.02.5_,A) 2.0d)1.5Hsig VII]1.0 -_0.500.00 00:00 00.00 00:002007-01-28 02-02 02-07 02-1212Tp [sec]0-E- 8-c,.23 6it 71w000.00 00:00 00.00 00:002007-01-28 02-02 02-07 02-12350Peak Dir (deg]300 Aru-c,250cs 200 =U.5 1) 150di0. W 100-50 -_, .00:00 00100 00:00 001002007-01-28 02-02 02-07 02-12NEwNote: Reliable directional data was not available after February 8, 2007Figure 6-11Boyd Point Wave Data Statistics during Tropical Cyclone NelsonSection 6 Marine Page 6-11
Rio Tinto AlcanEnvironmental Impact StatementSouth of <strong>Embley</strong> ProjectQUIKS0AT NRT Winds 070205 ascendingo pi ?Sr 20/- /251 X. - 3..f X157 45 >5D knot7r7r- 17n- 1,ir- A;___r %4%1.r-.A1/rrA71 y 4,17, /ft-+5'-P7-- er-n-- ?)--- r r, :Fp " ,,.._-..- 0- sr-- r, -'-ft' '.5, ",r"4-7.-.nr- ,',...N., 1,,f7pH,,,l-fp-- ,,, [1: ,r.,. r5s- *,1/-- /Tr-. :0--,--- 4,-, ''.1- 1, r -in-,- .2.,, -2, ,.... :..k_ -., .2,, .,...54r., ..5:,..e>... 2',, 'A''. `'.. 'r-, 'Z_'''' .7:-'t''-'4.- N\'...7,".4--'' r ,,,- -9.'-- ..5,-. -"'''': '',--:,7 ''>.'. tr..'aril rirrrarrir-'77:: 1.N.4, t,4 4 rm- t,,,.;.: ,:, 94 4 1'%.Fr- gr--...:lki'i, -.., -i.\,,x...:\?i, -,,, '-', ,-,, '-',t,.-,,'%',.--, \,,,...1 x,,::;\ 41 .0.0,,,,. \ ,..., ,,,,1,0, "...fi: \'' ...-;..k%.,,')--..41.--..7-. ,,,._.'''''k75- r-r rr-.".4.,.1_. ..-'" r FirT '''.. \ A'V- F-0---rr-P-- ''\ 'R) - _.iii-ii _I,`,--a Ju_u -I'-I)t.e.-Alj _i! ,_ii4 -ii J.iery '120 12,5 130 135 140145 lal20:47the at IDS.3)111,103 C.1.117.- IS L4 MEI For 11,,JJ 4101[1., 1.19,3 111[11..I13 pass:L.1e ruin OVICINT1111.1011NOWNESDIS/Offae of Research and ApplicationsFigure 6-12 Tropical Cyclone Nelson Wind Field 5 February 2007A Holland wind model and a SWAN (Simulating Waves Nearshore) wave model were used tosimulate 15 historical events and to obtain a time series of wave parameters at the study sitefor inclusion into the coastal process models used to assess shoreline changes. A regular gridwas developed, with a mesh resolution of 2km to suitably resolve the wind field. Wind fieldsused to generate waves acting on the study site can be of a regional scale and, to representthese, the model extents included the whole of the Gulf of Carpentaria, as shown in Figure6-13.Coastal processes were modelled by using wave height, period and direction informationextracted from the wave model results at the proposed port site.Modelled wave heights were compared with the actual DERM wave buoy measurements (nondirectional)located in Albatross Bay. As shown in Figure 6-14, the relationship is reasonablylinear. However, wave heights at the buoy site are limited by depth.The relationship between modelled mean wave direction at the proposed port site and at theDERM wave buoy site is shown in Figure 6-15. Wave refraction in the shallower water ofAlbatross Bay accounts for differences in mean direction.Figure 6-16 indicates that for the wave events modelled, directions were predominantly fromthe north-west, west, and south-west sectors. More of the large waves occur in the south-westand west sectors shown in Figure 6-16, resulting in higher sediment transport up the coasttowards Boyd Point. As the alignment of the shoreline between Pera Head and Boyd Point isapproximately 210°N, waves from the north-western sector tend to arrive at the shorelinesquare-on, resulting in minimal longshore movement.Section 6 Marine Page 6-12
Rio Tinto AlcanEnvironmental Impact StatementSouth of <strong>Embley</strong> Project550500Dolak IslandPapua NewGuinea450el400350 ~_eacgc).GgCL-003902502901501005000 50.-.1... , ,. , + ,- -. -. s.. . 1 11. 1 1 1 \ 11.. 1. N. \ \..... .., .... \ \ ,,,- . . , ,,,,. .... \ \ \ \r-- --, , ,--- "-.. \ 1 %, -- -- ..-- -- --- --- ..., ,, \ \ \ ; ;,. , .- -- --- --- -- --.----..,..\\ \ ; \ t.... ...- ..-- N.\-- -- / r / .." --0 .- N/ / /dr di.1 I i% / / / I t \---/ iiiiI t % 1 t 1 \ -,... r' o' /\ '' '''- r- ..- .., .,,- -I100 150 200 250Grid spacing 2000m1 1 ,1 1 1\ \\ 11 1I I %tI1 I/ IJKarumba300 350Weipa50 m/sFigure 6-13SWAN Wave Model Boundaries with an Example of Tropical CycloneWind Field0.0M 3iXw20 1 2 3 4Hs (m), SoE port site5 6 7Figure 6-14Modelled Highest Significant Wave Height at Proposed Port vsMeasured at BuoySection 6 Marine Page 6-13
Rio Tinto AlcanEnvironmental Impact StatementSouth of <strong>Embley</strong> Project360 0315>. 270z225CCw180135asa)2 9045Mean Dirbuoy = 0.8875 Mean Dirport + 10045 90 135 180 225 270 315 360Mean Dir, SoE port siteFigure 6-15Modelled Mean Wave Direction at Proposed Port vs Measured at Buoy10080604020IINE E SE S SWWave direction (propagating from)NWNFigure 6-16Modelled Wave Direction Frequency of Occurrence at Proposed PortSite6.1.5 Sediment MovementThe beach either side of the proposed port site is relatively straight as shown in Plate 6-1.Longshore transport of beach sand occurs during storm events and the extent depends onwave height, direction, and storm duration. Calculations, using modelled wave data, show thatover time there has been a net movement of approximately 12,000m3 of beach sand percyclone season transported towards Boyd Point. The largest single sand movement event of86,000m3 towards Boyd Point occurred during Tropical Cyclone Dominic in April 1982.Mobilisation of fine sediments surrounding the dredge area is a function of the cohesive or noncohesivenature of the material and the bed stresses that are able to be developed underprevailing current and wave conditions. The material within the dredge area mainly consists ofcohesive sediments at least out to about 4km from shore where sediments increase significantlyin sand content (refer Section 6.5.4.2). Once the current and wave conditions overcome thecritical bed-shear stress, sediments will begin to move.Normally the critical bed-shear stress is not greater than 0.3N/m2 for a weakly consolidatedmud and 1.2N/m2 or greater for a moderately consolidated mud (mud is the combined silt andclay fractions).Section 6 Marine Page 6-14
Rio Tinto AlcanEnvironmental Impact StatementSouth of <strong>Embley</strong> ProjectCalculations show that the critical bed-shear stresses are exceeded when significant waveheights are larger than 1m during a neap tide, assuming the bed is weakly consolidated. Duringspring tides, the peak flood and ebb current forces alone are almost enough to initiate sedimentmotion and any additional wave action exceeds the critical bed-shear stress associated withfresh deposits of fine sediments. Larger waves will result in high concentrations of the fine bedmaterial in suspension and higher turbidity of the waters around Weipa and the Project area.Changes in sediment movement as a result of the wharf trestle structure and berth dredgingarea are discussed in Section 6.9.1.Plate 6-1View at Beach Level Looking South (towards proposed port site)6.2 Marine Protected Areas, Conservation Areas and Biodiversity AreasSection 7.2 discusses protected areas, conservation areas and biodiversity areas from CapeYork to the Project area. These relate largely to terrestrial habitats and wilderness areas whichmay include riverine and estuarine habitats including the <strong>Embley</strong> and Hey Rivers.There are currently no similar protected, conservation or biodiversity areas specific to themarine environment. However, there is a current proposal by the Queensland Government todeclare a fish habitat area (FHA) under the Fisheries Act 1994 over the northern portion ofAlbatross Bay. Public consultation on the matter is currently being conducted. The area ofAlbatross Bay concerned is that north of 12° 36' 00" south. The existing Albatross Bay spoilground and Port of Weipa entrance channel are south of the boundary of the proposed FHA.The Australian Government is currently completing the marine bioregional planning process forthe North Marine Region which covers more than 715,000 square kilometres of ocean coveringthe Gulf of Carpentaria, Arafura Sea and the Timor Sea as far west as the Northern TerritoryWestern Australian border. Within the region, five "Areas for Further Assessment" have beendefined. "Areas for Further Assessment" are not the proposed boundaries for new marinereserves. Instead, they are intended to aid further analysis of information at a more detailedscale and assist in the design of new marine reserves. Based on ecological information andinformation obtained from key stakeholders on human activities within the "Areas for FurtherAssessment", the location and zoning arrangements of a new network of marine reserves willbe developed. The Project area is not included within any of the five areas being furtherassessed.Section 6 Marine Page 6-15
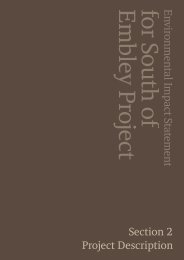
Rio Tinto AlcanEnvironmental Impact StatementSouth of <strong>Embley</strong> Project6.3 Marine HabitatsAlbatross Bay is recognised as containing environmentally important marine habitats (Baker andSheppard, 2006). Key benthic marine habitat components and their associated environmentalvalues in the vicinity of the Project marine infrastructure are discussed below and include:inshore and offshore reefs;mangroves;seagrass; andsoft sediments.6.3.1 Benthic Habitat Survey MethodsBenthic (sea floor) habitat surveys were completed within the Project area during October2007, June 2008, November 2008, June 2009 and June 2010. A combination of towed videosled and drop camera video techniques were adopted for this study, allowing the survey ofmultiple sites in a short period, providing key information to describe the distribution andstructure of benthic habitats. Towed video sled was used over low profile soft sedimenthabitats. Towed video transects covered a distance of 100m and had a field of view ofapproximately 0.5m width. Drop camera video was used over patchy reef habitat, seagrassareas and the proposed port entrance channel. The field of view was approximately 0.5m width.Vision was captured as the boat drifted, ranging from about 20m to 50m transect lengths.Detailed reef habitat surveys also utilised drop camera video methods at grid point (referSection 6.3.1.1) and captured an area of 0.5m x 0.5m using a frame. In-water surveys werenot undertaken due to potential safety risks posed by salt water crocodiles in the area. Refer toFigure 6-17 and Table 6-2 for survey locations and techniques.6.3.1.1 Detailed Reef Habitat SurveysDetailed drop camera video and towed video sled techniques were used between Pera Headand Boyd Point (inclusive) to systematically survey sponge, soft coral and fringing hard coralreef habitats in the immediate vicinity of the proposed port development during October 2007and June 2008. These techniques assess the percentage of live benthic cover, provide diversityestimates via still imagery analysis and allow mapping of habitat distribution. Detailed samplinggrids incorporating 125m spacing were applied over Pera Head and Boyd Point, facilitating theinspection of approximately 415 benthic survey sites. The Coral Point Count with ExcelExtensions software (CPCe Version 3.4) was used to analyse still images obtained from thevideo footage. Benthic community cover and diversity was assessed by randomly locating 20points over each image. The underlying benthic biota from these 20 points was classified asfollows:coralmassive coral, branching coral, tabulate coral, encrusting coral, foliose coral;gorgonian coral;hydroids;sponges;soft coral;algae brown macroalgae, green macroalgae, red macroalgae, coralline algae,seagrass; andother biota anemone, ascidians, holuthurians,zoanthid, nudibranch, bryozoan, crustacean, sea pen.sipunculid,bivalve, gastropod,Section 6 Marine Page 6-16
Pera,550000 1 560000 1 570000 1 580000i,,/\--J'--`21ALEGENDDrop video locationsTowed sled video transect pathsWEIPA.....,.... Proposed port facilityAlbatross Bay\ Spoil Ground .ss'---AlbatrossBayHumbug Point-.. ,.. Hornibrook<strong>Embley</strong>PointHey Point------.,- 1./Source InformationConceptual port layout and dredge areaExtracted from SOK-2231-00001_Q.dwg supplied by client 19/05/2010Mound 3---Proposed, i,..--, '. .. AAS'f .Mound 2--A,,Ground. i ._...,Mound 1, 1I Opk...... .."A ANine MileA AReefAA0 5 10kmSCALE 1200,000 (at A3)Map Grid of Australia Zone 54Geocentric Datum of Australia 1994NW4ESAhud PointJHeadBoyd PointEFER TO INSETProposedPort AreaAAAAAAA0 1km1 550000 1 560000 I570000 1580000 1590000APORT AREA INSET A 0A°CBAThis map incorporates. a which is0 commonwealth of Australia (Geoscience Australia) 2011The commonwealth give no warranty regarding the accuracy, completeness, currency or suitability for a, particular purpose.WorleyParsons Servic s Pty LtdWhile every care is take . ensure the accuracy of this data, vvorleyParsons makes no representation or warranties about itsreliability, com leteness or suitability for a, particular purpose and disclaims all responsibilit and all liability (includingwithout ation liability n the for all expenses, losses, damages (including indirect or cons. en.I damage) and costswhch might b e irr. ncucares ult of the data being inaccurate or incomplete in a, way and for any r asonRef er to K A17.305-146 ,,I,..map,1467,4 00 EN DAL 0053 E(videoSurveyLocations) wor for prey i04/04/201126/07/201021/07/2010Re-issued for reviewRe-issued for squad checkIssued for squad checkKMNAKMus version of mapRev Dale Revision Description DRN CHK ENG APPDrTiWorleyParsonsresources &energyRIO TINTO ALCANSOUTH OF THE EMBLEY PROJECTMMMZMZ1iaFigure 6-17 Sub-tidal Video Survey LocationsProject No: 301 001 -01 069 Figure: 01069 00 GM DAL 0017 Rev: CCompiled by BRISBANE GEOMATICS SECTIONKATAG01001 -01069 \ GMTAL\ 01069 00 GM EN 0017 C(Sub tidal_Video).wor
Rio Tinto AlcanEnvironmental Impact StatementSouth of <strong>Embley</strong> ProjectTable 6-2 Benthic Habitat SurveysLocationNumber ofTowed Transects orDrop Video Drift SitesMethodSurvey dateProposed disposal ground 18 Towed sled Oct 07Mounds areas (10km WNW from the port) 9 Towed sled Oct 07Proposed port area 9 Towed sled Oct 07Sub-tidal soft reef area (150m south of theport)9 Drop video Oct 07Hey River Terminal Preliminary inspection Drop video Oct 07Hey River Terminal 10 Drop video Nov 08Hey River Terminal 12 Drop video June 09Hornibrook Terminal Preliminary inspection Drop video June 08Hornibrook Terminal 11 Drop video June 09Humbug Terminal Preliminary inspection Drop video June 08Humbug Terminal 7 Drop video June 08Pera Head** Preliminary inspection Drop video Oct 07Pera Head 299 (points on grid) Drop video June 08Boyd Point** Preliminary inspection Drop video Oct 07Boyd Point 114 (points on grid) Drop video June 08Pera Head to Thud Point 19 Drop video June 10Port area departure channel 20 Drop video June 10Nine Mile Reef 4 Drop video June 10** Preliminary inspection following identification of hard coral reefs6.3.1.2 Dominant Reef Habitat SurveysThe distribution of dominant reef habitat types (hard coral or soft -coral sponge) betweenBoyd Point and Thud Point were determined through site inspection following inference fromavailable bathymetric charts, bathymetric survey commissioned by RTA and interpreted aerialphotography. Slope analysis overlain with detailed contour information was also applied toassist in the delineation of reef patches. Drop camera video inspection was undertaken at PeraHead and Thud Point to assist in confirming the inferred presence of these reef areas. Detaileddrop camera video surveys (described below) in 2007 and 2008 had already confirmed theextent of reef habitats at Pera Head and Boyd Point.Drop camera video inspection was also undertaken from Nine Mile Reef approximately 6kmsouth-south-west of the proposed disposal ground. This is the nearest substantial seabedfeature to the proposed spoil ground.Inspection of potential reef habitat south of Thud point was not undertaken due to the very lowlikelihood of turbid plumes extending inshore beyond Thud Point. This was confirmed throughturbid plume modelling (refer to Section 6.9.2.2).6.3.2 Inshore and Offshore Reef HabitatsWhile the vast majority of the Gulf of Carpentaria consists of open sandy and muddy habitats,some reef habitat occurs. Fringing and nearshore reefs occur on many parts of western CapeYork and are recorded in parts of Albatross Bay, including much of the southern foreshore andJantz /Duyfken Point (Baker and Sheppard 2006), but are generally poorly mapped.The iron stone formations present along the western Cape York shoreline support thedevelopment of shallow fringing hard coral and soft benthos reef communities. Reef habitatsimilar to what is present within the Project area is located approximately 75km to the north ofAlbatross Bay, in the vicinity of the mouth of Port Musgrave (refer Figure 1-1 for regionalmap). Dog Reef extends approximately 7km to the south of the mouth of Port Musgrave andSection 6 Marine Page 6-18
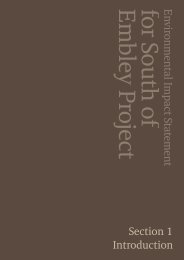
Rio Tinto AlcanEnvironmental Impact StatementSouth of <strong>Embley</strong> Projectaverages about 800m in width. It is a rocky algal reef system with patchy live hard and softcoral cover along its deepest fringe. Kerr Reef is situated approximately 16 km north-north westof the mouth of Port Musgrave, and supports a high live hard coral cover compared withinshore reef areas (Pers. obs. T. Koskela 2009).There are also recently discovered deeper sub-tidal reefs in the Gulf of Carpentaria that are wellbelow the surface and consist of a thin and patchy veneer of live corals (Harris et al. 2004).None of these deeper reefs are known to occur in the vicinity of the study area.6.3.2.1 Proposed Port AreaNear shore fringing reef communities in the vicinity of the proposed port area occur at BoydPoint, Pera Head and between Pera Head and Thud Point. These comprise both reefs containinghard corals and low profile reefs containing soft coral sponge assemblages. The reef habitatshave established primarily over ironstone formations. Overall, reef systems between Boyd Pointand Thud Point covered approximately 418ha (refer Figure 6-18), comprising 144ha ofvalidated reef extent and 274ha of inferred reef. A breakdown of reef habitats is included inTable 6-3.Three abiotic habitats silty sand, coarse sand and rock were identified around Boyd Pointand Pera Head. Video results confirm the presence of fringing and submerged reefs located atBoyd Point, approximately 2.0km north of the proposed port, and Pera Head approximately2.8km south of the proposed port. These reefs cover an area of approximately 49ha and 72ha,respectively. Results of percentage cover for sponges, soft corals and hard corals are presentedin Figure 6-19. Percentage cover of reefs between Pera Head and Thud Point was inferredfrom the detailed Boyd Point and Pera Head survey on the basis that the reefs occupied similarinshore environments and appeared similar during drop camera video inspections.Hard corals over the reef areas include species from the following genera: Porites, branchingAcropora, Turbinaria, Monitipora, Lobophyllia, Platygyra, Pavona and Favia. Identification ofcorals to species level was not possible as this would have required scientific divers enteringwaters where saltwater crocodiles pose a safety threat. While hard corals are present, there isalso abundant sponge and soft-coral fauna and marine algae.Two small patches of submerged sponge and soft coral reef occur 150m south of the proposedport, and another two approximately 1km north-east of the proposed access channel. Together,these habitats total approximately 23ha. Sponge and soft coral assemblages adjacent to PeraHead are estimated at 48ha (refer Figure 6-19). Inferred extent of sponge soft coral habitatbetween Pera Head and Thud Point is estimated to be approximately 117ha.A summary of reef areas and extent of their dominant benthic assemblage (hard coral orsponge soft coral) is provided in Table 6-3.Table 6-3Inshore Reef Areas and Extent of Dominant Benthic AssemblagesLocationTotal area(ha)Hard Coral(ha)Sponge Soft Coral(ha)Boyd Point 49 49 0Port area (between Boyd Point to Pera Head) 23 0 23Pera Head 72 24 48South from Pera Head to Thud Point (inferred) 274 157 117Images of benthic habitats from Boyd Point reef, Pera Head reef, the port area, Thud Point reefand open benthic habitat within the departure channel area are provided within Plate 6-2.Section 6 Marine Page 6-19
0 5 10kmSCALE 1:250,000 (at A4)Map Grid of Australia Zone 56Geocentric Datum of Australia 1994Nine MileReef.., I/ Port channel..- ,,,, dredge areaProposedspoil ground ,Cm 010C141Boyd PointSeagrass locationsLEGENDUnconfirmed reef locationsIndicative Reef Classesc, q..... iilliiiiiiiiiiii Hard coral'lirPera HeadSoft coralPe- Thud PointN'Nk,,,,,. Extent of dredge area2006 Aerial PhotographySupplied by client December 2008BathymeteryExtracted from bathy.dwg suppled by client December 2008Conceptual Port Layout and Dredge AreaExtracted from SOK-2231-00001_Q.dwg supplied by client 19/05/2010Indicative Seagrass LocationsIIIQueensland Seagrass Meadows 1984-1988Department of Primary Industries and Fisheries 2002Coastal Habitat Resources Information Systemhttpechnsweb.dpield.gov.au/CHRIS/Pers. Comm. Michael Rasheed, 20100False Pera HeadThis m p incorporates data which isIP INSET-/rON,,i-,---' ,,' .,-e'II1`-.%J. 4rxi,-,..,:-et
:_,) < , (5--- ,7"1... ara'r- l.' .5 7- f a /.(// '2''BOYD POINTPERA HEADLEGENDSponges (% coverage) Soft Coral (% coverage) Coral (% coverage)XAProposed dredge areaSurvey locationDrop video location1 10%1 10% 6:1:9aj5 10 30% 10 30% 10 30%rtIgig 30 50% 30 50% M. 30 50%VIM >50% EM% >50% i4 >50%A 20/07/2010 Issued for squad checkRev Date Revision DescriptioniNorieyParsonsKMDRNMZCHK ENG APPDRIO TINTO ALCAN0 WorleyParsons Services Ply LtdWhlle every care Is taken to ensure the accuracy of this data, WorleyParsons makes no representations or warranties about particular purpose and acclaims all responslallty antl all lab* (Incluangwithout limitation (alley In neglIgence)for all expenses, losses, damages (Incluang stared or conseguental damage) antl costs which might be Incurred its accuracy, reliability, completeness or suitabilityfor any as a result of the data bang Inaccurate or Incomplete In any way and for any reason.Pent. assemblages Interpolated from Worley Parsons marine survey data (June 2008) use. Map Info Vertical Mapper software.Aerial photography, bathymetry and other vector data supplied by Matrix Consulting.Refer to K: \RTA \305- 14674 \GI\ Maps\ 14674 -00 EN PAL CC. P(Manne_Syy_PabenthIc).wor for pre.us version of map0 0.5 1kmSCALE 1:25,000 (at A3)Map Grid of Australia Zone 54Geocentric Datum ofAustralia 1994NSOUTH OF THE EMBLEY PROJECTFigure 6-19 Sponge, soft coral and hard coral coverbetween Pera Head and Boyd PointProject No: 301001-01069 Figure: 01069-00-GM-DAL-0018 Rev: ACompile by BRISBANE INFRASTRUCTURE GIS SECTIONK: RTA1301001-010691GM CA1_101069 00 GM EN 0018 A(Manne_Syy_Epibenthic).wor
Rio Tinto AlcanEnvironmental Impact StatementSouth of <strong>Embley</strong> ProjectPlate 6-2Images of Typical Benthic AssemblagesBoyd Point Mixed branching soft corals, hard Boyd Point Reef Spur Seawhips, soft corals,corals, rocks, sand and Sarcophyton (soft coral) entrusting algae and zoanthidsPera Head Turbinaria hard coral, seawhips, rocks Pera Head Turbinaria hard coral and soft coraland entrusting algaePera Head Branching soft corals, polyps out Pera Head Soft corals, rock and coarse sandsubstrate at base of reef slopeSection 6 Marine Page 6-22
Rio Tinto AlcanEnvironmental Impact StatementSouth of <strong>Embley</strong> ProjectShallow reef spur south of Pera Head Montiporaand Turbinaria hard corals. Inner channel alignment Sponges, bryazoansand encrusting algaePort berth areaOpen silty sand with spongePort berth areaOpen silty sandISponge reef adjacent to Port developmentSponge reef adjacent to port developmentSection 6 Marine Page 6-23