Embley
Marine - part 1 (PDF 960 KB) - Rio Tinto Alcan
Marine - part 1 (PDF 960 KB) - Rio Tinto Alcan
- No tags were found...

You also want an ePaper? Increase the reach of your titles
YUMPU automatically turns print PDFs into web optimized ePapers that Google loves.
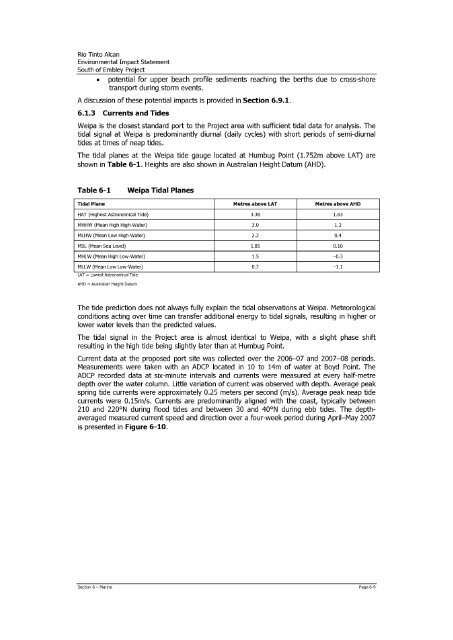
Rio Tinto AlcanEnvironmental Impact StatementSouth of <strong>Embley</strong> Projectpotential for upper beach profile sediments reaching the berths due to cross-shoretransport during storm events.A discussion of these potential impacts is provided in Section 6.9.1.6.1.3 Currents and TidesWeipa is the closest standard port to the Project area with sufficient tidal data for analysis. Thetidal signal at Weipa is predominantly diurnal (daily cycles) with short periods of semi-diurnaltides at times of neap tides.The tidal planes at the Weipa tide gauge located at Humbug Point (1.752m above LAT) areshown in Table 6-1. Heights are also shown in Australian Height Datum (AHD).Table 6-1Weipa Tidal PlanesTidal Plane Metres above LAT Metres above AHDHAT (Highest Astronomical Tide) 3.38 1.63MHHW (Mean High High-Water) 3.0 1.2MLHW (Mean Low High-Water) 2.2 0.4MSL (Mean Sea Level) 1.85 0.10MHLW (Mean High Low-Water) 1.5 0.3MLLW (Mean Low Low-Water) 0.7 1.1LAT = Lowest Astronomical TideAHD = Australian Height DatumThe tide prediction does not always fully explain the tidal observations at Weipa. Meteorologicalconditions acting over time can transfer additional energy to tidal signals, resulting in higher orlower water levels than the predicted values.The tidal signal in the Project area is almost identical to Weipa, with a slight phase shiftresulting in the high tide being slightly later than at Humbug Point.Current data at the proposed port site was collected over the 2006-07 and 2007-08 periods.Measurements were taken with an ADCP located in 10 to 14m of water at Boyd Point. TheADCP recorded data at six-minute intervals and currents were measured at every half-metredepth over the water column. Little variation of current was observed with depth. Average peakspring tide currents were approximately 0.25 meters per second (m/s). Average peak neap tidecurrents were 0.15m/s. Currents are predominantly aligned with the coast, typically between210 and 220°N during flood tides and between 30 and 40°N during ebb tides. The depthaveragedmeasured current speed and direction over a four-week period during AprilMay 2007is presented in Figure 6-10.Section 6 Marine Page 6-9