Detection using the XL Audit Commander
XL Audit Commander - EZ-R Stats, LLC
XL Audit Commander - EZ-R Stats, LLC
- No tags were found...

You also want an ePaper? Increase the reach of your titles
YUMPU automatically turns print PDFs into web optimized ePapers that Google loves.
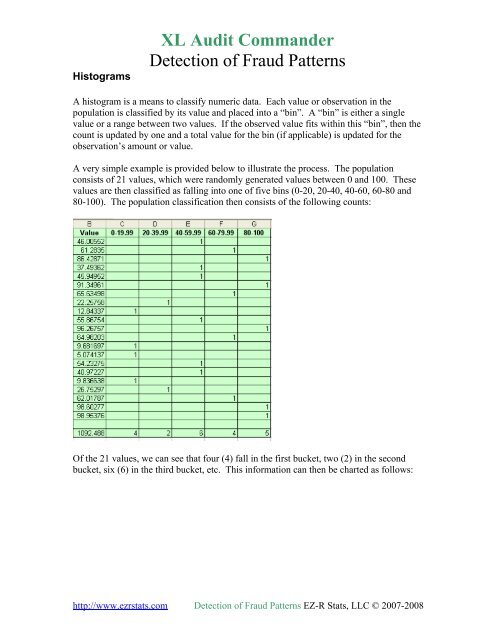
Histograms<strong>XL</strong> <strong>Audit</strong> <strong>Commander</strong><strong>Detection</strong> of Fraud PatternsA histogram is a means to classify numeric data. Each value or observation in <strong>the</strong>population is classified by its value and placed into a “bin”. A “bin” is ei<strong>the</strong>r a singlevalue or a range between two values. If <strong>the</strong> observed value fits within this “bin”, <strong>the</strong>n <strong>the</strong>count is updated by one and a total value for <strong>the</strong> bin (if applicable) is updated for <strong>the</strong>observation’s amount or value.A very simple example is provided below to illustrate <strong>the</strong> process. The populationconsists of 21 values, which were randomly generated values between 0 and 100. Thesevalues are <strong>the</strong>n classified as falling into one of five bins (0-20, 20-40, 40-60, 60-80 and80-100). The population classification <strong>the</strong>n consists of <strong>the</strong> following counts:Of <strong>the</strong> 21 values, we can see that four (4) fall in <strong>the</strong> first bucket, two (2) in <strong>the</strong> secondbucket, six (6) in <strong>the</strong> third bucket, etc. This information can <strong>the</strong>n be charted as follows:http://www.ezrstats.com <strong>Detection</strong> of Fraud Patterns EZ-R Stats, LLC © 2007-2008