Detection using the XL Audit Commander
XL Audit Commander - EZ-R Stats, LLC
XL Audit Commander - EZ-R Stats, LLC
- No tags were found...
Create successful ePaper yourself
Turn your PDF publications into a flip-book with our unique Google optimized e-Paper software.
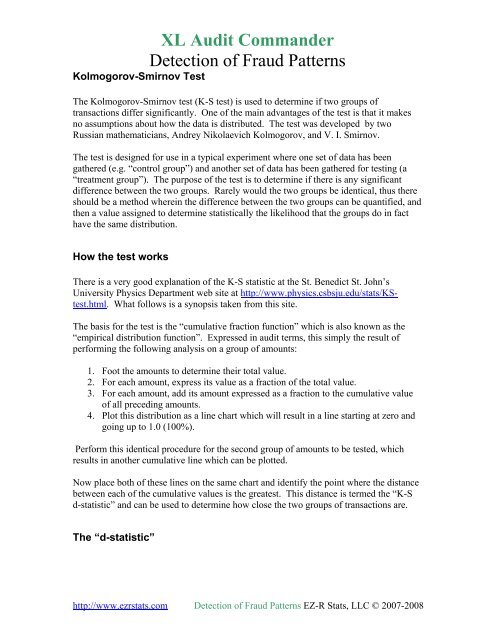
Kolmogorov-Smirnov Test<strong>XL</strong> <strong>Audit</strong> <strong>Commander</strong><strong>Detection</strong> of Fraud PatternsThe Kolmogorov-Smirnov test (K-S test) is used to determine if two groups oftransactions differ significantly. One of <strong>the</strong> main advantages of <strong>the</strong> test is that it makesno assumptions about how <strong>the</strong> data is distributed. The test was developed by twoRussian ma<strong>the</strong>maticians, Andrey Nikolaevich Kolmogorov, and V. I. Smirnov.The test is designed for use in a typical experiment where one set of data has beenga<strong>the</strong>red (e.g. “control group”) and ano<strong>the</strong>r set of data has been ga<strong>the</strong>red for testing (a“treatment group”). The purpose of <strong>the</strong> test is to determine if <strong>the</strong>re is any significantdifference between <strong>the</strong> two groups. Rarely would <strong>the</strong> two groups be identical, thus <strong>the</strong>reshould be a method wherein <strong>the</strong> difference between <strong>the</strong> two groups can be quantified, and<strong>the</strong>n a value assigned to determine statistically <strong>the</strong> likelihood that <strong>the</strong> groups do in facthave <strong>the</strong> same distribution.How <strong>the</strong> test worksThere is a very good explanation of <strong>the</strong> K-S statistic at <strong>the</strong> St. Benedict St. John’sUniversity Physics Department web site at http://www.physics.csbsju.edu/stats/KStest.html.What follows is a synopsis taken from this site.The basis for <strong>the</strong> test is <strong>the</strong> “cumulative fraction function” which is also known as <strong>the</strong>“empirical distribution function”. Expressed in audit terms, this simply <strong>the</strong> result ofperforming <strong>the</strong> following analysis on a group of amounts:1. Foot <strong>the</strong> amounts to determine <strong>the</strong>ir total value.2. For each amount, express its value as a fraction of <strong>the</strong> total value.3. For each amount, add its amount expressed as a fraction to <strong>the</strong> cumulative valueof all preceding amounts.4. Plot this distribution as a line chart which will result in a line starting at zero andgoing up to 1.0 (100%).Perform this identical procedure for <strong>the</strong> second group of amounts to be tested, whichresults in ano<strong>the</strong>r cumulative line which can be plotted.Now place both of <strong>the</strong>se lines on <strong>the</strong> same chart and identify <strong>the</strong> point where <strong>the</strong> distancebetween each of <strong>the</strong> cumulative values is <strong>the</strong> greatest. This distance is termed <strong>the</strong> “K-Sd-statistic” and can be used to determine how close <strong>the</strong> two groups of transactions are.The “d-statistic”http://www.ezrstats.com <strong>Detection</strong> of Fraud Patterns EZ-R Stats, LLC © 2007-2008


