Detection using the XL Audit Commander
XL Audit Commander - EZ-R Stats, LLC
XL Audit Commander - EZ-R Stats, LLC
- No tags were found...

Create successful ePaper yourself
Turn your PDF publications into a flip-book with our unique Google optimized e-Paper software.
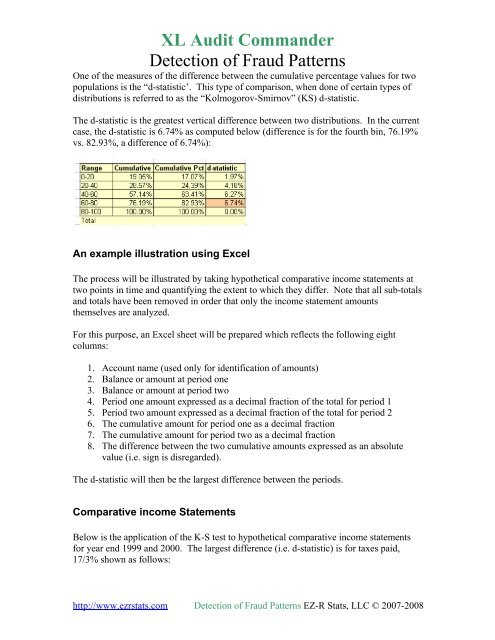
<strong>XL</strong> <strong>Audit</strong> <strong>Commander</strong><strong>Detection</strong> of Fraud PatternsOne of <strong>the</strong> measures of <strong>the</strong> difference between <strong>the</strong> cumulative percentage values for twopopulations is <strong>the</strong> “d-statistic’. This type of comparison, when done of certain types ofdistributions is referred to as <strong>the</strong> “Kolmogorov-Smirnov” (KS) d-statistic.The d-statistic is <strong>the</strong> greatest vertical difference between two distributions. In <strong>the</strong> currentcase, <strong>the</strong> d-statistic is 6.74% as computed below (difference is for <strong>the</strong> fourth bin, 76.19%vs. 82.93%, a difference of 6.74%):An example illustration <strong>using</strong> ExcelThe process will be illustrated by taking hypo<strong>the</strong>tical comparative income statements attwo points in time and quantifying <strong>the</strong> extent to which <strong>the</strong>y differ. Note that all sub-totalsand totals have been removed in order that only <strong>the</strong> income statement amounts<strong>the</strong>mselves are analyzed.For this purpose, an Excel sheet will be prepared which reflects <strong>the</strong> following eightcolumns:1. Account name (used only for identification of amounts)2. Balance or amount at period one3. Balance or amount at period two4. Period one amount expressed as a decimal fraction of <strong>the</strong> total for period 15. Period two amount expressed as a decimal fraction of <strong>the</strong> total for period 26. The cumulative amount for period one as a decimal fraction7. The cumulative amount for period two as a decimal fraction8. The difference between <strong>the</strong> two cumulative amounts expressed as an absolutevalue (i.e. sign is disregarded).The d-statistic will <strong>the</strong>n be <strong>the</strong> largest difference between <strong>the</strong> periods.Comparative income StatementsBelow is <strong>the</strong> application of <strong>the</strong> K-S test to hypo<strong>the</strong>tical comparative income statementsfor year end 1999 and 2000. The largest difference (i.e. d-statistic) is for taxes paid,17/3% shown as follows:http://www.ezrstats.com <strong>Detection</strong> of Fraud Patterns EZ-R Stats, LLC © 2007-2008