WASTE MANAGEMENT SUSTAINABILITY REPORT 2014 66SUSTAINABILITY PERFORMANCEscope of our recycling operations, exploringnew options to produce low-carbonfuels from waste, steadily converting ourfleet from higher to lower carbon fuels,improving energy efficiency, increasingour use of renewable energy and providingconsulting services to customers whowant to reduce their carbon footprints.In all of this work, we marry strategicbusiness planning with life cycle thinking,evaluating how greenhouse gas emissionscan be eliminated or sharply reduced.Three of our sustainability goals for 2020help drive progress toward GHG emissionreductions: doubling our renewableenergy generation, increasing the amountof recyclable materials we manage to20 million tons, and cutting our fleet emissionsby 15 percent (which, as notedearlier, we have already accomplished).These goals build on our tradition ofclimate leadership within our industry.Waste Management was one of thefounding members of the ChicagoClimate Exchange (CCX), and we fulfilledour commitment to the CCX by reducingour GHG emissions 6 percent below our1998–2001 baseline average by 2010.We were also a Climate Action Leader inthe California Climate Action Registry,which was succeeded by the ClimateAction Registry (CAR), where we arenow a GHG offset developer. In 2011,we generated our first verified offsetsunder the CAR protocols. In addition, weare an Emissions Performance Generatorunder the Alberta Environment GHGReduction Program, where we electedto approach compliance for our onesubject landfill facility aggressively;instead of paying an emissions fee orbuying offsets, we installed a landfill gascollection system to reduce GHG emissionsfrom the site. In 2013, we joinedthe Business Council on SustainableEnergy, a business coalition dedicated toimplementing market-based approachesto reducing pollution and GHG emissionsby providing a diverse, secure mix ofenergy resources, including renewableenergy, for consumers and businesses.Our approach continues to evolve aswe focus on implementing sustainablebusiness practices company-wide thatprovide energy, fuel and commoditysavings while reducing GHG emissions.INCREASING WASTE MANAGEMENT’SCLIMATE RESILIENCEWaste Management understands the needfor resilience in the face of a changingclimate, and we have been investing inthe infrastructure needed to enable us toperform our essential services, even in theface of increasingly severe weather events.For instance, when Superstorm Sandymade landfall in New Jersey in 2012, it hitan area where we have a very high concentrationof hauling and disposal sites.Long before it came ashore, however,we were able to anticipate its path, planour operations and gauge its potentialimpact, thanks to an internally developedweb mapping tool called Waste Analysisand Visualization Explorer (WAVE). WhenSandy hit, WAVE displayed the company’soperations located within the projectedpath of the storm and continuallyupdated the storm’s track with real-timeinformation from the National HurricaneCenter. This information allowed us toprepare operational support before itwas needed — instead of reacting oncethe storm passed.
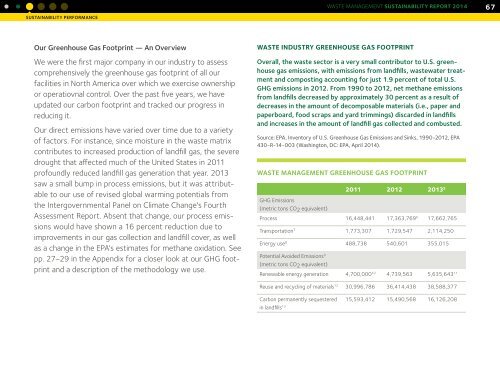
WASTE MANAGEMENT SUSTAINABILITY REPORT 2014 67SUSTAINABILITY PERFORMANCEOur Greenhouse Gas Footprint — An OverviewWe were the first major company in our industry to assesscomprehensively the greenhouse gas footprint of all ourfacilities in North America over which we exercise ownershipor operatiovnal control. Over the past five years, we haveupdated our carbon footprint and tracked our progress inreducing it.Our direct emissions have varied over time due to a varietyof factors. For instance, since moisture in the waste matrixcontributes to increased production of landfill gas, the severedrought that affected much of the United States in 2011profoundly reduced landfill gas generation that year. 2013saw a small bump in process emissions, but it was attributableto our use of revised global warming potentials fromthe Intergovernmental Panel on Climate Change's FourthAssessment Report. Absent that change, our process emissionswould have shown a 16 percent reduction due toimprovements in our gas collection and landfill cover, as wellas a change in the EPA's estimates for methane oxidation. Seepp. 27–29 in the Appendix for a closer look at our GHG footprintand a description of the methodology we use.WASTE INDUSTRY GREENHOUSE GAS FOOTPRINTOverall, the waste sector is a very small contributor to U.S. greenhousegas emissions, with emissions from landfills, wastewater treatmentand composting accounting for just 1.9 percent of total U.S.GHG emissions in 2012. From 1990 to 2012, net methane emissionsfrom landfills decreased by approximately 30 percent as a result ofdecreases in the amount of decomposable materials (i.e., paper andpaperboard, food scraps and yard trimmings) discarded in landfillsand increases in the amount of landfill gas collected and combusted.Source: EPA, Inventory of U.S. Greenhouse Gas Emissions and Sinks, 1990-2012, EPA430-R-14-003 (Washington, DC: EPA, April 2014).WASTE MANAGEMENT GREENHOUSE GAS FOOTPRINT2011 2012 2013 5GHG Emissions(metric tons CO2 equivalent)Process 16,448,441 17,363,769 6 17,662,765Transportation 7 1,773,307 1,729,547 2,114,250Energy use 8 488,738 540,601 355,015Potential Avoided Emissions 9(metric tons CO2 equivalent)Renewable energy generation 4,700,000 10 4,739,563 5,635,643 11Reuse and recycling of materials 12 30,996,786 36,414,438 38,588,377Carbon permanently sequestered 15,593,412 15,490,568 16,126,208in landfills 13