E.ON PowerPoint
E.ON PowerPoint
E.ON PowerPoint

Create successful ePaper yourself
Turn your PDF publications into a flip-book with our unique Google optimized e-Paper software.
Global Unit Renewables<br />
We make clean energy better<br />
An overview of our business activities<br />
Q2/2012
Global Unit Renewables<br />
E.<strong>ON</strong> Climate & Renewables – at a glance<br />
2<br />
Our scope and achievements<br />
� Responsible for E.<strong>ON</strong>’s global activities in<br />
industrial-scale renewable power generation<br />
� Technologies: Onshore & offshore wind,<br />
biomass, photovoltaic (PV), solarthermal<br />
(concentrated solar power, CSP)<br />
� Invested €8bn since formation in 2007<br />
� Operating a portfolio with 4,237 MW capacity<br />
across Europe and North America<br />
� Produced 10.2 TWh electricity in 2011<br />
– enough to power more than 2.6 million homes<br />
� Global #3 in offshore wind, #8 in onshore wind<br />
� “Green Energy Generator of the Year”<br />
in the 2011 Platts Global Energy Awards<br />
� 828 employees of 35 nationalities<br />
� Generated €551m EBITDA in 2011<br />
� Our ambition: To make clean energy better<br />
Note Figures as of 30 June 2012 unless stated otherwise; rounded.<br />
Our plans for the future<br />
Summary<br />
� Invest further billions of euros in new capacity<br />
� Drive industrialization, cost reduction and<br />
higher energy yield to make renewables more<br />
competitive<br />
Onshore wind: Build 600 MW capacity p.a.,<br />
reduce CAPEX by 25% by 2015<br />
Offshore wind: New project in operation every<br />
18 months, reduce CAPEX by 40% by 2015<br />
Biomass: Convert 2–4 fossil E.<strong>ON</strong> plants to<br />
realize scale and portfolio effects<br />
Photovoltaic: Build 120 MW capacity p.a.,<br />
reduce CAPEX by 35% by 2015<br />
Solarthermal: Learn from existing assets<br />
� Add value with “build, sell & operate” approach<br />
� Realize double-digit returns on investments<br />
Summary
Global Unit Renewables<br />
Contents<br />
E.<strong>ON</strong><br />
Achievements<br />
Ambition<br />
Addendum<br />
Technology summaries<br />
Policy frameworks<br />
Country summaries<br />
Organization<br />
3<br />
E.<strong>ON</strong>
Global Unit Renewables<br />
About E.<strong>ON</strong><br />
What we do<br />
At facilities across Europe, Russia, and North<br />
America, our more than 78,000 employees<br />
generated just under €113 billion in sales in 2011.<br />
Our objective is to make energy cleaner & better<br />
wherever we operate.<br />
We are implementing a new strategy to transform<br />
our company into a global provider of specialized<br />
energy solutions.<br />
4<br />
Our focus<br />
We focus on what we do best and where we can add<br />
the most value: Making and marketing energy in<br />
competitive, converging international markets.<br />
E.<strong>ON</strong>‘s core businesses are:<br />
� exploration and production,<br />
� conventional generation,<br />
� new build and technology,<br />
� optimization and trading,<br />
� renewables generation,<br />
� energy distribution and<br />
� innovative energy solutions for customers.<br />
E.<strong>ON</strong>
Global Unit Renewables<br />
E.<strong>ON</strong> Group strategy: To transform a European utility<br />
into a global, specialized energy solutions provider<br />
5<br />
Europe<br />
Focused &<br />
synergistic<br />
positioning<br />
Investment<br />
Less capital,<br />
more value<br />
Performance<br />
Efficiency &<br />
effective<br />
organization<br />
Outside<br />
Europe<br />
Targeted<br />
expansion<br />
Cleaner & better energy<br />
� Cleaner & better energy for our customers –<br />
Less capital, more value for our investors<br />
Key drivers of E.<strong>ON</strong>’s transformation<br />
� Divest non-core assets<br />
� Safeguard financial strength<br />
� Expand outside Europe<br />
� Increase efficiency, improve organization<br />
� Improve capital management<br />
Summary<br />
E.<strong>ON</strong>
Global Unit Renewables<br />
E.<strong>ON</strong> Group strategy: Transformation well under way<br />
6<br />
Key drivers of E.<strong>ON</strong>’s transformation<br />
Divest non-core assets � Total target ~€15bn disposals by end 2013, ~€12.4bn achieved<br />
� Position E.<strong>ON</strong> for the future<br />
� Divested broad range of assets at attractive conditions<br />
Safeguard financial strength � Target debt factor
Global Unit Renewables<br />
E.<strong>ON</strong> Group key financial targets<br />
7<br />
Results<br />
Dividends<br />
Other<br />
� Transparent financial targets for coming years<br />
1 Adjusted for extraordinary effects<br />
2 2013 post €0.9bn effect of achieved disposals (€9.1bn)<br />
3 2015 post ~€1.7bn effect of total disposals (€~15bn)<br />
Summary<br />
� 2012E EBITDA 1 €bn 9.6 – 10.2<br />
Underlying EPS €/share 1.2 – 1.4<br />
� 2013E EBITDA 1 €bn 11.6 – 12.3 2<br />
Underlying EPS €/share 1.7 – 2.0 2<br />
� 2015E EBITDA 1 €bn 12.5 - 13.0 3<br />
Underlying EPS €/share 2.0 – 2.3 3<br />
� Dividend payout policy % adj. net income 50 – 60<br />
� 2011A €/share 1.0<br />
� 2012E €/share 1.1<br />
� 2013E €/share ≥1.1<br />
� Rating target Solid single A<br />
� Medium-term debt factor
Global Unit Renewables<br />
Renewables within E.<strong>ON</strong>’s structure<br />
� E.<strong>ON</strong> Climate & Renewables focuses on industrial-scale renewables<br />
(wind, solar, biomass)<br />
8<br />
Generation Renewables1 Trading & Exploration &<br />
Optimization Production<br />
Industrial-scale<br />
renewables<br />
Hydro 1<br />
Onshore wind<br />
Offshore wind<br />
Biomass<br />
Photovoltaic<br />
Solarthermal<br />
Group Management<br />
Global Units Regional Units<br />
Biomethane 2<br />
1 All technologies managed by E.<strong>ON</strong> Climate and Renewables, except large hydro (managed by Generation Fleet Hydro)<br />
2 Biomethane upstream business managed by Global Unit E&P, downstream business managed by Regional Units<br />
Other EU<br />
Germany Russia<br />
countries<br />
Biogas<br />
Small biomass<br />
Small hydro<br />
Small solar & roof-top PV<br />
Geothermal / heat pumps<br />
Small-scale<br />
renewables<br />
Summary<br />
Support<br />
functions<br />
E.<strong>ON</strong>
Global Unit Renewables<br />
Contents<br />
E.<strong>ON</strong><br />
Achievements<br />
Ambition<br />
Addendum<br />
Technology summaries<br />
Policy frameworks<br />
Country summaries<br />
Organization<br />
9<br />
Achievements
Global Unit Renewables<br />
Renewables have significantly grown and further closed<br />
the gap to conventional technologies in capacity and cost<br />
10<br />
Global installed capacity 2011 (GW) Key facts<br />
Small hydro)<br />
Solar<br />
Biomass<br />
Geothermal<br />
566<br />
Marine<br />
Renewables<br />
Wind<br />
1<br />
11<br />
370<br />
Nuclear<br />
74%<br />
Existing 2010 Added 2011<br />
58<br />
73<br />
1,300<br />
Gas<br />
184<br />
22%<br />
1,700<br />
Coal<br />
239<br />
Top Five Countries<br />
1 China 134<br />
2 United States 93<br />
3 Germany 61<br />
4 Spain 33<br />
5 India 19<br />
Investments<br />
� 17% YoY increase in global investments in 2011<br />
� €205bn global investments – now en par with<br />
fossil generation investments (€210bn)<br />
Drivers<br />
� Climate change: Low-carbon generation<br />
� Security of supply: Fuel independence<br />
� Competitiveness: Renewables cost decreasing<br />
Market developments<br />
� Stable policy commitment for 2020 targets,<br />
but high volatility in national support schemes<br />
� Financial investors more critical regarding<br />
long-term sustainability of growth pipelines and<br />
national support schemes / economic impact<br />
� Renewables continue their remarkable growth and become ever more competitive<br />
Sources REN21 (Aug 2012), IHS Emerging Energy Research (Jul 2012), BNEF (Mar 2012), IAEA (Feb 2012), McIlvaine (May 2012), UNEP (Jun 2012)<br />
Market
Global Unit Renewables<br />
EC&R has participated in this growth since early 2007,<br />
with €8bn investment and a 10-fold capacity increase<br />
11<br />
Investments (€m) Capacity (MW)<br />
2,298<br />
2007 1<br />
EBITDA (€m) Production (TWh)<br />
Formation<br />
of EC&R<br />
2007<br />
1,485<br />
2008<br />
152<br />
2008<br />
1,031<br />
2009<br />
293<br />
2009<br />
1,163<br />
2010<br />
452<br />
2010<br />
1,249<br />
2011<br />
H1/12<br />
1 Includes initial acquisitions of e.g. E2I, Airtricity<br />
Note Figures as of year end or for full year, if not noted otherwise. Investments are economic not cash-effective investments.<br />
386<br />
550<br />
304<br />
2011<br />
720<br />
302<br />
H1/12<br />
400<br />
604<br />
975<br />
978<br />
643<br />
590<br />
Achievements<br />
4,237<br />
47<br />
May 2007 2007 2008 2009 2010 2011 H1/12<br />
Offshore wind<br />
Onshore wind<br />
� We drive performance by building renewables where they create the most value<br />
Other<br />
3.2<br />
2008<br />
5.3<br />
2009<br />
7.9<br />
2010<br />
10.2<br />
2011<br />
6.0<br />
H1/12
Global Unit Renewables<br />
We focus on deploying mature and maturing technologies<br />
in the most attractive renewables markets<br />
12<br />
Technology focus: Industrial-scale renewables Market focus: Most attractive Western markets<br />
Wind Onshore<br />
We expand on our main portfolio driver<br />
Wind Offshore<br />
We build on a leading industry position<br />
Biomass<br />
We focus on converting fossil plants<br />
Photovoltaic (PV)<br />
We optimize large-scale ground farms<br />
Solarthermal (CSP)<br />
We learn from our existing assets<br />
� We drive performance by building renewables where they create the most value<br />
1 Based on Ernst&Young Country Attractiveness Index Renewables (May 2012), IHS Emerging Energy Research<br />
2 Focus region of E.<strong>ON</strong> International Energy (EIE)<br />
3 No EC&R focus market yet but in scope<br />
Achievements<br />
Attractiveness 1 Country Size 2010 Growth 2010 E.<strong>ON</strong><br />
focus<br />
Rank Index GW GW %<br />
1 70 China 39.1 13.3 52 �<br />
2 68 USA 59.1 6.1 11 �<br />
3 65 Germany 50.7 9.2 22 �<br />
4 65 India 15.8 2.6 20 � 2<br />
5 58 Italy 12.1 3.4 39 �<br />
6 59 UK 7.2 1.2 20 �<br />
7 56 France 8.1 2.0 32 �<br />
8 56 Canada 5.2 0.9 20 (�) 3<br />
9 53 Brazil 8.2 3.2 65 � 2<br />
10 50 Japan 10.8 1.0 10 �<br />
11 50 Australia 4.0 0.4 11 �<br />
12 50 Sweden 5.3 0.7 14 �
Portland<br />
San Francisco<br />
Global Unit Renewables<br />
13<br />
Austin<br />
Chicago<br />
Note Figures as of 31 June 2012 unless stated otherwise; rounded<br />
Includes 57 MW PV capacity in operation in France and Italy<br />
Includes 50 MW CSP capacity in operation in Spain<br />
Coventry<br />
Madrid<br />
Düsseldorf<br />
Be<br />
Hamburg<br />
Milan<br />
Malmö<br />
Munich<br />
Szczecin<br />
Achievements<br />
Summary<br />
EC&R currently operates a portfolio of more than 4.2 GW<br />
renewables capacity across Europe and North America<br />
Key facts<br />
2,221<br />
North America<br />
� Assets with 4,237 MW total capacity<br />
� 10.2 TWh electricity produced in 2011,<br />
equivalent to demand of ~2.6m homes<br />
� Global #8 in onshore wind<br />
� Global #3 in offshore wind<br />
� Active in 12 countries<br />
� 828 employees, 35 nationalities<br />
52%<br />
48%<br />
Europe<br />
535<br />
449<br />
94<br />
279<br />
198<br />
374<br />
87<br />
Lublin<br />
Be<br />
Headquarter<br />
Office location<br />
Capacity (MW)<br />
Onshore wind<br />
Offshore wind<br />
Other
Global Unit Renewables<br />
Within only four years, EC&R has built a leading position<br />
in the global onshore and offshore wind segment<br />
14<br />
Top 20 global wind plant owners 2010 (GW) Unique expertise<br />
Iberdrola ES<br />
NextEra Energy Resources US<br />
EDP Renováveis PT<br />
Longyuan CN<br />
Acciona ES<br />
Datang CN<br />
Huaneng CN<br />
EC&R DE<br />
Enel IT<br />
EDF EN FR<br />
Huadian CN<br />
MidAmerican Energy US<br />
GDF SUEZ FR<br />
Infigen Energy AU<br />
Invenergy US<br />
RWE Innogy DE<br />
Guohua CN<br />
CGNWP CN<br />
AES Wind US<br />
International Power UK<br />
Wind onshore<br />
� 3,591 MW installed capacity (global #8)<br />
� Focus: US, UK, Poland, Nordic, Spain, Italy<br />
� Operating Roscoe (US, 782 MW), until recently<br />
the world’s largest onshore wind farm 1<br />
� Competence Center Wind: Aligned network of<br />
key resources and globally harmonized analytics<br />
Wind offshore<br />
� 467 MW installed capacity (global #3)<br />
� Focus regions: North Sea, Baltic Sea<br />
� Building the world’s largest offshore wind farm,<br />
London Array (UK, up to 1,000 MW) 2<br />
� Only player with experience in all available types<br />
of foundations and in a wide variety of local<br />
conditions<br />
� While others have built more capacity, we are ahead in terms of offshore experience<br />
1 As of 2012, only Alta Wind Energy Center (US, 1,020 MW) is larger<br />
2 JV of EC&R (30%), D<strong>ON</strong>G Energy (50%) and Masdar (20%)<br />
Note EC&R MW figures as of 30 June 2012; rounded<br />
Sources IHS Emerging Energy Research (August 2011), E.<strong>ON</strong><br />
4 8 12<br />
Europe<br />
North America<br />
Asia Pacific<br />
Rest of World<br />
Achievements
Global Unit Renewables<br />
We have a track record in achieving and continuously<br />
improving our performance in construction and operation<br />
15<br />
Development & construction capabilities Operational performance<br />
Example highlights<br />
Volume construction in the US<br />
Since 2007, more than 2.2 GW of onshore wind<br />
capacity installed and brought into operation<br />
Cutting edge technology in Nordic<br />
Installed one of the highest industrial turbines in<br />
Sweden at 170m<br />
Project management expertise in offshore wind<br />
Completed Rødsand II (207 MW) in 2010<br />
3 months ahead of time and under budget<br />
Strong stakeholder relationships in the UK<br />
Received exclusive contract to potentially develop<br />
more than 800 MW onshore wind in the Forestry<br />
Commission Green Park area<br />
Availability<br />
� Improved to 97.1% since 2007, targeting 98%<br />
Load factor<br />
� Improved from 28% in 2010 to 31% in 2011<br />
� Targeting up to 40% mid-term<br />
� We target to become a top quartile player in construction and operation<br />
99<br />
96<br />
93<br />
90<br />
91.0<br />
2007<br />
94.0<br />
2008<br />
95.3<br />
2009<br />
96.7<br />
2010<br />
97.1<br />
2011<br />
Achievements<br />
98.0
Global Unit Renewables<br />
Contents<br />
E.<strong>ON</strong><br />
Achievements<br />
Ambition<br />
Addendum<br />
Technology summaries<br />
Policy frameworks<br />
Country summaries<br />
Organization<br />
16<br />
Ambition
Global Unit Renewables<br />
Renewables have significant worldwide potential:<br />
Capacity is expected to again grow 3-fold by 2020<br />
Global generation capacity Global renewables capacity<br />
Oil 8%<br />
Coal<br />
Gas<br />
Nuclear<br />
32%<br />
Renewables 7%<br />
2010 2020 2010 x3 2020<br />
4,900 GW<br />
8%<br />
Hydro 18%<br />
26%<br />
6,800 GW<br />
14%<br />
29%<br />
7%<br />
19%<br />
5%<br />
25%<br />
17 Sources BNEF, IHS Emerging Energy Research (July 2011 Base Case), World Energy Council<br />
Wind 63%<br />
Biomass 20%<br />
Solar 13%<br />
Others
Global Unit Renewables<br />
E.<strong>ON</strong> will continue to significantly invest in core markets,<br />
potentially tripling its owned renewables capacity by 2020<br />
18<br />
Net capacity development by technology (GW) Growth ambitions<br />
CSP<br />
PV<br />
Biomass<br />
Wind offshore<br />
Wind onshore<br />
3.6<br />
2010<br />
Wind onshore 600 MW new build p.a.<br />
50% in North America<br />
50% in Europe (esp. Northern),<br />
depending on market outlook*<br />
Wind offshore A new COD every 18 months<br />
North Sea, Baltic Sea<br />
Biomass 2–4 fossil plant conversions<br />
PV 120 MW new build p.a.<br />
US, Italy, France*<br />
Less capital, Additional value creation through<br />
more value sale of developed projects<br />
(develop & sell) and sale of<br />
shares in operational projects<br />
(build, sell & operate)<br />
� We plan further multi-billion euro investments to expand our installed capacity<br />
* Potential further options in E.<strong>ON</strong> International Energy (EIE) focus markets Brazil, India, Turkey<br />
x3<br />
2015E<br />
2020E<br />
Ambition
Global Unit Renewables<br />
By focusing on the best projects and our competencies,<br />
we target double-digit returns on our investments<br />
19<br />
Project pipeline (MW)<br />
2,265<br />
Construction<br />
EBITDA (€m)<br />
152<br />
2008<br />
134<br />
85%<br />
293<br />
2009<br />
8,977<br />
50%<br />
452<br />
2010<br />
Invest responsibly & leverage competencies<br />
Portfolio-driven investment policy<br />
� Diverse and balanced portfolio across markets,<br />
technologies and public support frameworks<br />
� Demanding hurdle rates<br />
Creating value as RES solutions provider<br />
� Experts in development and construction<br />
� Wind fleet approach and O&M strategy<br />
� Unique offshore experience<br />
� Leverage wider E.<strong>ON</strong> expertise (e.g. biomass)<br />
“Build, sell & operate” approach<br />
� Sell ownership of some assets when operational<br />
� Offer continued, world-class O&M services<br />
� Create additional value with less capital<br />
exposure<br />
� “Build, Sell & Operate” creates additional value while limiting our capital exposure<br />
Note Project pipeline MW as of 30 June 2012; rounded<br />
6,658<br />
25%<br />
Origination<br />
551<br />
2011<br />
9,126<br />
27,160<br />
North<br />
America<br />
40%<br />
Europe<br />
60%<br />
Total<br />
2015E<br />
Ambition
Global Unit Renewables<br />
Our approach in large-scale renewables is derived from<br />
E.<strong>ON</strong>’s Group strategy “Cleaner & better energy”<br />
Europe<br />
Focused & synergistic positioning<br />
� Build on pioneering advantage in offshore wind<br />
� Further grow onshore wind in attractive markets<br />
� Realize biomass conversions of fossil plants<br />
in close cooperation with other E.<strong>ON</strong> units<br />
� Develop solar, e.g. collocation with E.<strong>ON</strong> plants<br />
� Support Regional Units on renewables issues<br />
Investment<br />
Less capital, more value<br />
� Portfolio- and capability-based investment<br />
approach<br />
� “Develop/Build, sell & operate” approach<br />
� Active pipeline management<br />
� Sell selected assets when operational<br />
� Partnerships with other leading players<br />
� Our ambition: To make clean energy better<br />
20<br />
Outside Europe<br />
Targeted expansion<br />
� Further develop existing onshore wind<br />
position in US<br />
� Develop US also as a focus market for solar<br />
� Support E.<strong>ON</strong> International Energy with<br />
renewables expertise: Further opportunities<br />
in Brazil, India and Turkey<br />
Performance<br />
Efficiency & effective organization<br />
� Ambition to make renewables competitive<br />
� Aim for top quartile assets and performance<br />
� Defined performance targets for all<br />
renewable technologies<br />
� Maintain a lean and efficient organization &<br />
internationally-minded performance culture<br />
Ambition
Global Unit Renewables<br />
To ensure sustainable growth, renewables have to get<br />
more competitive and less reliant on support systems<br />
21<br />
The sector needs new investors<br />
Renewables require significant investments<br />
Investments 2010 Required 2010–20<br />
EU €35bn €500bn<br />
Global €90bn €1,500bn<br />
Compared to other sectors, this is feasible<br />
EU gas imports from Russia (2010) €31bn<br />
OECD oil imports (2010) €630bn<br />
US national defense budget (2010) €480bn<br />
Utilities alone cannot finance the investments<br />
Total 2010 investments by Top-10 utilities 1 €60bn<br />
Average debt ratio of Top-10 utilities 1 4.0<br />
Dependence on political support<br />
� Renewables still require financial support<br />
� Support frameworks are very diverse and volatile<br />
� Concerns about government debt lead to<br />
political action, also affecting renewables:<br />
� Retroactive renewables tariff cuts in Spain<br />
� “Robin Hood” tax on all generation in Italy<br />
� Support volumes are comparatively small,<br />
but often more visible to the public:<br />
EU total customers’ electricity cost (2020) €550bn<br />
of this: Renewables net support cost < €50bn<br />
EU agriculture subsidies (2010) €50bn<br />
EU rail subsidies (2010) €75bn<br />
EU road subsidies (2010) €125bn<br />
� Renewables must get more competitive to limit policy risk and attract investors<br />
1 Top-10 US/EU RES owners: Iberdrola, NextEra, EDP, Acciona, Enel, E.<strong>ON</strong>, GDF Suez, RWE, EDF, Vattenfall<br />
2010 investments are total plant investments made by utilities, not only in renewables<br />
Sources EU Commission, IHS Emerging Energy Research, IEA, McKinsey, NREAPs, E.<strong>ON</strong><br />
Ambition
Global Unit Renewables<br />
For a clean energy future, we need competitive RES<br />
technologies, efficiently embedded in our power systems<br />
22<br />
Reduce generation costs & increase yield<br />
Industrialize the whole value chain<br />
Optimize support mechanisms<br />
Drive competitive and efficient deployment<br />
Make clean energy better<br />
Reduce technology prices<br />
Facilitate competition and innovation<br />
Reduce system costs<br />
Drive efficient system integration<br />
Ambition
Global Unit Renewables<br />
By increasing our performance we contribute to the<br />
sustainability of renewables and add shareholder value<br />
23<br />
Optimizing our portfolio<br />
Energy yield<br />
Label<br />
Existing E.<strong>ON</strong> projects<br />
Future E.<strong>ON</strong> projects<br />
Other projects<br />
E.<strong>ON</strong><br />
benchmark<br />
Economies of scale<br />
E.<strong>ON</strong><br />
strategy<br />
� We aim for top quartile assets and performance<br />
Exploiting sites with best resources<br />
Increasing energy yield<br />
� Best turbine for specific location (micro-siting)<br />
� Higher availability<br />
� Improved average performance<br />
Realizing projects with economies of scale:<br />
Reducing CAPEX<br />
� Central procurement<br />
� Standardization of technical components<br />
� Close cooperation with suppliers<br />
Reducing OPEX<br />
� Technical excellence, building on experience<br />
with more than 3,200 wind turbines<br />
� O&M strategy incl. continuous monitoring,<br />
spare parts logistics, predictive maintenance<br />
Ambition
Global Unit Renewables<br />
We commit to significant and specific cost reduction<br />
targets across our renewables technologies<br />
24<br />
Cost structure: Example onshore wind E.<strong>ON</strong> ambitions & levers<br />
CAPEX<br />
OPEX<br />
LCOE (€/MWh)<br />
71%<br />
Turbine<br />
19% Balance of Plant<br />
3% Contingeny<br />
7% Other<br />
Reducing turbine costs is key to improve<br />
the competitiveness of onshore wind<br />
� We pursue ambitious CAPEX reduction targets<br />
and will identify further OPEX savings potential<br />
Reduce onshore wind CAPEX by 25% by 2015<br />
� Use tier 2 suppliers, bring Asian OEMs to the US<br />
� Fit-for-purpose design, new tower materials<br />
� Non-EPC approach with volume bundling<br />
Reduce offshore wind CAPEX by 40% by 2015<br />
� Major potential in hardware costs<br />
� Standardized, integrated design approach<br />
Reduce PV CAPEX by 35% by 2015<br />
� Competitive modules remain major driver<br />
� Expected BOS cost reduction similar to modules<br />
� Identify further potential in operational costs<br />
Investigate OPEX levers for all technologies<br />
Ambition
Global Unit Renewables<br />
We engage the whole industry to drive performance – by<br />
collaborating and facilitating competition at the same time<br />
� Fostering competition and innovation is key to make renewables competitive<br />
25<br />
Offshore<br />
Solar<br />
Onshore<br />
Area of engagement Partner<br />
� London Array project partnership<br />
� Fostering competition through wind<br />
turbine procurement: Amrumbank<br />
vs. Humber Gateway and Kårehamn<br />
� Wind development<br />
� O&M SCADA IEC interface<br />
� O&M optimization<br />
� Helioenergy CSP project partnership<br />
Ambition
Global Unit Renewables<br />
To ensure sustainable growth, renewables have to get<br />
more competitive and less reliant on support systems<br />
26<br />
EU net cost of renewables support 1<br />
40<br />
35<br />
30<br />
25<br />
20<br />
15<br />
10<br />
5<br />
0<br />
€bn<br />
23<br />
2011<br />
Wind offshore<br />
Wind onshore<br />
24<br />
2012<br />
24<br />
2013<br />
26<br />
2014<br />
Biomass<br />
PV<br />
27<br />
2015<br />
2016<br />
2017<br />
2018<br />
2019<br />
2020<br />
More than €300bn total cost through 2020<br />
82% to be covered by Germany, Italy, Spain, UK<br />
Isolated national efforts lead to higher costs<br />
� National 2020 renewables targets of EU states<br />
are based on economic not renewables potential<br />
� Isolated national efforts lead to inefficient<br />
renewables deployment and higher total costs<br />
� Under the current schemes, annual EU<br />
renewables support cost will reach 35 to 50 €bn<br />
by 2020 1<br />
� Despite these financial burdens, most EU states<br />
will still miss their 2020 renewables targets 1<br />
� International cooperation and more efficient<br />
deployment could be facilitated by EU-wide<br />
trading of Green Certificates<br />
� An EU-wide Green Certificate trading could more<br />
than halve the extra costs of renewables 2<br />
Ambition<br />
� Harmonized and cost-oriented frameworks support efficient technology deployment<br />
1 IHS Emerging Energy Research: “Europe’s renewable targets challenged by policy costs” (2012)<br />
2 Eurelectric & Pöyry: “Reaching the EU RES targets in an efficient manner: Benefits of trade” (2008)<br />
29<br />
30<br />
32<br />
34<br />
35
Global Unit Renewables<br />
We need reliable frameworks for renewables growth<br />
and an efficient integration into the energy system<br />
27<br />
Streamlined permitting processes<br />
� Reliable and consistent planning and licensing<br />
regimes facilitate investments and contribute to<br />
project (and in turn generation) cost reductions<br />
� Ideally a ‘one-stop shop’: A single, sufficiently<br />
staffed authority is sole contact for developers<br />
� A reliable process needs to be in place with clear<br />
timeframes for Environmental Impact<br />
Assessment, stakeholder assessment, and final<br />
permission<br />
� Example: Realizing a wind farm of 800 MW in<br />
the US took about 2 years, while it takes 5 years<br />
to realize a 20 MW project in Europe<br />
Suitable grid infrastructure<br />
� Renewables growth needs to be accompanied<br />
by grid extensions to avoid delays and regional<br />
grid bottlenecks<br />
� Extension of interconnections and intraday<br />
trading supports balancing and integration of<br />
renewables<br />
� Grid investments require an accelerated<br />
permitting process and suitable regulation<br />
� Example: US CREZ grid extension took 10<br />
months to decide and 3 years to realize, while<br />
permitting of German transmission lines takes<br />
up to 10 years<br />
� Suitable grid infrastructure and fast permitting are key to further RES growth<br />
Ambition
Global Unit Renewables<br />
Industry and governments need to do their part to make<br />
renewables competitive and less dependent on support<br />
28<br />
Industry<br />
Optimize renewables performance<br />
� Ensure optimal use of capital<br />
by selecting the best sites<br />
� Industrialize the whole value chain:<br />
Reduce capital and operational costs<br />
� Collaborate to leverage competencies<br />
and to drive performance<br />
� Facilitate supplier competition<br />
Reduce Levelized Cost of Energy<br />
(LCOE)<br />
Governments<br />
Drive efficient system integration<br />
� Design reliable, cost-oriented support<br />
mechanisms to drive competition<br />
Ambition<br />
� Harmonize support mechanisms to ensure<br />
the most effective deployment<br />
� Ensure reliable and consistent planning<br />
and licensing regimes<br />
� Drive grid extensions and wider technical<br />
integration measures<br />
+<br />
Make benefits of renewables visible and tangible to ensure broad public acceptance
Global Unit Renewables<br />
E.<strong>ON</strong> Climate & Renewables – at a glance<br />
29<br />
Our scope and achievements<br />
� Responsible for E.<strong>ON</strong>’s global activities in<br />
industrial-scale renewable power generation<br />
� Technologies: Onshore & offshore wind,<br />
biomass, photovoltaic (PV), solarthermal<br />
(concentrated solar power, CSP)<br />
� Invested €8bn since formation in 2007<br />
� Operating a portfolio with 4,237 MW capacity<br />
across Europe and North America<br />
� Produced 10.2 TWh electricity in 2011<br />
– enough to power more than 2.6 million homes<br />
� Global #3 in offshore wind, #8 in onshore wind<br />
� “Green Energy Generator of the Year”<br />
in the 2011 Platts Global Energy Awards<br />
� 828 employees of 35 nationalities<br />
� Generated €551m EBITDA in 2011<br />
� Our ambition: To make clean energy better<br />
Note Figures as of 30 June 2012 unless stated otherwise; rounded.<br />
Our plans for the future<br />
Summary<br />
� Invest further billions of euros in new capacity<br />
� Drive industrialization, cost reduction and<br />
higher energy yield to make renewables more<br />
competitive<br />
Onshore wind: Build 600 MW capacity p.a.,<br />
reduce CAPEX by 25% by 2015<br />
Offshore wind: New project in operation every<br />
18 months, reduce CAPEX by 40% by 2015<br />
Biomass: Convert 2–4 fossil E.<strong>ON</strong> plants to<br />
realize scale and portfolio effects<br />
Photovoltaic: Build 120 MW capacity p.a.,<br />
reduce CAPEX by 35% by 2015<br />
Solarthermal: Learn from existing assets<br />
� Add value with “build, sell & operate” approach<br />
� Realize double-digit returns on investments<br />
Summary
Global Unit Renewables<br />
Contents<br />
E.<strong>ON</strong><br />
Achievements<br />
Ambition<br />
Addendum<br />
Technology summaries<br />
Policy frameworks<br />
Country summaries<br />
Organization<br />
30<br />
Technologies
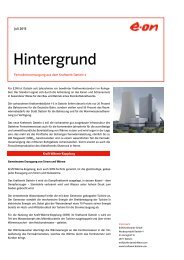
Roscoe, Texas, the world‘s 2<br />
Global Unit Renewables<br />
nd largest onshore wind park (782 MW) – half the size of New York City<br />
Offshore wind park Robin Rigg, UK (180 MW)<br />
PV ground-farm Brigadel, France (8 MW)<br />
CSP plant Helioenergy, Spain (2x50 MW)<br />
Biomass plant Steven‘s Croft, UK (43 MW)
Global Unit Renewables<br />
Onshore wind<br />
Build 600 MW new capacity per year and reduce CAPEX by 25% by 2015<br />
Project highlights Key facts<br />
Industrialization and standardization<br />
E.<strong>ON</strong> project portfolio<br />
32<br />
* Focus markets of E.<strong>ON</strong> International Energy (EIE)<br />
Note Project portfolio MW as of 30 June 2012, rounded<br />
2007 2008 2009 2010 2011<br />
YE New Build<br />
� Wind farm size (MW) 13 93 81 43 41<br />
� Wind turbine size (MW) 1.5 1.3 1.6 2.2 1.8<br />
# Wind turbine types 43 7 7 7 6<br />
Roscoe, Texas, the world‘s largest onshore wind park (782 MW)<br />
� 3,591 MW installed capacity (global #8)<br />
� 8.2 TWh electricity produced in 2011,<br />
equivalent to demand of ~2.1m homes<br />
E.<strong>ON</strong> ambition<br />
� 600 MW new build p.a.<br />
(50% in North America, 50% in Europe)<br />
Summary<br />
� EU focus regions: UK, Poland, Nordic, Spain,<br />
Italy, depending on market attractiveness<br />
� Potential further growth in Brazil, India, Turkey*<br />
� Target to reduce CAPEX by 25% by 2015:<br />
� Standardized components and processes<br />
� Collaborative approach in procurement<br />
� Highly efficient Operations & Maintenance<br />
� Onshore wind will remain at the core of E.<strong>ON</strong>’s renewable portfolio<br />
Technologies
Global Unit Renewables<br />
Offshore wind<br />
Realize a new project every 18 months and reduce CAPEX by 40% by 2015<br />
33<br />
EC&R’s offshore wind pipeline Key facts<br />
40<br />
35<br />
30<br />
25<br />
20<br />
15<br />
10<br />
5<br />
0<br />
Water<br />
depth [m]<br />
0<br />
London Array I 1<br />
Kårehamn<br />
Blyth Utgrunden II<br />
Rødsand II<br />
10<br />
= 200 MW<br />
Scroby Sands<br />
Robin Rigg<br />
Rampion<br />
Humber Gateway<br />
20<br />
30<br />
In operation<br />
The experience across a wide range of projects<br />
makes E.<strong>ON</strong> one of the world’s leading companies<br />
in the global offshore wind energy business<br />
1 JV of EC&R (30%), D<strong>ON</strong>G Energy (50%) and Masdar (20%)<br />
2 JV of EC&R (26.25%), EWE (47.5%) and Vattenfall (26.25%)<br />
Note Project portfolio MW as of 30 June 2012, rounded<br />
alpha ventus 2<br />
Arkona<br />
Amrumbank West<br />
40<br />
50<br />
Under construction<br />
Delta Nordsee<br />
60<br />
Södra<br />
Midjösbanken<br />
Distance to<br />
shore [km]<br />
E.<strong>ON</strong> project portfolio<br />
� 467 MW installed capacity (global #3)<br />
Summary<br />
� 1.6 TWh electricity produced in 2011,<br />
equivalent to demand of ~415,000 homes<br />
� London Array (UK) – at up to 1,000 MW the<br />
world’s largest offshore wind park – currently<br />
under construction<br />
� Kårehamn (SE), Humber (UK) and Amrumbank<br />
(DE) to be constructed next – 560 MW in total<br />
E.<strong>ON</strong> ambition<br />
� Bring a new project in operation every 18 months<br />
� Focus regions: North Sea, Baltic Sea<br />
� Target to reduce CAPEX by 40% by 2015:<br />
� Major saving potential in hardware costs<br />
� Standardized, integrated design approach<br />
� E.<strong>ON</strong> is a global leader in offshore wind, determined to keep pace<br />
70<br />
Under development<br />
80<br />
Technologies
Global Unit Renewables<br />
Biomass<br />
Focus on converting several fossil E.<strong>ON</strong> plants to realize scale and portfolio effects<br />
34<br />
Project highlight Key facts<br />
Biomass plant Steven‘s Croft in Scotland (43 MW, COD 2008)<br />
Note Project portfolio MW as of 30 June 2012, rounded<br />
E.<strong>ON</strong> project portfolio<br />
Summary<br />
� 43 MW installed capacity at Steven‘s Croft,<br />
Scotland‘s largest wood-burning plant<br />
� 241 GWh electricity produced in 2011,<br />
equivalent to demand of ~60,000 homes<br />
� Converting Ironbridge coal plant (760 MW, UK)<br />
� Building Blackburn Meadows (30 MW, UK)<br />
E.<strong>ON</strong> ambition<br />
� Convert 2–4 existing fossil E.<strong>ON</strong> plants to<br />
exclusively use biomass as fuel<br />
� Exercise new-build options for monetizing<br />
� Focus regions: UK, France, Italy, Belgium<br />
� Support biomass co-firing in fossil E.<strong>ON</strong> plants<br />
� Ensure sustainable international fuel sourcing<br />
� Sustainable international fuel sourcing is key to large-scale biomass<br />
Technologies
Global Unit Renewables<br />
Photovoltaic<br />
Build 120 MW new capacity per year and reduce CAPEX by 35% by 2015<br />
35<br />
Project highlight Key facts<br />
PV ground-farm Brigadel in Southern France (8 MW, COD 2011)<br />
* Focus markets of E.<strong>ON</strong> International Energy (EIE)<br />
Note Project portfolio MW as of 30 June 2012, rounded<br />
E.<strong>ON</strong> project portfolio<br />
Summary<br />
� 57 MW capacity installed in France and Italy<br />
� Largest PV farms (18 MW and 10.2 MW)<br />
located at the E.<strong>ON</strong> power plant site<br />
Fiumesanto (Sardinia)<br />
� 23 GWh electricity produced in 2011,<br />
equivalent to demand of ~6,000 homes<br />
E.<strong>ON</strong> ambition<br />
� 120 MW new build p.a.<br />
� Focus regions: US, Italy, France<br />
� Potential further growth in India and Turkey*<br />
� Target to reduce CAPEX by 35% by 2015<br />
� Focus on ground-farms to drive further<br />
industrialization<br />
� Panel and system costs remain key lever<br />
� We aim to manage solar with the industrial approach we have in wind<br />
Technologies
Global Unit Renewables<br />
Solarthermal: Concentrated Solar Power (CSP)<br />
Learn from our existing assets and monitor technology development<br />
36<br />
Project highlight Key facts<br />
Note Project portfolio MW as of 30 June 2012, rounded<br />
Front-end: Parabolic trough<br />
Back-end: Steam turbine<br />
CSP plant Helioenergy in Spain (2x50 MW, COD 2011/12)<br />
E.<strong>ON</strong> project portfolio<br />
Summary<br />
� Project “Helioenergy I” (50 MW) in Southern<br />
Spain operational since August 2011 and<br />
“Helioenergy II” (50 MW) since January 2012.<br />
� Joint investment with partner Abengoa Solar<br />
E.<strong>ON</strong> ambition<br />
� No immediate growth plans<br />
� Learn from our existing “Helioenergy” assets<br />
� Monitor technology and cost development:<br />
� Winning technology not yet identified<br />
(parabolic trough vs. tower)<br />
� Storage solutions key to technology success<br />
Technologies<br />
� Still significant cost decrease needed to make<br />
CSP competitive<br />
� With integrated storage, CSP can provide dispatchable solar power
Global Unit Renewables<br />
E.<strong>ON</strong> Innovation Center Renewables<br />
Deliver value through T&I* projects that optimize existing assets and enable growth<br />
37<br />
Project highlights Key facts<br />
Blade run/repair guide “Pelamis wave” energy demo<br />
HCPV (high-concentration photovoltaic) demo<br />
E.<strong>ON</strong> Innovation Center project portfolio<br />
Summary<br />
� T&I projects in the 5 key renewable technologies:<br />
Wind / Solar PV / CSP / Biomass / Marine<br />
� Project examples: Wind turbine blade run/repair<br />
guide (delivered), HCPV test site (delivered),<br />
“Pelamis” wave energy demo (in progress)<br />
� Multiple external collaborations including<br />
research institutes, universities, OEMs, and<br />
engineering firms<br />
E.<strong>ON</strong> Innovation Center ambition<br />
� All our Technology & Innovation activity is business-driven<br />
* Technology & Innovation<br />
Images DFFV, E.<strong>ON</strong> New Build & Technology<br />
Technologies<br />
� Deliver tangible value to existing assets short-<br />
to mid-term; target €25m to €50m p.a. by 2015<br />
� Develop, demonstrate and deploy new technical<br />
solutions to support existing business strategy<br />
� Identify and explore new technology areas and<br />
innovation to help shape future business strategy
Global Unit Renewables<br />
Contents<br />
E.<strong>ON</strong><br />
Achievements<br />
Ambition<br />
Addendum<br />
Technology summaries<br />
Policy frameworks<br />
Country summaries<br />
Organization<br />
38<br />
Policy
Global Unit Renewables<br />
The “EU Green Package” set 2020 energy targets,<br />
leading to National Renewable Action Plans (NREAPs)<br />
39<br />
EU Green Package 2010–2020: The „20/20/20“ targets<br />
CO 2-Emissions<br />
20–30% reduction<br />
Renewable Energies<br />
20% share in energy demand<br />
� EU has set overall national targets, Member States decide how to reach them (technologies, policies)<br />
� Next to Electricity, Heat and Transport sectors are also part of the renewables targets<br />
Energy efficiency<br />
20% energy savings<br />
Targets for National Renewable Action Plans (NREAPs) National approaches<br />
RES-Electricity<br />
33.9% (1,200 TWh)<br />
RES-Heat<br />
21.3% (1,250 TWh)<br />
RES-Transport<br />
10.2% (350 TWh)<br />
If efficiency targets are missed,<br />
burden on RES increases<br />
� Energy Efficiency and the three sectoral Renewables targets are all interdependent –<br />
with the burden for RES-E increasing if any of the other targets are missed (which is likely)<br />
� Meeting the RES-E target not only requires growing but also effectively integrating esp. wind and solar<br />
Policy
Global Unit Renewables<br />
EU renewables capacity is to double again by 2020<br />
40<br />
Renewables capacity in EU-27: 2010 actual vs. 2020 planned (GW)<br />
180<br />
160<br />
140<br />
120<br />
100<br />
80<br />
60<br />
40<br />
20<br />
0<br />
118<br />
136<br />
1<br />
EU TOTAL 2010: 250 GW<br />
EU TOTAL 2020: 482 GW<br />
∆ EU 2010-2020: 232 GW<br />
2<br />
26<br />
91<br />
0<br />
2<br />
82<br />
167<br />
Hydro Geothermal Solar Tide, Wave, Onshore<br />
Ocean Wind<br />
� Onshore wind +85GW (110%) · Offshore wind +40GW (1,300%) · Solar +65GW (250%)<br />
Source National Renewable Energy Action Plans (NREAP)<br />
3<br />
43<br />
Offshore<br />
Wind<br />
23<br />
2010<br />
2020<br />
43<br />
Biomass<br />
78<br />
230<br />
135<br />
425<br />
250<br />
482<br />
US Asia Europe<br />
Policy
Global Unit Renewables<br />
Governments use a range of support schemes to drive<br />
the development of renewable generation<br />
41<br />
€ / kWh<br />
Direct Marketing<br />
Wholesale price<br />
No support in addition to<br />
normal market price.<br />
Feed-in Tariff<br />
Constant / Adjusted<br />
Feed-in Tariff<br />
(FIT)<br />
Production is not traded<br />
in the market, generator<br />
receives revenue from<br />
authority. Either constant<br />
over support duration or<br />
annually adjusted, e.g.<br />
by consumer price index.<br />
Premium Model<br />
Constant / Variable<br />
Premium<br />
Wholesale price<br />
Generator receives<br />
premium in addition to<br />
market price. Premium<br />
is either constant over<br />
support duration or<br />
annually adjusted<br />
depending on market<br />
price development.<br />
* Accelerated depreciation options for renewables assets exist in many countries, in addition to the specific support schemes<br />
Green Certificate<br />
Trading<br />
Variable Revenue<br />
Green Certificate<br />
(GC)<br />
Wholesale price<br />
Generator sells into the<br />
market and receives GCs<br />
per MWh produced (may<br />
be technology-specific).<br />
Suppliers have to fulfill<br />
increasing RES quotas,<br />
creating a national GC<br />
market. Value of GCs<br />
depends on RES quota<br />
fulfillment.<br />
US schemes<br />
Accelerated<br />
Depreciation (MACRS)*<br />
Renewable Energy<br />
Certificates (RECs)<br />
Production<br />
Tax Credits (PTCs)<br />
Wholesale price<br />
No unified support across<br />
the US. Federal support<br />
includes cash grants, tax<br />
credits, and accelerated<br />
depreciation options. In<br />
addition, state certificate<br />
systems (RECs).<br />
Policy
Global Unit Renewables<br />
US Renewables policy is a combination of different<br />
federal frameworks and individual state policies<br />
Onshore Wind revenue stream<br />
42<br />
Trade / PPA<br />
Electricity sold in the market<br />
or via<br />
Power Purchase Agreement (PPA)<br />
PV and CSP revenue stream<br />
PPA<br />
Electricity sold via<br />
Power Purchase Agreement (PPA)<br />
Important to note<br />
Production Tax Credit<br />
$22/MWh<br />
Renewable Energy<br />
+ or + Certificate (REC) +<br />
Cash grant<br />
30% refund of investment<br />
REC sometimes linked to PPA<br />
Cash grant/<br />
Investment Tax Credit<br />
+ +<br />
30% refund of investment<br />
SREC usually integral part of PPA<br />
Demand driven by State-level<br />
Renewables Portfolio Standards (RPS)<br />
Solar Renewable Energy<br />
Certificate (SREC)<br />
Demand driven by Solar Carve-outs<br />
as part of State-level RPS (RPS)<br />
MACRS<br />
Accelerated Depreciation<br />
for tax equity investors<br />
� Federal support is based on tax instruments like Production Tax Credits or Investment Tax Credits for<br />
Renewables (and temporarily Cash Grants), but no federal Renewables target has been set<br />
� On state-level, Renewable Portfolio Standards set targets for Renewables and the trading of Renewable<br />
Energy Certificates (REC), sometimes with specific solar requirements<br />
Policy
Global Unit Renewables<br />
For the time being, renewables require support to make<br />
them competitive – with respective impact on the public<br />
� RES extra costs are small compared to other subsidies,<br />
but more visible to customers<br />
43<br />
“Extra cost”<br />
=<br />
e.g. Premium,<br />
Green Certificate value<br />
Costs not included<br />
� Balancing and backup power<br />
� Required grid extension<br />
Savings not included<br />
� Dampened wholesale prices<br />
� Avoided external cost<br />
� Employment benefits<br />
� Social and health benefits<br />
Government budget<br />
(and in turn taxes)<br />
“Total<br />
financed<br />
by<br />
RES support” “Customer surcharge”<br />
Market value<br />
of electricity<br />
Financing depends on support scheme:<br />
US: PTC/ITC state budget<br />
US: RPS/REC customer surcharge<br />
EU: 100% customer surcharge<br />
Policy
Global Unit Renewables<br />
Contents<br />
E.<strong>ON</strong><br />
Achievements<br />
Ambition<br />
Addendum<br />
Technology summaries<br />
Policy frameworks<br />
Country summaries<br />
Organization<br />
44<br />
Countries
Portland<br />
San Francisco<br />
Global Unit Renewables<br />
45<br />
Key facts<br />
North America<br />
2,221 MW<br />
Ac<br />
Austin<br />
� Assets with 4,237 MW total capacity<br />
� 10.2 TWh electricity produced in 2011,<br />
equivalent to demand of ~2.6m homes<br />
� Global #8 in onshore wind<br />
� Global #3 in offshore wind<br />
� Active in 12 countries<br />
Chicago<br />
Roscoe<br />
Onshore<br />
782 MW<br />
� 828 employees, 35 nationalities<br />
1 JV of EC&R (26.25%), EWE (47.5%) and Vattenfall (26.25%)<br />
2 JV of EC&R (50%) and Abengoa Solar (50%)<br />
Note Figures as of 30 June 2012 unless stated otherwise; rounded<br />
Includes 56 MW PV capacity in operation in France and Italy<br />
Exemplary projects to showcase each technology in EC&R portfolio.<br />
Iberia<br />
535 MW<br />
UK<br />
449 MW<br />
Ac<br />
Coventry<br />
Madrid<br />
alpha ventus<br />
Offshore<br />
60 MW 1<br />
France<br />
94 MW<br />
Helioenergy<br />
CSP<br />
2x50 MW 2<br />
Düsseldorf<br />
Be<br />
Nordic<br />
279 MW<br />
Ac<br />
Ac<br />
Hamburg<br />
Milan<br />
Malmö<br />
Germany<br />
198 MW<br />
Munich<br />
Szczecin<br />
Italy<br />
374 MW<br />
Poland<br />
87 MW<br />
Summary<br />
EC&R currently operates a portfolio of 4.2 GW<br />
renewables capacity across Europe and North America<br />
Steven‘s Croft<br />
Biomass<br />
43 MW<br />
Ac<br />
Ac<br />
Rødsand II<br />
Offshore<br />
207 MW<br />
Lublin<br />
Brigadel<br />
PV<br />
8 MW<br />
Countries<br />
Be Headquarter<br />
Office location<br />
Ac Example project
Global Unit Renewables<br />
France: Market Profile<br />
46<br />
Market and Regulation EC&R portfolio and approach<br />
Political environment<br />
� Introduced renewables support later than many<br />
other EU countries<br />
� Renewables are supported via feed-in tariff<br />
� Since recently, use of tenders to fix feed-in tariffs<br />
for specific installations, with strong focus on<br />
renewable cost reduction, qualitative criteria,<br />
domestic value creation<br />
Renewable energy targets for 2020 1<br />
Technology 2010 2020<br />
Onshore wind 5.5 GW 19 GW<br />
Offshore wind 0.0 GW 6.0 GW<br />
Biomass 0.1 GW 2.4 GW<br />
PV 0.7 GW 4.8 GW<br />
1 Targets according to National Renewables Action Plan (NREAP) reported to EU Commission<br />
Right E.<strong>ON</strong> attributable capacity as of 30 June 2012, rounded<br />
Existing E.<strong>ON</strong> portfolio<br />
� 94 MW installed capacity<br />
� 83.5 MW onshore wind<br />
� 10.5 MW PV<br />
E.<strong>ON</strong> approach & pipeline<br />
� Onshore wind: Manage existing portfolio,<br />
currently no further growth planned<br />
� Offshore wind: Scouting opportunities to<br />
participate in offshore tender process<br />
� Biomass: Participated in tender for biomass<br />
conversion, waiting for final selection decision to<br />
be fully confirmed, permitting process ongoing<br />
Countries<br />
� PV: Pipeline to realize 10–20 MW p.a. via<br />
tenders. Entered first tender in Sep 2011<br />
(decision in 2012), second tender round expected<br />
for late 2012
Global Unit Renewables<br />
France: Assets in operation and under construction<br />
47<br />
France Onshore wind parks in operation<br />
6<br />
2<br />
Site in operation<br />
Site under construction<br />
Office location<br />
4<br />
Net MW = E.<strong>ON</strong> attributable capacity as of 30 June 2012, rounded<br />
COD = Commercial Operation Date<br />
5<br />
Paris<br />
1<br />
3<br />
La Ciotat<br />
7<br />
8<br />
Net MW COD<br />
1 Lehaucourt 10.0 2007<br />
2 Ambon 10.0 2008<br />
3 LV Cernon 10.0 2008<br />
4 Muzillac 10.0 2008<br />
5 Caulières 17.5 2010<br />
6 Kergrist 26.0 2010<br />
PV farms in operation<br />
83.5<br />
Net MW COD<br />
7 Le Lauzet 2.5 2009<br />
8 Brigadel 8.0 2011<br />
10.5<br />
Countries
Global Unit Renewables<br />
Germany: Market Profile<br />
48<br />
Market and Regulation EC&R portfolio and approach<br />
Political environment<br />
� Strong focus on renewables following the “energy<br />
turn-around” („Energiewende“) and accelerated<br />
nuclear phase-out<br />
� Long-term renewables growth track until 2050<br />
fixed in law 1<br />
� New legislation and government action to<br />
accelerate on grid extensions and offshore grid<br />
Renewable energy targets for 2020 2<br />
Technology 2010 2020<br />
Onshore wind 27 GW 36 GW<br />
Offshore wind 0.1 GW 10 GW<br />
1 Renewable Energy Act (EEG) amended July 2011<br />
2 Targets according to National Renewables Action Plan (NREAP) reported to EU Commission<br />
Right E.<strong>ON</strong> attributable capacity as of 30 June 2012, rounded<br />
Existing E.<strong>ON</strong> portfolio<br />
� 198 MW installed capacity<br />
� 182 MW onshore wind<br />
� 16 MW offshore wind: Share in Germany’s<br />
first far-shore wind park alpha ventus<br />
E.<strong>ON</strong> approach & pipeline<br />
� Onshore wind: Manage existing portfolio,<br />
currently no further growth planned. Provide<br />
expertise to third-party investments as a service.<br />
� Offshore wind: Strong pipeline in place.<br />
Construction of Amrumbank West (288 MW,<br />
COD 2015) announced in December 2011.<br />
Countries
Global Unit Renewables<br />
Germany: Assets in operation and under construction<br />
49<br />
Germany Onshore wind parks in operation<br />
13<br />
Dusseldorf<br />
Site in operation<br />
6<br />
14<br />
10<br />
Site under construction<br />
Office location<br />
Hamburg<br />
8<br />
12<br />
Munich<br />
Net MW = E.<strong>ON</strong> attributable capacity as of 30 June 2012, rounded<br />
COD = Commercial Operation Date<br />
3<br />
4<br />
9<br />
11<br />
2<br />
5<br />
7<br />
1<br />
Net MW COD<br />
1 Brandenburg 50.8 2001<br />
2 Mecklenburg-West Pomerania 36.7 2001<br />
3 Saxony-Anhalt 19.9 2002<br />
4 Kessing 0.4 2002<br />
5 Schonerlinde 0.8 2002<br />
6 Rheiner Windpark 2.5 2002<br />
7 Saxony 23.6 2004<br />
8 Helmstedt-Treue 8.0 2005<br />
9 Dargelutz 22.0 2006<br />
10 Cuxhaven 2.5 2006<br />
11 Riethnordhausen 7.4 2007<br />
12 Treue-Ost 8.0 2007<br />
182.4<br />
Offshore wind parks in operation Net MW COD<br />
14 alpha ventus 15.8 2010<br />
15.8<br />
Offshore wind parks under construction<br />
Net MW COD<br />
14 Amrumbank West 288.0 2015<br />
288.0<br />
Countries
Global Unit Renewables<br />
Italy: Market Profile<br />
50<br />
Market and Regulation EC&R portfolio and approach<br />
Political environment<br />
� Renewables support based on two instruments:<br />
� Green Certificates for wind and biomass<br />
� Feed-in premium for PV and CSP<br />
� Green Certificate scheme to change to a tenderbased<br />
feed-in tariff from 2013. New onshore<br />
projects need to be on sites with high wind to be<br />
valuable. Biomass projects capped at low level.<br />
� Earlier introduced a “Robin Hood” tax on all<br />
generation revenues including renewables<br />
Renewable energy targets for 2020 1<br />
Technology 2010 2020<br />
Onshore wind 5.8 GW 12 GW<br />
PV 8.8 GW 8.6 GW 2<br />
Biomass 1.0 GW 1.6 GW<br />
1 Targets according to National Renewables Action Plan (NREAP) reported to EU Commission<br />
2 PV target has been significantly increased from NREAP to now 16 GW by 2016<br />
Right E.<strong>ON</strong> attributable capacity as of 30 June 2012, rounded<br />
Existing E.<strong>ON</strong> portfolio<br />
� 374 MW installed capacity<br />
� 328 MW onshore wind<br />
� 46 MW PV<br />
E.<strong>ON</strong> approach & pipeline<br />
� Onshore wind: Moderate growth expected<br />
depending on new tariffs / system change in<br />
combination with Robin Hood tax<br />
� PV: ~50 MW to be operational by early 2012.<br />
Further growth of 20–40 MW p.a. envisaged,<br />
but Robin Hood tax and new tariffs may have<br />
negative impact<br />
� Biomass: Potential conversion of existing fossil<br />
E.<strong>ON</strong> plant being investigated<br />
Countries
Global Unit Renewables<br />
Italy: Assets in operation and under construction<br />
51<br />
Italy Onshore wind parks in operation<br />
16<br />
Site in operation<br />
Site under construction<br />
Office location<br />
15<br />
11<br />
1<br />
Milan<br />
5<br />
17<br />
14<br />
Rome<br />
11 10<br />
9<br />
Net MW = E.<strong>ON</strong> attributable capacity as of 30 June 2012, rounded<br />
COD = Commercial Operation Date<br />
2<br />
4<br />
3<br />
6<br />
7<br />
Net MW COD<br />
1 Florinas 20.0 2004<br />
2 Iardino 14.0 2005<br />
3 Vizzini 23.8 2006<br />
4 Montecute 44.0 2006<br />
5 Poggi Alti 20.0 2006<br />
6 Marco A. Severino 44.0 2007<br />
7 Serra Pelata I + II 54.0 2007<br />
7 Piano di Corda I + II 44.0 2007<br />
9 Santa Ninfa 32.3 2007<br />
10 Alcamo 32.0 2011<br />
PV farms in operation<br />
328.1<br />
Net MW COD<br />
11 Fiumesanto Car Park 1.4 2009<br />
11 Fiumesanto 2 18.0 2011<br />
11 Fiumesanto 5 11.2 2011<br />
14 Civitella 6.1 2011<br />
15 Costa Di Nobili (Lombardia) 2.7 2011<br />
16 Frugarola (Piemonte) 2.8 2011<br />
17 Nepi I + II 4.1 2012<br />
PV farms under construction<br />
46.3<br />
Net MW COD<br />
11 Fiumesanto 3 5.0 2012<br />
5.0<br />
Countries
Global Unit Renewables<br />
Nordic: Market Profile<br />
52<br />
Market and Regulation EC&R portfolio and approach<br />
Political environment<br />
� Denmark: Variable premium for renewables,<br />
offshore projects have to qualify via a tender<br />
� Sweden: Renewables supported via technologyneutral<br />
Green Certificate Scheme<br />
� Norway: From 2012 joint Green Certificate<br />
Scheme with Sweden<br />
Renewable energy targets for 2020<br />
Technology 2010 2020<br />
Denmark 1<br />
Offshore wind 0.6 GW 1.3 GW<br />
Sweden 2<br />
Onshore wind 1.8 GW 4.3 GW<br />
Offshore wind 0.1 GW 0.2 GW<br />
1 Targets according to National Renewables Action Plan (NREAP) reported to EU Commission<br />
2 Swedish figures are not targets but projections<br />
3 Norway is no EU member state and does not have an NREAP; targets 13.2 TWh additional RES-E generation by 2020.<br />
Right E.<strong>ON</strong> attributable capacity as of 30 June 2012, rounded<br />
Existing E.<strong>ON</strong> portfolio<br />
� 279 MW installed capacity<br />
� 72 MW onshore wind in Sweden<br />
� 207 MW offshore wind in Denmark<br />
E.<strong>ON</strong> approach & pipeline<br />
� Onshore wind Sweden: Strong growth with<br />
increasing project size<br />
� Onshore wind Norway: Potentially attractive<br />
growth opportunity<br />
� Offshore wind Denmark: Attractive market,<br />
growth depending on tender outcomes<br />
� Offshore wind Sweden: Construction of<br />
Kårehamn (48 MW, COD 2013) announced in<br />
December 2011. Physically attractive market,<br />
but technology-neutral certificate system puts<br />
offshore at a disadvantage.<br />
Countries
Global Unit Renewables<br />
Nordic: Assets in operation and under construction<br />
53<br />
Nordic Onshore wind parks in operation<br />
Site in operation<br />
Site under construction<br />
Office location<br />
9<br />
3 10<br />
8 4 11<br />
2<br />
7 Malmö<br />
5<br />
1<br />
6<br />
Net MW = E.<strong>ON</strong> attributable capacity as of 30 June 2012, rounded<br />
COD = Commercial Operation Date<br />
Net MW COD<br />
1 Southern Sweden 18.2 1996–08<br />
2 Halland I (Sweden) 4.8 2011<br />
3 Västra Götaland I (Sweden) 6.0 2011<br />
4 Kalmar I / Nybro (Sweden) 18.0 2011<br />
5 Skane I / Skaberskö (Sweden) 5.1 2012<br />
8 Halland 2 / Knäred (Sweden) 20.0 2012<br />
72.1<br />
Offshore wind parks in operation Net MW COD<br />
6 Rødsand II (Denmark) 207.0 2010<br />
207.0<br />
Onshore wind parks under construction<br />
Net MW COD<br />
7 Skane II / Örja (Sweden) 6.0 2012<br />
9 Halland III / Örken (Sweden) 18.0 2013<br />
10 Kalmar II / Villköl (Sweden) 18.9 2013<br />
42.9<br />
Offshore wind parks under construction<br />
Net MW COD<br />
11 Kårehamn (Sweden) 48.0 2013<br />
48.0<br />
Countries
Global Unit Renewables<br />
Poland: Market Profile<br />
54<br />
Market and Regulation EC&R portfolio and approach<br />
Political environment<br />
� Renewables are currently supported via<br />
technology-neutral Green Certificate Scheme<br />
which is fixed till 2017, but extension is expected<br />
to meet 2020 targets<br />
� EU Commission is pushing Poland for stronger<br />
efforts in renewables sector<br />
� New energy law from 2013 will make current<br />
scheme technology-specific (i.e. different number<br />
of Green Certificates per technology)<br />
Renewable energy targets for 2020 1<br />
Technology 2010 2020<br />
Onshore wind 1.1 GW 5.6 GW<br />
1 Targets according to National Renewables Action Plan (NREAP) reported to EU Commission<br />
Right E.<strong>ON</strong> attributable capacity as of 30 June 2012, rounded<br />
Existing E.<strong>ON</strong> portfolio<br />
� 86.5 MW installed capacity, all onshore wind<br />
E.<strong>ON</strong> approach & pipeline<br />
� Onshore wind: Continued strong growth<br />
expected<br />
Countries
Global Unit Renewables<br />
Poland: Assets in operation and under construction<br />
55<br />
Poland Onshore wind parks in operation<br />
Site in operation<br />
Site under construction<br />
4<br />
Office location<br />
Szczecin<br />
5<br />
3<br />
1 2<br />
Net MW = E.<strong>ON</strong> attributable capacity as of 30 June 2012, rounded<br />
COD = Commercial Operation Date<br />
Lublin<br />
Net MW COD<br />
1 Lebcz 1 (Gdańsk) 5.9 2007<br />
2 Lebcz 2 (Gdańsk) 7.4 2008<br />
3 Wielkopolska 52.5 2010<br />
4 Barzowice 20.7 2011<br />
86.5<br />
Onshore wind parks under construction<br />
Net MW COD<br />
5 Wysoka I 55.0 2014<br />
55.0<br />
Countries
Global Unit Renewables<br />
Portugal: Market Profile<br />
56<br />
Market and Regulation EC&R portfolio and approach<br />
Political environment<br />
� Renewables are supported via feed-in tariff<br />
� Projects have to qualify for tariff via tender<br />
� Due to state deficit, the International Monetary<br />
Fund (IMF) forces the government to lower<br />
subsidies for renewables<br />
� Discussions ongoing between government and<br />
associations regarding retroactive cuts<br />
Renewable energy targets for 2020 1<br />
Technology 2010 2020<br />
Onshore wind 1.1 GW 5.6 GW<br />
1 Targets according to National Renewables Action Plan (NREAP) reported to EU Commission<br />
Right E.<strong>ON</strong> attributable capacity as of 30 June 2012, rounded<br />
Existing E.<strong>ON</strong> portfolio<br />
� 75 MW installed capacity, all onshore wind<br />
E.<strong>ON</strong> approach & pipeline<br />
� Onshore wind: Manage existing portfolio,<br />
currently no further growth planned<br />
Countries
Global Unit Renewables<br />
Portugal: Assets in operation and under construction<br />
57<br />
Portugal Onshore wind parks in operation<br />
2<br />
1<br />
Lisbon<br />
3 4<br />
Site in operation<br />
Site under construction<br />
Office location<br />
Net MW = E.<strong>ON</strong> attributable capacity as of 30 June 2012, rounded<br />
COD = Commercial Operation Date<br />
Net MW COD<br />
1 Joguinho (Torres Vedras) 11.7 2006<br />
2 Alto Folgorosa 8.1 2008<br />
3 Espinhaço de Cão 10.0 2008<br />
4 Barão São João 45.0 2009<br />
74.8<br />
Countries
Global Unit Renewables<br />
Spain: Market Profile<br />
58<br />
Market and Regulation EC&R portfolio and approach<br />
Political environment<br />
� Renewables are supported via feed-in tariffs or<br />
premium, operator can chose between the two<br />
options on an annual basis<br />
� Projects have to be included in pre-registry to<br />
receive support<br />
� Current legislation expires at the end of 2012 for<br />
wind and at the end of 2013 for CSP. New<br />
legislation is put on hold until the existing budget<br />
deficit issue in the electricity market is resolved.<br />
Renewable energy targets for 2020 1,2<br />
Technology 2010 2020<br />
Onshore wind 20 GW 35 GW<br />
CSP 0.6 GW 4.8 GW<br />
1 Targets according to National Renewables Action Plan (NREAP) reported to EU Commission<br />
2 CSP target down from 5.0 GW as of latest Renewable Energy Plan<br />
Right E.<strong>ON</strong> attributable capacity as of 30 June 2012, rounded<br />
Existing E.<strong>ON</strong> portfolio<br />
� 460 MW installed capacity<br />
� 381 MW onshore wind<br />
� 50 MW CSP<br />
� 25 MW small hydro<br />
� 4 MW small biogas<br />
E.<strong>ON</strong> approach & pipeline<br />
� Onshore wind: Participating in tenders; overall<br />
moderate growth expected, mainly depending on<br />
new remuneration scheme<br />
� CSP: Project “Helioenergy I” in partnership with<br />
Abengoa Solar operational since August 2011.<br />
“Helioenergy II” operational since January 2012.<br />
Countries
Global Unit Renewables<br />
Spain: Assets in operation and under construction<br />
59<br />
Spain Onshore wind parks in operation<br />
4 6 9<br />
13<br />
Site in operation<br />
Site under construction<br />
Office location<br />
11<br />
21 Madrid<br />
23<br />
20<br />
22<br />
12<br />
3<br />
14<br />
2<br />
Net MW = E.<strong>ON</strong> attributable capacity as of 30 June 2012, rounded<br />
COD = Commercial Operation Date<br />
8<br />
7 16<br />
15 10<br />
19 17 5<br />
18<br />
1<br />
Net MW COD<br />
4 Pax 19.2 1997<br />
5 Borja 1 8.1 1997<br />
6 Ascoy 1.5 1998<br />
7 Remolinos 5.9 1998<br />
8 Planas de Pola 17.8 1999<br />
9 Pico Gallo 24.4 2001<br />
10 Borja 2 10.8 2001<br />
11 Páramo de Poza 15.0 2002<br />
12 Boquerón 24.8 2003<br />
13 Carcelén 11.4 2004<br />
14 Bodenaya 18.0 2005<br />
15 San Juan de Bargas 21.0 2005<br />
16 Mallén 30.0 2006<br />
17 Magallón 14.5 2006<br />
18 Mingorrugio 26.0 2009<br />
19 Sierra de Tineo 44.0 2009<br />
Countries<br />
20 La Victoria<br />
24.0 2011<br />
21 Matabuey<br />
14.4 2011<br />
22 Hiperion II 50.0 2011<br />
380.7
Global Unit Renewables<br />
Spain: Assets in operation and under construction (cont.)<br />
60<br />
Spain<br />
4 6 9<br />
13<br />
Site in operation<br />
Site under construction<br />
Office location<br />
11<br />
21 Madrid<br />
23<br />
20<br />
22<br />
12<br />
3<br />
14<br />
2<br />
Net MW = E.<strong>ON</strong> attributable capacity as of 30 June 2012, rounded<br />
COD = Commercial Operation Date<br />
8<br />
7 16<br />
15 10<br />
19 17 5<br />
18<br />
1<br />
Small biogas sites in operation<br />
Net MW COD<br />
1 Juneda (Lerida) 4.3 2001<br />
4.3<br />
Small hydro sites in operation<br />
CSP plants in operation<br />
Net MW COD<br />
2 E2I CRISA 5.3 2005<br />
3 Giribiaile (Jaén) 20.0 2007<br />
25.3<br />
Net MW COD<br />
23 Helioenergy I+II 50.0 2011/12<br />
50.0<br />
Countries
Global Unit Renewables<br />
UK: Market Profile<br />
61<br />
Market and Regulation EC&R portfolio and approach<br />
Political environment<br />
� Strong focus on low-carbon policy with a target of<br />
80% carbon reduction by 2050; introduction of a<br />
carbon tax<br />
� Renewables supported by Renewable Obligation<br />
Certificate Scheme (ROCS), recently updated<br />
with new technology-specific ROC bands<br />
(effective from 2013)<br />
� Plans for a wider Electricity Market Reform<br />
including Contracts-for-Difference from 2014<br />
Renewable energy targets for 2020 1<br />
Technology 2010 2020<br />
Onshore wind 4 GW 15 GW<br />
Offshore wind 1.3 GW 13 GW<br />
Biomass 0.6 GW 3.1 GW<br />
1 Targets according to National Renewables Action Plan (NREAP) reported to EU Commission<br />
Right E.<strong>ON</strong> attributable capacity as of 30 June 2012, rounded<br />
Existing E.<strong>ON</strong> portfolio<br />
� 449 MW installed capacity<br />
� 162 MW onshore wind<br />
� 244 MW offshore wind<br />
� 43 MW biomass<br />
E.<strong>ON</strong> approach & pipeline<br />
� Onshore wind: Continued strong growth<br />
expected with increasing project size.<br />
� Offshore wind: Strong pipeline in place.<br />
Construction of Humber Gateway (219 MW,<br />
COD 2015) announced in December 2011.<br />
Rampion being prepared as Round 3 project.<br />
� Biomass: Conversion of Ironbridge fossil plant<br />
(300 MW) announced. Continue selective new<br />
build projects like Blackburn Meadows (30 MW).<br />
Countries
Global Unit Renewables<br />
UK: Assets in operation and under construction<br />
62<br />
UK Onshore wind parks in operation<br />
Site in operation<br />
Site under construction<br />
Office location<br />
Coventry<br />
Net MW = E.<strong>ON</strong> attributable capacity as of 30 June 2012, rounded<br />
COD = Commercial Operation Date<br />
8<br />
1<br />
18<br />
21<br />
7<br />
9<br />
4<br />
26 5<br />
20<br />
6<br />
22<br />
15<br />
11<br />
12 13<br />
17 16<br />
24<br />
19<br />
2 10<br />
3 28<br />
23<br />
14<br />
27<br />
25<br />
Net MW COD<br />
1 Rhyd-y-Groes (Wales) 3.6 1992<br />
2 Ovenden Moor (Yorkshire) 4.6 1993<br />
3 Royd Moor (Yorkshire) 3.3 1993<br />
4 Oldside (Cumbria) 5.4 1996<br />
5 Siddick (Cumbria) 4.2 1996<br />
6 Askam (Cumbria) 4.6 1999<br />
7 Lowca (Cumbria) 4.6 2000<br />
8 Deucheran Hill (Kintyre Peninsula) 15.8 2001<br />
9 Bowbeat (Scotland) 31.2 2002<br />
10 Out Newton (Northumberland) 9.1 2002<br />
11 Holmside (County Durham) 5.1 2004<br />
12 High Volts (County Durham) 7.8 2004<br />
13 Hare Hill (County Durham) 5.1 2004<br />
14 Stags Holt & 5A (Cambridgeshire) 20.0 2007/10<br />
15 Haswell Moor (County Durham) 10.3 2010<br />
16 Great Eppleton (Sunderland) [Repower] 8.2 2011<br />
17 Butterwick Moor (County Durham) 18.8 2011<br />
161.6<br />
Onshore wind parks under construction<br />
Net MW COD<br />
18 Rosehall (Scotland) 24.7 2012<br />
19 Tween Bridge (Yorkshire) 44.0 2012<br />
20 Camster (Scotland) 50.0 2013<br />
118.7<br />
Countries
Global Unit Renewables<br />
UK: Assets in operation and under construction (cont.)<br />
63<br />
UK<br />
Site in operation<br />
Site under construction<br />
Office location<br />
Coventry<br />
Net MW = E.<strong>ON</strong> attributable capacity as of 30 June 2012, rounded<br />
COD = Commercial Operation Date<br />
8<br />
1<br />
18<br />
21<br />
7<br />
9<br />
4<br />
26 5<br />
20<br />
6<br />
22<br />
15<br />
11<br />
12 13<br />
17 16<br />
24<br />
19<br />
2 10<br />
3 28<br />
23<br />
14<br />
27<br />
25<br />
Biomass plants in operation<br />
Net MW COD<br />
21 Steven’s Croft (Lockerbie) 43.3 2008<br />
43.3<br />
Biomass plants under construction Net MW COD<br />
22 Ironbridge (Shropshire) [Conversion] 300.0 2012<br />
23 Blackburn Meadows (Sheffield) 30.0 2014<br />
330.0<br />
Offshore wind parks in operation Net MW COD<br />
24 Blyth (Northumberland) 3.8 2000<br />
25 Scroby Sands (Great Yarmouth) 60.0 2004<br />
26 Robin Rigg (Solway Firth) 180.0 2010<br />
243.8<br />
Offshore wind parks under construction<br />
Net MW COD<br />
27 London Array I 189.0 2012<br />
28 Humber Gateway 219.0 2015<br />
408.0<br />
Countries
Global Unit Renewables<br />
US: Market Profile<br />
64<br />
Market and Regulation EC&R portfolio and approach<br />
Federal level<br />
� No renewables targets<br />
� Renewables support through cash grants or<br />
alternatively Production Tax Credit (PTC)<br />
� For wind projects, cash grants currently expire<br />
end 2011 and PTC expires end 2012. For solar<br />
projects, both expire 2016.<br />
� PTC has been extended several times several<br />
times, even retroactively, but current debate<br />
about federal debt and spending cuts runs<br />
against extension.<br />
� 2012 Presidential elections will divert attention<br />
from decisions on new legislation.<br />
State level<br />
� 27 of the 50 US States have Renewable Portfolio<br />
Standards (RPS) similar to a quota, with<br />
certificates to track fulfillment and support<br />
renewables.<br />
Right E.<strong>ON</strong> attributable capacity as of 30 June 2012, rounded<br />
Existing E.<strong>ON</strong> portfolio<br />
� 2,221 MW installed capacity, all onshore wind<br />
E.<strong>ON</strong> approach & pipeline<br />
� Onshore wind: Growth focus with ~300 MW new<br />
build p.a. in mainly PJM/MISO/ESCO zones<br />
� PV: Focus on growth in California and Arizona,<br />
with a target of ~100 MW p.a.<br />
Countries
Global Unit Renewables<br />
US: Assets in operation and under construction<br />
65<br />
US Onshore wind parks in operation<br />
Portland<br />
San Francisco<br />
7 1<br />
12 3<br />
Site in operation<br />
Site under construction<br />
Office location<br />
8<br />
4 6<br />
5<br />
Denver<br />
Chicago<br />
Austin<br />
17 9<br />
15<br />
14 13<br />
16<br />
11 2<br />
1 Part of the Roscoe complex, the 2 nd largest onshore wind farm in the world<br />
Net MW = E.<strong>ON</strong> attributable capacity as of 30 June 2012, rounded<br />
COD = Commercial Operation Date<br />
Net MW COD<br />
1 Forest Creek (Texas) 124.2 2006<br />
2 Munnsville (New York) 34.5 2007<br />
3 Sand Bluff (Texas) 90.0 2008<br />
4 Roscoe (Texas) 1 209.0 2008<br />
5 Champion (Texas) 1 126.5 2008<br />
6 Inadale Phase 1/2 (Texas) 1 197.0 2008<br />
7 Panther Creek I & II (Texas) 258.0 2008<br />
8 Pyron (Texas) 1 249.0 2009<br />
9 Papalote I (Texas) 179.9 2009<br />
9 Papalote II (Texas) 200.1 2010<br />
11 Stony Creek (Pennsylvania) 52.5 2009<br />
12 Panther Creek III (Texas) 199.5 2009<br />
13 Settlers Trail (Illinois) 150.4 2011<br />
14 Pioneer Trail (Illinois) 150.4 2011<br />
161.2<br />
Onshore wind parks under construction<br />
Net MW COD<br />
15 Magic Valley I (Texas) 203.3 2012<br />
16 Wildcat / Grant I (Indiana) 203.0 2012<br />
17 Anacacho (Texas) 99.8 2012<br />
118.7<br />
Countries
Global Unit Renewables<br />
Contents<br />
E.<strong>ON</strong><br />
Achievements<br />
Ambition<br />
Addendum<br />
Technology summaries<br />
Policy frameworks<br />
Country summaries<br />
Organization<br />
66<br />
Organization
Global Unit Renewables<br />
Organizational setup<br />
67<br />
Health, Safety, Security and Environment (HSSE)<br />
Asset Management<br />
Performance Improvement<br />
Technology & Innovation<br />
Onshore Wind<br />
Northern Europe<br />
Onshore Wind<br />
Southern Europe<br />
Onshore Wind<br />
North America<br />
As of 1 September 2012<br />
Board<br />
Central Functions<br />
Business Development & Business Affairs<br />
Legal and Corporate Affairs<br />
Finance<br />
Procurement<br />
Business Units<br />
Human Resources (HR)<br />
Offshore Wind Solar Biomass<br />
Organization
Global Unit Renewables<br />
Our people and diverse culture are key to our success<br />
68<br />
Development of EC&R’s workforce EC&R – a diverse team<br />
Workforce<br />
(headcount)<br />
EBITDA<br />
(€m)<br />
Productivity<br />
(€k EBITDA pp)<br />
2008<br />
526<br />
152<br />
289<br />
2009<br />
653<br />
293<br />
449<br />
+15%<br />
+54%<br />
+33%<br />
2010<br />
703<br />
452<br />
643<br />
828 employees<br />
Located across 11 countries<br />
Germany<br />
Sweden<br />
Singapore<br />
UA Emirates<br />
35 different nationalities<br />
76% men, 24% women<br />
� EC&R continuously creates new jobs – and productivity increases<br />
2011<br />
Left Figures as of year end, respectively<br />
Right Figures as of 30 June 2012, including non-fully consolidated companies (5 colleagues)<br />
804<br />
551<br />
685<br />
UK<br />
USA<br />
Spain<br />
Italy<br />
Portugal<br />
Poland<br />
France<br />
1<br />
5<br />
4<br />
12<br />
9<br />
49<br />
65<br />
85<br />
174<br />
185<br />
Organization<br />
239
Global Unit Renewables<br />
E.<strong>ON</strong> Climate & Renewables Board of Management<br />
Mike Winkel<br />
CEO<br />
German native<br />
Studied Business Economics<br />
and Power Engineering in<br />
Zittau and in Oxford<br />
Expert in trading and<br />
optimization of power plants<br />
Former Deputy General<br />
Manager of E.<strong>ON</strong> Russia<br />
69<br />
As of 1 August 2012<br />
Cord Landsmann<br />
CFO<br />
German native<br />
PhD in Finance<br />
13 years utilities experience<br />
International M&A experience<br />
Skilled in intercultural working<br />
environment (U.S., Europe)<br />
Michael Lewis<br />
COO Wind Power<br />
British native<br />
Organization<br />
Mechanical Engineer,<br />
MSc Pollution Control,<br />
Diploma Accounting and Finance<br />
18 years in international energy<br />
industry
Global Unit Renewables<br />
This presentation may contain forward-looking statements based on current assumptions and forecasts<br />
made by E.<strong>ON</strong> Climate & Renewables management and other information currently available to E.<strong>ON</strong>.<br />
Various known and unknown risks, uncertainties and other factors could lead to material differences<br />
between the actual future results, financial situation, development or performance of the company and the<br />
estimates given here. E.<strong>ON</strong> Climate & Renewables does not intend, and does not assume any liability<br />
whatsoever, to update these forward-looking statements or to conform them to future events or<br />
developments.<br />
70