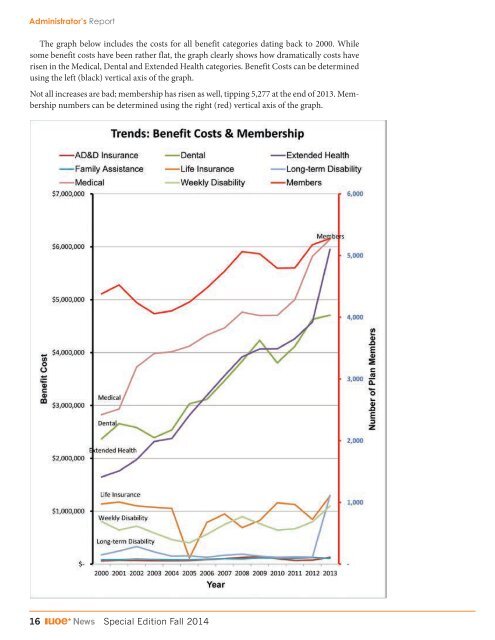
Administrator’s ReportThe graph below includes the costs for all benefit categories dating back to 2000. Whilesome benefit costs have been rather flat, the graph clearly shows how dramatically costs haverisen in the Medical, Dental and Extended Health categories. Benefit Costs can be determinedusing the left (black) vertical axis of the graph.Not all increases are bad; membership has risen as well, tipping 5,277 at the end of 2013. Membershipnumbers can be determined using the right (red) vertical axis of the graph.16 <strong>News</strong> <strong>Special</strong> <strong>Edition</strong> Fall <strong>2014</strong>
Administrator’s ReportAdministration ExpensesThe following tables give a breakdown of administrative disbursements for the period commencing in 2000.Operating Engineers’ Pension PlanYear Ending Assets Contributions ExpensesExpenses asa % of AssetsExpensesas a % ofContributionsTotal PlanParticipantsExpensesper PlanParticipant,per yearApril 30, 2000 $412,784,657 $18,644,501 $702,151 0.17% 3.77% 12,447 $56.41April 30, 2001 $416,350,954 $22,790,835 $678,916 0.16% 2.98% 12,654 $53.65April 30, 2002 $485,414,220 $17,144,904 $660,816 0.14% 3.85% 12,739 $51.87April 30, 2003 $490,087,308 $17,889,602 $811,192 0.17% 4.53% 12,836 $63.20April 30, 2004 $531,062,657 $18,511,783 $698,680 0.13% 3.77% 12,836 $54.43April 30, 2005 $611,447,912 $21,344,139 $685,298 0.11% 3.21% 12,836 $53.39April 30, 2006 $661,907,384 $26,948,233 $1,146,822 0.17% 4.26% 12,611 $90.94April 30, 2007 $727,512,372 $28,377,553 $980,418 0.13% 3.45% 12,870 $76.18April 30, 2008 $732,913,398 $31,418,564 $810,319 0.11% 2.58% 13,322 $60.83April 30, 2009 $713,473,674 $30,060,633 $1,065,027 0.15% 3.54% 13,450 $79.18April 30, 2010 $782,235,346 $26,235,516 $935,082 0.12% 3.56% 13,290 $70.36April 30, 2011 $844,956,804 $28,509,186 $1,015,967 0.12% 3.56% 13,274 $76.54April 30, 2012 $1,013,752,735 $35,479,577 $1,141,079 0.11% 3.22% 13,523 $84.38April 30, 2013 $1,057,885,340 $36,780,111 $900,340 0.09% 2.45% 13,578 $66.31Operating Engineers’ Benefits PlanYear Ending Assets Contributions ExpensesExpenses as a% of AssetsExpensesas a % ofContributionsTotal PlanParticipantsExpensesper PlanParticipant,per yearDec. 31, 2000 $25,930,085 $10,619,468 $723,469 2.79% 6.81% 11,406 $63.43Dec. 31, 2001 $24,181,086 $8,521,071 $722,317 2.99% 8.48% 11,118 $64.97Dec. 31, 2002 $24,494,360 $9,462,127 $604,709 2.47% 6.39% 10,448 $57.88Dec. 31, 2003 $24,853,971 $10,274,224 $523,110 2.10% 5.09% 10,108 $51.75Dec. 31, 2004 $26,374,356 $11,389,921 $593,624 2.25% 5.21% 10,249 $57.92Dec. 31, 2005 $29,643,824 $13,038,803 $711,203 2.40% 5.45% 10,712 $66.39Dec. 31, 2006 $32,057,915 $13,664,782 $799,280 2.49% 5.85% 11,116 $71.90Dec. 31, 2007 $32,345,223 $15,118,433 $847,359 2.62% 5.60% 11,719 $72.31Dec. 31, 2008 $31,073,300 $15,569,742 $772,521 2.49% 4.96% 11,994 $64.41Dec. 31, 2009 $34,303,853 $13,712,670 $810,404 2.36% 5.91% 11,660 $69.50Dec. 31, 2010 $34,216,220 $13,377,710 $837,022 2.45% 6.26% 11,016 $75.98Dec. 31, 2011 $36,414,701 $15,442,009 $980,032 2.69% 6.35% 11,943 $82.06Dec. 31, 2012 $37,493,408 $17,210,628 $987,513 2.63% 5.74% 11,958 $82.58Dec. 31, 2013 $38,047,271 $18,437,103 $942,128 2.48% 5.11% 12,224 $77.07<strong>Special</strong> <strong>Edition</strong> Fall <strong>2014</strong> <strong>News</strong> 17