The Analysis of Solar Energetic Particles
The Analysis of Solar Energetic Particles - NOA
The Analysis of Solar Energetic Particles - NOA

You also want an ePaper? Increase the reach of your titles
YUMPU automatically turns print PDFs into web optimized ePapers that Google loves.
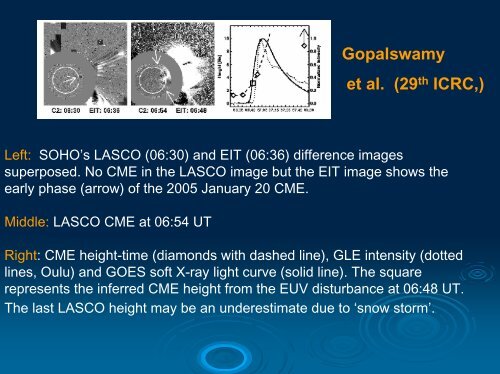
Gopalswamyet al. (29 th ICRC,)Left: SOHO’s LASCO (06:30) and EIT (06:36) difference imagessuperposed. No CME in the LASCO image but the EIT image shows theearly phase (arrow) <strong>of</strong> the 2005 January 20 CME.Middle: LASCO CME at 06:54 UTRight: CME height-time (diamonds with dashed line), GLE intensity (dottedlines, Oulu) and GOES s<strong>of</strong>t X-ray light curve (solid line). <strong>The</strong> squarerepresents the inferred CME height from the EUV disturbance at 06:48 UT.<strong>The</strong> last LASCO height may be an underestimate due to ‘snow storm’.