Boating Capacity Study Possum Kingdom Lake Texas
Boating Capacity Study for Possum Kingdom Lake - Final Report
Boating Capacity Study for Possum Kingdom Lake - Final Report

You also want an ePaper? Increase the reach of your titles
YUMPU automatically turns print PDFs into web optimized ePapers that Google loves.
<strong>Boating</strong> <strong>Capacity</strong> <strong>Study</strong><strong>Possum</strong> <strong>Kingdom</strong> <strong>Lake</strong>, <strong>Texas</strong>FINAL REPORTSubmitted to the Brazos River AuthorityApril 2006Prepared by:John Titre, Chris Jones,Justin Woods & Memory KaramozondoDecision Support for <strong>Lake</strong> ManagersPark Studies,
Executive SummaryDescription and Purpose of the <strong>Study</strong>The Brazos River Authority (BRA) contracted Park Studies, Inc. (PSI) to conduct a boatcapacity study on <strong>Possum</strong> <strong>Kingdom</strong> <strong>Lake</strong> (PKL) over a one-year period. Actual datacollection occurred during a 12-week period from May 28, 2005 to August 15, 2005. Theprimary purpose of the study was to provide BRA management with a baseline by whichto make future development decisions for the lake. The study focused on boatingdensities, crowding, and public safety related to understanding what issues are mostimportant to the boaters. This information was deemed useful to resource managers inpromoting the safe and healthy use of the lake while providing high quality recreationalexperiences.Survey <strong>Study</strong> MethodsThree groups of PKL users were targeted for soliciting survey responses that included: 1)on-site exit interviews with those removing their boats from public boat ramps on PKL;2) a mail-back survey of marina slip renters; and 3) private dock owners. In addition,actual physical boat counts were systematically conducted during the course of the studyin order to document the amount and type of boating use by location on the lake.<strong>Possum</strong> <strong>Kingdom</strong> <strong>Lake</strong> Boater Survey ResultsA total of 143 ramp user surveys were administered at public boat ramps. 800 surveyswere mailed to a sample of marina slip renters and private dock owners. There were 702valid surveys and 61% were returned (427). The total sample size was 570 boaters.• The typical boat ramp user at PKL has been boating on the lake for an average of10.3 years while marina slip renters and private dock owners have been boatingfor an average of 19.6 years.• The average number of weekend days boating for ramp users was 9.3 days whilemarina slip renters and private dock owners boated 23.1 days.• The average number of weekdays boating for ramp users was 6.4 days whilemarina slip renters and private dock owners boated 15.7 days.• While PKL boaters come from more than 90 cities around the area, the largestgroups were from Ft. Worth (11.0%), Weatherford (7.6%), Wichita Falls (6.3%),and Mineral Wells (6.1%).Activities on <strong>Possum</strong> <strong>Kingdom</strong> <strong>Lake</strong>• The typical boat ramp user at PKL has a boat that is 19 feet long for an averagewhile marina slip renters and private dock owners have boats averaging 24 feetlong.• The average horsepower for ramp users was 199 and for marina slip renters andprivate dock owners it was 266.• Less than 5% indicated that they went fishing on <strong>Possum</strong> <strong>Kingdom</strong> <strong>Lake</strong>.1<strong>Possum</strong> <strong>Kingdom</strong> <strong>Lake</strong> <strong>Boating</strong> <strong>Capacity</strong> <strong>Study</strong> April 2006, All Rights Reserved, ©Park Studies, Inc.
• More than one-half of all PKL boaters (54%) indicated they used a runabout,speedboat, or ski boat during their typical visit; 23.0% indicated they used apersonal watercraft; 16.9% pontoon boat; and 15.3% stated that they usedfishing/bass boat 1 .• Other boats used less frequently on PKL included high performance boats, flatbottom boats, johnboats, V-Hull boats, sail boats/sail boards or house boats onPKL.• The majority of PKL boaters appear to spend most of their time on the lakecruising (46.7%), water-skiing (27.5%), or swimming (10.7%).What Boaters Think about <strong>Possum</strong> <strong>Kingdom</strong> <strong>Lake</strong>?Boaters were asked if they had a favorite location on PKL, whether there were anylocations on the lake that they deliberately avoided, and whether there were anylocations on the lake that they thought were unsafe. In addition, the boaters wereasked to identify the location and explain why they considered it his/her favorite, whyhe/she avoided any locations, and why he/she thought a location was unsafe.• Eighty-one percent of the boaters indicated they had a favorite location on PKL,while 19% did not have a favorite location. Hell’s Gate was cited by 14% of theboaters as their most favorite location on PKL. Most boaters indicated theyenjoyed the smooth and clam water around Hell’s Gate and the bluffs protectedthem from the wind. Other favorite locations identified on PKL included: theState Park and Sandy Beach, The Dam, Neely’s Slough, Caddo Creek and CaddoBay.• While the majority of boaters (51.8%) indicated there was not any location onPKL that they avoided, a little less than one-half (48.2%) of the boaters indicatedthere was a location on PKL they deliberately avoided. About six percent of theboaters indicated that they avoided the Hell’s Gate location, along with PeanutPatch (3%) as another PKL location they tended to avoid.• Seventy-four percent of the boaters stated that they had no location on PKL thatthey felt was unsafe, while 26% identified a location which he/she felt wasunsafe. Locations that boaters felt unsafe included Hell’s Gate (especially duringthe 4 th of July Holiday Weekend), the North End and Rock Creek, the Hog Bendarea, any location that had a lot of tree stumps under the water, and areas that aretoo shallow especially when the water levels are low during the summer.Safety and Conflicts on <strong>Possum</strong> <strong>Kingdom</strong> <strong>Lake</strong>• The majority of ramp users (66.4%) reported feeling extremely safe on the water,with 27.4% feeling moderately safe, 3.4% feeling somewhat safe, and only .7% ofPKL ramp users reported feeling not at all safe on the water.• Less than a majority of PKL marina slip renters and private dock owners (37.2%)indicated a feeling of safety while on the water, with 33.0% feeling moderately1 Percentages could be greater than 100% since boaters could check more than one activity.2<strong>Possum</strong> <strong>Kingdom</strong> <strong>Lake</strong> <strong>Boating</strong> <strong>Capacity</strong> <strong>Study</strong> April 2006, All Rights Reserved, ©Park Studies, Inc.
safe, and 6.3% reporting they felt somewhat safe. Only .7% reported they did notfeel safe at all while on PKL waters.• In terms of feeling crowded on the water at PKL, a majority of ramp users(65.8%) indicated they did not feel crowded, while 19.2% of PKL ramp usersreported feeling somewhat crowded and 7.5% reported moderately crowded.Only 5.5% of ramp users reported being extremely crowded.• Marina slip renters and private dock owners showed greater sensitivities tocrowding on the water. Only 23.0% indicated that they felt not at all crowded.Twenty-four percent felt somewhat crowded, with 22.7% moderately crowdedand 8.9% extremely crowded.• When asked whether there was an adequate number of marinas, a majority oframp users (87.7%) felt the number was about right with 1.4% indicating toomany and 8.9% indicating a need for more.• For marina slip renters and private dock owners, 54.1% indicated that there werean adequate number of marinas, 20.4% indicated the need for more, and 2.8% feltthere were too many.Changes on <strong>Possum</strong> <strong>Kingdom</strong> <strong>Lake</strong> – Likes, Dislikes, and Desires• Sixty-eight percent of the boaters indicated they had noticed a change on PKLover the past five years, while 32% reported they had not noticed any changes onthe lake. Of the 68% of PKL boaters that had noticed a change, 28.0% had noticednegative changes, 23.0% had notice both negative and positive change, and 17.0%had noticed only positive changes.• Notable positive changes included cleaner and new facilities, new ramps, marinaparking spaces added to the lake, new restaurants, businesses, more houses beingadded to the lake area, property owners working to fight tax increases, more lawenforcement patrolling the lake, and more people using the lake.• Negative changes reported included: a fluctuating water level, more boat traffic,more development along the Cliffside, and property taxes increasing.GIS and <strong>Boating</strong> <strong>Capacity</strong> MethodsData collected during the summer of 2005 at <strong>Possum</strong> <strong>Kingdom</strong> <strong>Lake</strong> were used todevelop classification maps. Conflict data were collected from mailed surveys (marinaand dock owners) and from exit interviews on the boat ramps. Conflict maps weredeveloped that show the location of areas that boaters considered their favorite, unsafe, oravoided. These maps were used to develop a conflict rating for each managementcompartment.Conflict percentages were derived from responses from boaters surveyed. Avoided andunsafe responses were regarded as areas of conflict. Favorite responses were notconsidered conflict areas. Percentages for each management compartment were found byfinding the percent of conflicted responses to the total number of responses for eachmanagement compartment.Areas with a conflict percentage of
considered as moderate conflict and >12% were considered high conflict (ES Table 1).Boat density was computed from scheduled boat counts (ES Table 2). The lake wasdivided into four zones. <strong>Lake</strong> Rangers and data collectors made four counts in each zone– two on weekdays and two on weekend days for a total of 16 boat counts. Counts werealso conducted on July 3, 2005.ES Table 1: ManagementCompartment ClassificationCriteria MatrixUse LevelIncidence of ConflictHigh Moderate LowVery High I I IIIHigh I I II IIIModerate I II IILow II II IVVery Low II II IVES Table 2: <strong>Boating</strong> DensityUse Level DensityVery High < 10.0 acres/boatHigh10.0–15.0 acres/boatModerate 15.1–20.0 acres/boatLow20.1–25.0 acres/boatVery Low > 25.0 acres/boatManagement compartment density was found in two ways. Map A uses only data fromscheduled counts (excludes July 3) with a 66.7% weight for weekends and 33.3% forweekdays (ES Table 3). Map B includes data from July 3. Each weekend daycontributed 25% for a weighted influence of 50%. Each weekday contributed 12.5% fora weighted influence of 25%. July 3 counted for 25% and only contributed to Map B.ES Table 3: Time Period Influence on Maps A & BTime PeriodWeighted InfluenceMap A Map BWeekdays 33.3% 25%(12.5% x 2 days)Weekends 66.7% 50%(25% x 2 days)July 3 0 25%After the number of boats per management compartment was found, they were dividedinto the acres to find acres per boat. Density levels were computed from the densitychart.To find the final classification for each management compartment, density levels andconflict levels were examined in combination. It is recommended that the PKL datainclude July 3 based on data gathered to indicate that 2005 was low-use year for boating.After classifications were found, maps were developed for each lake, for each scenario(Maps A and B), including maps based on projected increases in density (20%, 40%,60%, 80%, and 100%) for the lake. ES Table 4 shows the recommended criteria forcompartment classification. Map B is shown here as the recommended map for PKL4<strong>Possum</strong> <strong>Kingdom</strong> <strong>Lake</strong> <strong>Boating</strong> <strong>Capacity</strong> <strong>Study</strong> April 2006, All Rights Reserved, ©Park Studies, Inc.
while Map A is provided in Appendix B.Class IClass IIClass IIIClass IVES Table 4: Management Compartment ClassificationExisting <strong>Boating</strong>ConditionsModerate to very high boat trafficdensity at peak use times and highto very high incidence of conflictModerate to high boat trafficdensity at peak use times andmoderate to very low incidence ofconflictHigh to very high boat trafficdensity at peak use times but lowincidence of conflictLow or very low boat trafficdensity, even at peak usetimes, and low incidence ofconflictManagement ObjectivesNo new development is recommended sinceit may worsen the conditions for safety andenjoyment. Greater law enforcement,boating patrol, and education are necessary.Consideration of new development ispossible in combination with managementand resource factors.Since conditions are often characterized bystationary boats located in sheltered “escapecoves” it is important to protect theseopportunities and no development isrecommended.No development is recommended toprotect low density/low conflict orpristine experiences on the water.5<strong>Possum</strong> <strong>Kingdom</strong> <strong>Lake</strong> <strong>Boating</strong> <strong>Capacity</strong> <strong>Study</strong> April 2006, All Rights Reserved, ©Park Studies, Inc.
Management RecommendationsThese recommendations are based on cooperating partner workshops, public workshops,e-mail and written correspondence, and consultant experience.• Freeze existing commercial on-water facilities, wet storage marinas, to includethose previously contracted expansions, at present levels and opt for dry stackstorage at suitable locations• No additional private on-water facilities unless grandfathered• Install channel buoy markers• Authorize additional public boat ramps based upon lake impact• Continue to enhance ramp, courtesy docks, and parking conditions• Continue to enforce Federal Energy Regulatory Commission (FERC) regulationsregarding setbacks• Creation of additional shoreline buffers beyond those mandated by FERCSummary RecommendationsThis study recommends no further development in management compartments I, III, andIV that would result in additional boating density and potential conflicts in those areas.6<strong>Possum</strong> <strong>Kingdom</strong> <strong>Lake</strong> <strong>Boating</strong> <strong>Capacity</strong> <strong>Study</strong> April 2006, All Rights Reserved, ©Park Studies, Inc.
Table of ContentsExecutive Summary 1Table of Contents 7List of Figures and Tables 91 Introduction 11The Problem 11Objectives 11Recreational <strong>Boating</strong> <strong>Capacity</strong> 12The Need for Management Information and Evaluation Procedures 13Value Judgments and Management Information 13Expanding Public Input and Focusing on Boaters 14Boaters’ Perceptions and Preferences 15A Five-Step Process© to Address <strong>Boating</strong> <strong>Capacity</strong> 15Principles 15Process 16Partnerships 17Collaboration 18Criteria 182 Methods 21Introduction 21<strong>Study</strong> Area 21Location of <strong>Possum</strong> <strong>Kingdom</strong> <strong>Lake</strong> 22Sample Populations 22Inventory of Boater Access Points 22Sampling Methods 22Sampling Limitations 24Boater Survey 24<strong>Study</strong> Methods 24Boat Count Methods 25On-Site Survey Methods 26Mail-back Survey Methods 27Survey Instrument 27Boater Survey Questions 28Data Analysis 28Management Compartments Defined 29Classification of Management Compartments 30Incidence of Conflict and Boater Density 30GIS and <strong>Boating</strong> <strong>Capacity</strong> 31On-The-Water Boat Counts 347<strong>Possum</strong> <strong>Kingdom</strong> <strong>Lake</strong> <strong>Boating</strong> <strong>Capacity</strong> <strong>Study</strong> April 2006, All Rights Reserved, ©Park Studies, Inc.
Boat Count Routes 343 Results 37Introduction 37Survey Response Rates 37Descriptive Statistics for Ramp Users 38Descriptive Statistics for Marina/Dock Users 49Evidence that 2005 was a Low-Use Year 65Methods for “Head Count Data” 65Summary 684 Discussion 69Management Information Obtained 69Overall Data Summary 69Management Compartment Classification andPercent Projections Summary 70Overall Recommendations 70Specific Management Recommendations 715 Literature Cited 73Appendix A: Boater SurveyRamp User Exit InterviewAppendix B: Management Compartment Classification Maps8<strong>Possum</strong> <strong>Kingdom</strong> <strong>Lake</strong> <strong>Boating</strong> <strong>Capacity</strong> <strong>Study</strong> April 2006, All Rights Reserved, ©Park Studies, Inc.
List of Figures and TablesList of FiguresFigure 1: Collaborative Learning Model for <strong>Capacity</strong> Decisions 17Figure 2: Water-based Recreation Opportunity Spectrum 19Figure 3: Management Compartment ClassificationCriteria Matrix 20Regional map of <strong>Possum</strong> <strong>Kingdom</strong> <strong>Lake</strong>, <strong>Texas</strong> 22List of TablesTable 1: Allocation of Sampling Days for High-Use andLow-Use Boat Ramp Areas on PKL during Weekdays 25Table 2: Allocation of Sampling Days for High-Use andLow-Use Boat Ramp Areas on PKL during Weekend Days 25Table 3: The Schedule Boat Count Sessionsfor the Four Zones on PKL 26Table 4: Boat Traffic Density 30Table 5: Conflict and Density Criteria 31Table 6: Management Compartment ClassificationCriteria Matrix 32Table 7: Time Period Influence on Maps A & B 33Table 8: Management Compartment Classification 339<strong>Possum</strong> <strong>Kingdom</strong> <strong>Lake</strong> <strong>Boating</strong> <strong>Capacity</strong> <strong>Study</strong> April 2006, All Rights Reserved, ©Park Studies, Inc.
10<strong>Possum</strong> <strong>Kingdom</strong> <strong>Lake</strong> <strong>Boating</strong> <strong>Capacity</strong> <strong>Study</strong> April 2006, All Rights Reserved, ©Park Studies, Inc.
1. IntroductionThe ProblemThe rapidly increasing use experienced at many lakes in recent years has asignificant effect on the quality of water-based recreation at those locations. Increaseduse has the potential to make high-density, less "nature-oriented" experiences dominantand to reduce or eliminate the opportunity for experiences centered on the enjoyment ofsolitude, peace and quiet, and natural scenery. It has also depreciated the quality and theavailability of certain activities such as water skiing and fishing which; in order to bemore enjoyable, require few wakes and the space to participate in them. The publiclaunch ramps at <strong>Possum</strong> <strong>Kingdom</strong> <strong>Lake</strong> have seen more visitations and are oftencongested during high-use periods such as weekends and holidays. Some pressure forramp and marina expansion has been placed upon the managers at the lake.While management has received requests for additional development, they alsosuspect escalating social problems on the lake, including increasing conflicts and threatsto safety and enjoyment. Balancing these requests, while continuing to provide safe andenjoyable recreation opportunities requires providing the opportunity for a full range ofexperiences. These vary from the low-density, "get-away" type to the higher-density,more social experiences that are also popular.ObjectivesThe primary objective for the <strong>Possum</strong> <strong>Kingdom</strong> <strong>Lake</strong> study was to:Provide BRA management with a baseline by which to make futuredevelopment decisions for the lake.Secondary objectives were to:1. Describe the recreational patterns of three boater groups: public launch rampusers, marina slip renters, and private dock owners.2. Determine boaters' perceptions of present and past natural, social, andmanagerial conditions including perceptions of crowding, congestion, andconflict.3. Determine boaters' preferences for natural, social, and managerial conditions.11<strong>Possum</strong> <strong>Kingdom</strong> <strong>Lake</strong> <strong>Boating</strong> <strong>Capacity</strong> <strong>Study</strong> April 2006, All Rights Reserved, ©Park Studies, Inc.
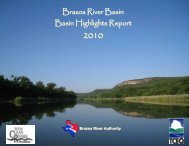
4. Quantify the amount and character of recreational boating use occurringduring the primary boating season.Recreational <strong>Boating</strong> <strong>Capacity</strong>Recreational boating capacity is a concept borrowed from other resourcemanagement specializations such as range management and wildlife management. Theconcept implies that specific land areas have certain use or production capacities that aresustainable, and that these capacities can be identified and managed for.Ideally, the determination of boating capacity would be accomplished by applyinga simple formula for calculating a manageable limit or specific number of watercraft foran entire body of water. However, given the sheer diversity of boats on the water todayand the variability of their uses, such calculations can only provide a crude estimate ofcapacity. Therefore, the concept of recreational boating capacity on rivers, lakes, andreservoirs is complex. To obtain an accurate picture, estimation of boating capacity mustinclude information about current boating conditions, and identify a desired futurecondition that is agreed upon by managers and visitors alike. Once this is accomplished,appropriate strategies can be developed to address objectives for short and long-termplanning.<strong>Boating</strong> capacity is defined by density and conflict parameters explained later inthis report under the discussion of management compartments.Hell's Gate, <strong>Possum</strong> <strong>Kingdom</strong> <strong>Lake</strong>In 1982, Washburne proposed that recreational carrying capacity beconceptualized as a set of conditions (physical-biological, social, and managerial) to bemanaged for, rather than an upper limit of visitor numbers. During the past few years,various processes - Limits of Acceptable Change (LAC), Visitor Impact Management(VIM), Carrying <strong>Capacity</strong> Assessment Process (C-CAP), and Quality Upgrading and12<strong>Possum</strong> <strong>Kingdom</strong> <strong>Lake</strong> <strong>Boating</strong> <strong>Capacity</strong> <strong>Study</strong> April 2006, All Rights Reserved, ©Park Studies, Inc.
Learning (QUAL) - have been developed to gather and integrate various kinds ofinformation for an area, and to indicate desired conditions. This study applied aspects ofthe QUAL process (Chilman 1989) because it most directly incorporates a low-costmanagerial approach with emphasis on inventory and discussion of results. In thisprocess, future desired conditions are identified in a data-gathering phase, which is basedon public input. Other procedures attempt to set management objectives prior to theconsideration of how people use the resource.Visitor capacity studies evaluate the impact proposed changes will have on users.Reporting and analysis procedures have been successfully developed at several smallerlakes (less than 3,000 acres) managed by the Corps. More recently the methodologieshave been tested at Table Rock, Beaver, and Norfolk <strong>Lake</strong>s (Titre and Vogel 1993, 1995,1996). <strong>Boating</strong> capacity data resulting from these studies have been used to evaluateproposals for additional shoreline development. This includes boat launch ramps,marinas, or private docks that, in addition to aesthetic impacts, have the added result ofpotentially increasing boat traffic density, crowding, noise, and conflicts.The Need for Management Information and EvaluationProceduresBrazos River Authority (BRA) managers are charged with the complex task ofproviding safe and enjoyable recreation opportunities while protecting the naturalresources where those recreational activities occur. This report was an opportunity towork with several agencies on a host of issues. These efforts should continue ascooperating partners address common challenges.Considerable information is provided about the conditions on <strong>Possum</strong> <strong>Kingdom</strong><strong>Lake</strong>; management tools to address those problems can be determined through discussionof the data with the public. Decisions about the best tools to use in specific places anddevelopment of defensible responses to problems should take into account the study data,public input on management options, and the authority to regulate various aspects ofboater activity and access.Value Judgments and Management InformationManagement actions inherently involve value judgments. <strong>Study</strong> data can provideinsight into decisions regarding the amount of undisturbed shoreline and other aspects ofscenic quality that should be maintained, the types of experiences to be offered, and themanagement practices to be applied. A leading researcher in outdoor recreation statedthe role value judgments play:It is evident that outdoor recreation managers must ultimately make valuejudgments about the types of opportunities to be provided...but value judgmentsshould not be arbitrary or implied. They should be an explicit and visible part of13<strong>Possum</strong> <strong>Kingdom</strong> <strong>Lake</strong> <strong>Boating</strong> <strong>Capacity</strong> <strong>Study</strong> April 2006, All Rights Reserved, ©Park Studies, Inc.
a well-documented planning process. In this way management judgments mightbe developed in a more orderly and rational way, subject to public andprofessional participation and review (Manning 1999).In order to provide for diversity and make tenable decisions about developmentrequests managers need to know boaters use <strong>Possum</strong> <strong>Kingdom</strong> <strong>Lake</strong> and what theirpreferences are regarding the natural, social, and managerial environment on the lake.Information about use patterns and users’ preferences allow managers to betterunderstand the need for specific procedures and criteria with which to evaluatedevelopment requests and address problems.Expanding Public Input and Focusing on BoatersThe current recreational management paradigm for boating capacity stronglyequates quality with diversity (Manning 1999). Recreational managers strive to provide adiversity of quality recreation experiences to satisfy public needs. Meeting this goalrequires learning about boaters’ use characteristics and preferences, and the conditionsthey perceive to be detrimental to their experience. With this information, managers canplan actions that will preserve their ability to provide diverse recreational experienceswhile alleviating user conflicts and other undesirable conditions.Visitors may evaluate how well their recreational experiences satisfied theirmotivational needs with surveys. In water-based recreation, boaters are typicallysurveyed at the end of their visit or are contacted at home with mailed surveyquestionnaires. Responses provide managers with a description of their recreationalactivity and an “evaluation” of their experience. The fundamental question behind theseefforts is: “Did the opportunities provided facilitate or hinder the attainment of thedesired experience?” (Schreyer 1987). To better understand desired experiences, thefollowing boater survey questions about perceptions of and preferences for conditions areincluded:a. Favorite and avoided locationsb. Changes noticedc. Changes desiredResponses to each survey may yield several pieces of information including:a. Desired conditions sought by different boater groupsb. Boater participation in different activitiesc. Condition changes that altered boaters’ enjoyment of the resourceIn keeping with these information needs, the primary purpose of the study was toprovide BRA management with a baseline by which to make future developmentdecisions for the lake. This was done by obtaining data from boaters on their use of thelake, their perceptions and preferences regarding the natural resource, other visitors,14<strong>Possum</strong> <strong>Kingdom</strong> <strong>Lake</strong> <strong>Boating</strong> <strong>Capacity</strong> <strong>Study</strong> April 2006, All Rights Reserved, ©Park Studies, Inc.
facilities, and management policies.Boaters’ Perceptions and PreferencesUnderstanding the recreation resource requires knowledge of what attractsrecreationists and what attributes of the setting (conditions) are essential for a highqualityexperience. Often, boaters can provide better information on resource and socialconditions (and how they are changing) than management personnel can obtain fromroutine or systematic observation. Also, studies have shown that managers and visitorsoften have very different perceptions of recreation impacts and problems (Downing andClark 1979), appropriate behaviors, and management alternatives (Hendee and Harris1970).A Five-Step Process© to Address <strong>Boating</strong> <strong>Capacity</strong>In order to provide for diversity and to make defensible decisions regardingdevelopment requests and other issues, managers need information about how boaters areusing the lake and what their preferences are regarding the natural, social, and managerialenvironment on the lake. Once the information is available on use patterns and userpreferences, managers need specific procedures and criteria to evaluate requests andaddress problems.However, this process begins with guiding concepts developed by Park Studies:a. Principlesb. Processc. Partnershipsd. Collaboratione. CriteriaPrinciplesOutdoor recreation opportunities must be accessible. This implies that the public hasaccess to forested lands and waters for natural resource based recreation regardless ofeconomic or social status, gender, age, physical or mental disability, race, color, ethnicbackground, religion, or other differences. Public agencies are obligated to provide thepublic with access provided that the other three principles are met.Outdoor recreation opportunities must be safe. A safe experience is one in whichvisitors are properly prepared and educated about their outdoor recreation environmentand the potential risks they might encounter. They are able to make well-informeddecisions and judgments about their personal safety and the safety of others. They havethe necessary skill to participate in the activity without unreasonable risk to themselves orothers. A safe recreational experience is one in which the risks and threats to visitors15<strong>Possum</strong> <strong>Kingdom</strong> <strong>Lake</strong> <strong>Boating</strong> <strong>Capacity</strong> <strong>Study</strong> April 2006, All Rights Reserved, ©Park Studies, Inc.
have been reduced to the lowest appropriate level through advance planning, facilitydesign, quality construction and maintenance, effective implementation of appropriatecontrols, and responsive adaptive management.Outdoor recreation opportunities must be sustainable. All of the recreationalopportunities provided rely on a healthy natural resource base. Without water quality,forests, wildlife, fisheries, and other natural features of reservoirs, the public would havelittle interest in boating or other types of recreation on public lands. If managers fail tomaintain or improve the health of the natural resource base, recreation opportunities willdecline rapidly. It is the responsibility of management to ensure that the publicunderstands the connection between the health of the natural resource base and thequality of their experience.Accordingly, to be sustainable, outdoor recreation opportunities and programsmust: 1) seek to avoid adverse impacts and not harm the integrity of the resourceconsistent with ecosystem and watershed management principles, 2) maintain the healthand vigor of natural resources whenever possible, 3) provide an opportunity for thevisitor to experience the natural world, and 4) include an interpretive/educationalcomponent that increases the visitor’s awareness of human dependence on the naturalworld.Outdoor recreation opportunities must be available to a diverse population. Beingavailable to a diverse population implies more than being accessible to a cross-section ofthe American public; it includes a diverse population of recreation users. Diverse ethnicactivity combinations from motorized to non-motorized and from boat to bank fishing areall legitimate uses of reservoirs. All water sport enthusiasts must be considered in themanagement of public resources. To be available to a diverse population, recreationopportunities must: 1) recognize the legitimacy of all users, 2) be equitable in ourallocation of resources and facilities, 3) promote tolerance among user groups, 4) activelyplan and manage to reduce conflicts; 5) provide opportunities for both solitude and socialexperiences, and 6) market for optimum appropriate use of available recreationalopportunities.ProcessThe five-step process in Figure 1 is a collaborative learning model allowing forfull participation of all stakeholders at various stages. Step 1: A meeting is convened toelaborate the issues among cooperating partners and to acknowledge the four principles.A neutral facilitator uses a modified Nominal Group Technique to generate issues. Thisfirst step actively engages all relevant cooperating partners in a collaborative learningexercise establishing trust and familiarity with the group process and with individualparticipants. Step 2: Information is gathered at some level of detail depending on thecomplexity of the issues to be resolved (i.e., baseline studies can employ various datacollection techniques such as rapid appraisal, 3-4 days, short-term baseline, 7-14 days,full-season baseline, 8-12 weeks). Once the data have been gathered and analyzed, the16<strong>Possum</strong> <strong>Kingdom</strong> <strong>Lake</strong> <strong>Boating</strong> <strong>Capacity</strong> <strong>Study</strong> April 2006, All Rights Reserved, ©Park Studies, Inc.
cooperating partners reconvene a meeting (Step 3), group the findings into categories,and vote on proposed actions for each.During the most recently completed studies, the following categories have surfaced onour nation’s lakes: 1) crowding and recreation conflicts, 2) personal watercraft behavior,3) the preservation of low-density and low-development areas and natural shorelines, and4) facility maintenance and improvements.Decision Phase Planning Phase Execution PhaseStep 1.Identify issueswith cooperatingpartnersStep 2.Conduct acapacity studyStep 3.Conduct acooperatingpartner workshopStep 4.Conduct twopublic workshopsStep 5.Prepare record ofdecisionIdentify serviceareasReach capacitydecisions orcontinue processIdentifyManagementcompartmentsMeet annually toevaluateperformance andassign new tasksIncorporatedensity / conflictcriteriaclassificationsData provide input fornew land managementplans or integrated withmaster plans6 to 8 Months 4 to 6 months 1 to 10 yearsPartnershipsFigure 1. Collaborative Learning Model for <strong>Capacity</strong> DecisionsPark Studies recognizes three types of stakeholders. First, there are cooperatingpartners who have some statutory responsibility for managing the resource. Second,there are organized interest group stakeholders who care about some piece of the pie suchas marinas, private docks, fishing tournaments, residential developments, andpreservation of unique resources. The general public, both users and non-users, can beviewed as a third, albeit informal stakeholder group. We have learned that while it isimportant to include all stakeholders in the decision-making process, it is best to allowthe three groups to participate at different times and within a different format.17<strong>Possum</strong> <strong>Kingdom</strong> <strong>Lake</strong> <strong>Boating</strong> <strong>Capacity</strong> <strong>Study</strong> April 2006, All Rights Reserved, ©Park Studies, Inc.
It is common for reservoirs to be managed by several resource authorities. Theshoreline, parks, fish and wildlife, and law enforcement responsibilities are typicallymanaged by agencies with different missions. This fragmented authority makes itconfusing for non-government organizations (NGOs) and “friends of the lake” to knowwhere to turn for answers to management questions. Consequently, establishingpartnerships is very important in the management of water resources. Further, it isimperative for all cooperating partners to be at the same table when issues are discussed(Step1) prior to initiating a study (Step 2).CollaborationOnce a list of proposed actions to address study findings is agreed upon, thecollaborative learning process can go before interest groups and cooperating partners(Step 4). In contrast to bringing these groups together during initial stages of the processwhen only the issues and no data are presented, we recommend that communityparticipate during the public workshop phase. While some may argue that this excludesthe public from contributing to a “desired future conditions” vision, it has been ourexperience that individual and group concerns are accommodated through carefulattention to the principles early in the process. More importantly, the test of fairness andequity as part of the evidentiary record depends on documenting all five concepts todemonstrate that a systematic and logical process has been followed.In Step 4, three posters are prepared that describe: 1) what was done, 2) what wasfound, and 3) what is proposed. The public workshop setting provides a nonconfrontationalatmosphere for discussing decisions before they are made. Cooperatingpartners are present to answer questions and clarify information. Workshops aretypically held evenings for about three hours and announced through the media. ForPKL, weekend workshops were held to better accommodate the needs of the community.The principal investigator often prepares the posters and provides answers to factual andmethodological questions. The same information is posted on agency Internet sites toallow additional stakeholders to participate in the process. Step 5: Once the publiccomments are analyzed, a final meeting is convened with cooperating partners to preparea record of decision. During this meeting, the proposed actions are reviewed in light ofthe study findings and the public comments from the workshop, Internet, and mail.CriteriaDuring the past twenty years, resource management decision-making has gonethrough three distinct phases with respect to decision-making criteria. First, managersrelied on professional judgment based on their training in forestry, wildlife, range,watershed, and recreation. This was later replaced by hiring an expert to prepare a reportin support of a decision. Today, interested parties read agency reports and often disputethe criteria. Consequently, the third phase of support for decision-making requires thatmanagers understand established criteria as sound technical evidence and that they are18<strong>Possum</strong> <strong>Kingdom</strong> <strong>Lake</strong> <strong>Boating</strong> <strong>Capacity</strong> <strong>Study</strong> April 2006, All Rights Reserved, ©Park Studies, Inc.
able to answer questions about study findings without further assistance.We have applied these criteria with different agencies. With the (Lower ColoradoRiver Authority) LCRA, a court case was averted after the opposition council reviewedour report in 1995 related to expansion in Hurst Creek Cove.We have modified the Recreation Opportunity Spectrum (ROS, Driver and Brown1978) to create one for water-based activities (WROS) on lakes and rivers. It can beviewed as a bottom-up/data-driven classification system. Preliminary WROS criteriawere developed for <strong>Lake</strong> Travis in <strong>Texas</strong> managed by LCRA (Titre, et. al., 1995, 1999;Vogel and Titre 1997). These criteria were successfully applied on Tims Ford <strong>Lake</strong> inTennessee in 2001 managed by the TVA and Carters <strong>Lake</strong> in Georgia in 2002 managedby the Corps. The criteria combine boating density and conflict data according to fourclassifications. Managers determine the compartments prior to classification.Additionally, the four classes correspond well to the traditional ROS classes. Densitydata are gathered by recording boat types and their locations. Conflict data are gatheredby showing boaters a map of the lake and asking them to identify avoided and unsafelocations. This results in a map that portrays existing boating conditions. Eachdensity/conflict class is characterized by unique physical, social, managerial settings, andrecreation experiences. These criteria provide documented evidence of boatingconditions, as a basis for preparing management objectives, and place-specificinformation for addressing proposed developments.ROS CLASS Urban RuralDevelopedDENSITY /CONFLICTCLASSMANAGEMENTOBJECTIVESIHigh Density,High ConflictNo NewDevelopmentRuralNaturalIIModerate Density,Moderate ConflictModerateDevelopmentSemiprimitiveMotorizedIIIHigh Density,Low ConflictPartial Retention ofShorelineSemiprimitiveNon-MotorizedPrimitiveIVLow Density,Low ConflictShorelinePreservationFigure 2. Water-based Recreation Opportunity Spectrum19<strong>Possum</strong> <strong>Kingdom</strong> <strong>Lake</strong> <strong>Boating</strong> <strong>Capacity</strong> <strong>Study</strong> April 2006, All Rights Reserved, ©Park Studies, Inc.
BOATINCIDENCE OF CONFLICTSDENSITY USE LEVELHIGH MODERATE LOW(Acres/Boat)(> 12.1%) (12.0 – 6.1%) (< 6.0%)< 10.0 Very High I I III10.1 – 15.0 High I I II III15.1 – 20.0 Moderate I II II20.1 – 25.0 Low II II IV> 25.0 Very Low II II IVFigure 3. Management Compartment Classification Criteria MatrixWhile capacity decision-making will remain complex, adherence to theseconcepts will improve the likelihood that capacity decisions will be defensible and notarbitrary. To wait until the capacity situation is out of control on our waters is too late fortaking advantage of these concepts. Indeed, Brown (2001) revealed that the mostimportant recommendation from managers involved in capacity situations was that theyact in a proactive manner. Finally, while citizen groups voice concern for protection ofwilderness, parks, and wildlife refuges; lakes and reservoirs are often overlooked asplaces for solitude and the protection of resource integrity. These places provideexcellent nature-based opportunities for escape from the pressures of modern living for amajority of the American public. The continued application and refinement of theseconcepts can contribute significantly to improved utilization of our nation’s waterresource heritage.20<strong>Possum</strong> <strong>Kingdom</strong> <strong>Lake</strong> <strong>Boating</strong> <strong>Capacity</strong> <strong>Study</strong> April 2006, All Rights Reserved, ©Park Studies, Inc.
2. MethodsIntroductionBRA managers need an established procedure to use for gathering data on theamount and characteristics of boating use, as well as on the perceptions and preferencesof boaters for the conditions they encounter during their boating. This section of thereport discusses the methods used to collect data for the 2005 boater study on <strong>Possum</strong><strong>Kingdom</strong> <strong>Lake</strong>. First, the inventory and sampling methods are presented that were usedfor the boater survey component of the study. This is followed by description of the onthe-waterboat count procedures. This section is concluded with a discussion of thesurvey instrument. These procedures have been developed during similar studies atCorps and TVA lakes.The approach to information collection and analysis that was followed in this andpreceding carrying capacity studies at Corps lakes stresses detailed inventory of theresource and its use. Data collection for this study included exit interviews with boatersusing public launch ramps, mail-back surveys of boaters renting marina slips, privatedock owners, and counts of boats on the water. The exit interviews and mail surveysfocused on gathering information on use patterns, and on the perceptions and preferencesof boaters using <strong>Possum</strong> <strong>Kingdom</strong> <strong>Lake</strong>. The boat counts provide additional informationabout boat distribution. Numerous texts elaborate survey research procedures; however,we prefer the basic reference by Fowler (1993).Reconnaissance and inventory of the study area, and preliminary planningpreceded the data collection. <strong>Study</strong> methodologies are provided below to explain theconcepts and rationale behind implementation of this lake study.This study is a part of a national research program directed by Park Studies.Included in this study are boater exit surveys conducted at boat ramps from May 28,through August 15, 2005. These lake users were asked questions about their perceptionsof the conditions on the lake, what is important to them in their recreational settings, andchanges that may be occurring. Boat counts were also used as a way to determine thelocation and type of boats.<strong>Study</strong> Area<strong>Possum</strong> <strong>Kingdom</strong> is located in Palo Pinto County, <strong>Texas</strong>. The lake providesvisitors with a variety of recreational opportunities including fishing, boating, waterskiing,and swimming. It has some 4,000 boat slips.21<strong>Possum</strong> <strong>Kingdom</strong> <strong>Lake</strong> <strong>Boating</strong> <strong>Capacity</strong> <strong>Study</strong> April 2006, All Rights Reserved, ©Park Studies, Inc.
Location of <strong>Possum</strong> <strong>Kingdom</strong> <strong>Lake</strong>Sample PopulationsThe population for the study consisted of boaters using <strong>Possum</strong> <strong>Kingdom</strong> <strong>Lake</strong>.For the purpose of sampling, the boaters were separated into three survey groups asdetermined by their mode of access to the lake; public launch ramp users and marina sliprenters/dock owners.Inventory of Boater Access PointsAn inventory of all public launch ramps and marinas was completed prior tosurvey collection as the first step towards establishing a sampling plan. Public launchramps were located and categorized based on information contained in project records,maps and field checks conducted from the land and water.Sampling MethodsRamp Users. A total of 8 launch ramps were identified during the surveyplanning inventory. High-use ramps were: South D & D, Public Boat Ramp, State Park,and Scenic Cove. Low-use ramps were: North D & D, West Side Park, Bug Beach, andSandy BeachTo ensure representation of the entire range of boaters using the public ramps, a stratified22<strong>Possum</strong> <strong>Kingdom</strong> <strong>Lake</strong> <strong>Boating</strong> <strong>Capacity</strong> <strong>Study</strong> April 2006, All Rights Reserved, ©Park Studies, Inc.
andom sampling procedure, with boat ramp interview sites split into "high use" and "lowuse" stratum, was used in scheduling the exit interview periods. This stratification allowsfor the possibility that boaters using the two larger public ramps would differ from thoseusing the smaller ramps. The larger "high use" ramps serve more boaters than the smallerramps and the smaller "low use" ramps are only suitable for launching smaller boats. Theramps placed in the "high use" stratum were mentioned above. The four ramps placed inthe "low use" stratum are North D & D, West Side Park, Bug Beach, and Sandy Beach.Brazos River Authority <strong>Lake</strong> RangerMarina Boaters. There are 13 marinas on <strong>Possum</strong> <strong>Kingdom</strong> <strong>Lake</strong>. Theoperators provided mailing lists with the names and addresses of current slip renters foruse during the mail-back survey.Private Dock Owners. Since there are approximately 1500 docks on <strong>Possum</strong><strong>Kingdom</strong> <strong>Lake</strong> it was necessary to systematically select every 4th address to obtain asample of 400.The two different methods used to contact the members of the three boater groupswho together comprise the study population required different sampling methods. Thepublic ramp users were contacted during randomly selected exit interview periods.Exit Interview Schedule. To increase the probability of obtaining an adequatesample of ramp users, exit interview periods were scheduled on all available weekenddays, and an equal number of weekdays. The weekdays on which interviews would beconducted at ramps were selected by numbering the weekdays available during the datacollection period of May 28 to August 15. A random number table was then used toselect the weekdays on which interview periods would be scheduled. The selectedweekend and weekday interview days were then randomly divided into two groups,which would have "morning" interview periods (9:00 a.m. to 11:00 a.m.) and "afternoon"interview periods (4:00 p.m. to 7:00 p.m.). Finally, individual ramps were randomlyassigned to each interview period with half the periods allocated to "high" use ramps and23<strong>Possum</strong> <strong>Kingdom</strong> <strong>Lake</strong> <strong>Boating</strong> <strong>Capacity</strong> <strong>Study</strong> April 2006, All Rights Reserved, ©Park Studies, Inc.
half allocated to "low use" ramps.Sampling Limitations1. No public boat ramp could be sampled more than five times during the twelveweek period.2. All public boat ramps must have at least one on-site interview conducted at thesite.3. All weekdays and weekend days were treated equally for sampling purposes.4. On-site interviews were conducted for all weekdays and weekend days.Boater SurveyThe boater survey portion of the study was conducted from May 28 to August 15,2005. The survey was designed to allow information to be gathered from all boatersusing the lake including those who trailer their boat to public launch ramps, those whohave a boat moored at a marina slip, and those who own a private dock.Boaters using public launch ramps were interviewed after they had removed theirboat from the water at public launch ramps. Marina slip renters and dock owners werecontacted through mail-back survey questionnaires. Exit interviews and mail surveyswere conducted by PSI employees who underwent interviewer training prior to the startof data collection. Sampling and data collection was coordinated from PSI.<strong>Study</strong> MethodsThree sources of boaters were targeted for soliciting survey responses thatincluded: 1) on-site exit interviews with those removing their boats from public boatramps on PKL; 2) a random mail survey of slip owners drawn from the 13 marinas; and3) a random mail survey drawn from marina slip renters and private dock owners whohave access to the lake. In order to provide more accurate boating estimates on <strong>Possum</strong><strong>Kingdom</strong> <strong>Lake</strong>, actual physical boat counts were systematically conducted during thecourse of the study. The ramp survey was conducted during a 12-week period fromSaturday May 28, 2005 to Sunday August 15, 2005.Based on key cooperating partner recommendations, four of the eight public boatramps were labeled as high-use boat ramp areas, and four were labeled as low-use boatramp areas. The sampling strategy involved drawing 75 percent of the on-site exitinterviews from the high-use boat ramp areas, and 25 percent from the low-use boat rampareas. In addition, 40 percent of the on-site exit interviews were scheduled for themorning and 60 percent were scheduled for the evening.Overall, there were 23 weekdays and all 24 weekend days scheduled for on-site24<strong>Possum</strong> <strong>Kingdom</strong> <strong>Lake</strong> <strong>Boating</strong> <strong>Capacity</strong> <strong>Study</strong> April 2006, All Rights Reserved, ©Park Studies, Inc.
oat ramp sampling over the 12-week period in addition to July 3. Two weekdays perweek were sampled. This is consistent with previous studies (Titre et. al, 1995, 1996). Arandom numbers table was used to determine which boat ramps and weekdays toschedule for the on-site exit interviews. A coin toss was initially used to determinewhether the first boat ramp selected was going to be sampled during the morning hours(heads) or during the evening hours (tails). Afterwards, the time of day alternated foreach boat ramp selected. This resulted in the four high-use boat ramp areas being selectedfor on-site exit interviews between three to five times over the duration of the study; andone to two times for the four low-use boat ramp areas shown below. These samplingpercentages were used for both weekdays and weekend days.Table 1: Allocation of Sampling Days for High-Use and Low-Use Boat Ramp Areason PKL during WeekdaysHigh-Use BoatRamp AreasNumber ofSampling DaysLow-Use BoatRamp AreasNumber ofSampling DaysSouth D & D 3 North D & D 1Public Boat Ramp 5 West Side Park 2State Park 5 Bug Beach 1Scenic Cove 5 Sandy Beach 1Table 2: Allocation of Sampling Days for High-Use and Low-Use Boat Ramp Areason PKL during Weekend DaysHigh-Use BoatRamp AreasNumber ofSampling DaysLow-Use BoatRamp AreasNumber ofSampling DaysSouth D & D 3 North D & D 1Public Boat Ramp 5 West Side Park 2State Park 5 Bug Beach 1Scenic Cove 5 Sandy Beach 2Boat Count MethodsBoat counts were collected in each of the four lake zones that were identified bykey PKL cooperating partners. The boat counts were scheduled during peak afternoonperiods from 4:00-6:00 p.m. for weekdays and 4:30- 6:30 p.m. for weekend days.Saturday and Sunday are considered weekend days. These time periods are considered apeak period when most boats are on the water. This sampling scheme resulted in a totalof 16 boat count days, with each of the lake zones being counted twice during theweekdays and twice during the weekend days (Table 3). This is standard for obtainingboat count data (Titre & Vogel 1993). The boat counts were administered by a boatoperator and a recorder, who recorded the type of vessels operating in each zoneconducted during a two-hour time frame. The boat counts were conducted on days whenthe weather conditions were favorable. As such, boat counts represent a typical day andnot a random sample day. If weather conditions are poor, boat counts can be rescheduled25<strong>Possum</strong> <strong>Kingdom</strong> <strong>Lake</strong> <strong>Boating</strong> <strong>Capacity</strong> <strong>Study</strong> April 2006, All Rights Reserved, ©Park Studies, Inc.
to a day when “normal” weather is available 2 .Table 3: The Schedule Boat Count Sessions for the Four Zones on PKLZone Weekdays Zone Weekend DaysOne June 9 One June 5One July 8 One July 10One June 9 Hells Gate June 5One June 16 Hells Gate July 10Two July 29 Two June 18Two July 13 Two August 6Three July 15 Three July 9Three August 9 Three July 9Four July 15 Four June 12Four July 22 Four August 7On-Site Survey MethodsThe questionnaires for both the on-site boat ramp exit interviews and the mailbacksurveys to marina slip renters and private dock owners contained the same set ofquestions. The questionnaire consisted of typical demographic items, experience usehistory items, safety-related items, and items related to the place attachment concept(Appendix A). For the on-site exit interviews, a trained staff member approached everygroup who was removing their boat from the lake. The staff member introducedhimself/herself, explained the purpose of the study, and solicited one person to participatein a face-to-face interview. The interview was administered individually and not to thegroup. When finished, the interviewer thanked the boater for his/her time andcooperation. Refusals were recorded. They represented less than 5% of all face-to-faceinterviews. Refusals were due to time or bad weather. In contrast, most boatersappreciated the opportunity to talk about their experience.Although every exiting boater group was desired, if two groups were exiting atthe same time, a coin was tossed to determine which group to approach. For three ormore groups, it was decided to select the n th group based on the number of groupsexiting. This was done so that there was no potential bias of selecting who wasinterviewed for the survey questions.2 The exception here includes data gathered on July 3 based on evidence that 2005 was a low use season.26<strong>Possum</strong> <strong>Kingdom</strong> <strong>Lake</strong> <strong>Boating</strong> <strong>Capacity</strong> <strong>Study</strong> April 2006, All Rights Reserved, ©Park Studies, Inc.
Mail-back Survey MethodsMailed surveys were sent to a sample of marina slip and private dock ownersusing an approach pioneered by Dillman (1978). Questionnaires were mailed to marinaslip renters and private dock owners during mid-summer allowing them to respond to thesurvey having had recent experience with boating conditions on the lake. This entailedmailing an initial packet of material that consisted of a cover letter explaining the purposeof the study, the questionnaire, and a self-addressed stamped envelope. After two weeks,a reminder postcard was sent to those sampled in order to solicit greater response; andafter two more weeks an entire package was again sent to those who had yet to respond.The Survey InstrumentOne area of emphasis during the carrying capacity studies conducted has been thedevelopment of explicit procedures to inventory existing conditions. An important aspectof this has been the development of a short set of questions to ask visitors about theirperceptions of "quality" conditions on the area. This set of questions has been used atseveral areas supporting land-based and river-based recreation and were used duringprevious pilot tests at several other lakes.Information is obtained about visitor and visit characteristics, how the study areacompares to other similar areas in the region, visitors perceptions and preferences for uselevels and perceptions of conflicts, and changes occurring.27<strong>Possum</strong> <strong>Kingdom</strong> <strong>Lake</strong> <strong>Boating</strong> <strong>Capacity</strong> <strong>Study</strong> April 2006, All Rights Reserved, ©Park Studies, Inc.
Boater Survey QuestionsI. Visit Characteristics• Length of experience• Distance traveled• Frequency of visits• Length of present visit (ramp users)• Type(s) of watercraft used• Activities participated in• Portion of recreation day devoted to specific activitiesII. Spatial Use Characteristics• Location where activities were participated in• Characteristics and location of favorite places• Characteristics and location of avoided areasIII. Comparison to Other Areas• Alternative boating locations• Reasons for choosingIV. Changes Occurring and Desired• Changes noted and effects of those changes• Changes desiredV. Perceptions of Use Levels and Conflicts• Number of boats expected to see while boating• Number of boats preferred to see while boating• Problems/conflicts with other boatersVI. Additional Comments• General comments, suggestions, continuation of responses to open-endedquestions, or comments on issues not coveredData AnalysisAll survey data were entered into Statistical Program for the Social Sciences(SPSS TM ), a statistical software package for analysis. The boat count data from the mapswere stored and graphically displayed using Arc Info9 software. Statistical analysistechniques were used to summarize all boater responses.28<strong>Possum</strong> <strong>Kingdom</strong> <strong>Lake</strong> <strong>Boating</strong> <strong>Capacity</strong> <strong>Study</strong> April 2006, All Rights Reserved, ©Park Studies, Inc.
Management Compartments DefinedManagement compartments are based on an understanding of resource,management, and social conditions. During the first cooperating partner workshop, thePSI facilitator directed a session explaining the need to segment the map of the lake intological compartments based on the three conditions mentioned.Resource conditions include:a. Bends in the lakeb. Natural covesc. Physical structures such a bridgesd. Submerged tree stumpse. Differences in water depthf. Wide and narrow expanses of waterg. Prevailing winds or other weather conditionsManagement conditions address boater safety and environmental sustainability toinclude:a. The abundance and scarcity of unique resources that may need protectionb. Knowledge of supply and demand factorsc. Hazardous areasd. Concentrations of development such as restaurants, marinas, private dockse. Distance from <strong>Lake</strong> Ranger patrol functions or sub-stationsf. Other management influences such as the Game and Fish personnel availableto assist with education and enforcementg. The ability to apply “light-handed” options such as educationh. The ability to apply “heavy-handed” options through law enforcementSocial conditions address the boating opportunity provided to include:a. The amount and type watercraftb. Traditional use patternsc. Emerging trendsd. Cultural significance of certain locationse. Regional opportunities that are the same or differentThe collective understanding of the above conditions allowed the cooperating partners todraw management compartments. This allowed the formation of management strategiesdesigned to maintain the desired condition for specific recreational experiences in a givenarea.29<strong>Possum</strong> <strong>Kingdom</strong> <strong>Lake</strong> <strong>Boating</strong> <strong>Capacity</strong> <strong>Study</strong> April 2006, All Rights Reserved, ©Park Studies, Inc.
Classification of Management CompartmentsClassifying the lake into categories for the purpose of directing future desiredconditions is accomplished by combining two sources of information. These sources areboat density and “conflict” data (areas of the lake that are considered unsafe or avoided).Boat Traffic Density. Boat density data are gathered by recording allboats on the water during peak use periods on weekdays and on weekend days. The lakeis divided into boat count zones that permit the recording on-the-water boats within atwo-hour time period. Recorders also note the type of craft according to a predeterminedcheck sheet and a map.Park Studies developed a boat traffic density table based on 30 boating capacitystudies as a guideline to compute acres per boat. A condition where acres per boat areless than 10 is considered a threat to safety and enjoyment (Table 4)..Table 4: Boat Traffic DensityUse Level DensityVery High < 10.0 acres/boatHigh10.0 – 15.0 acres/boatModerate 15.1 – 20.0 acres/boatLow20.1 – 25.0 acres/boatVery Low > 25.0 acres/boatIncidence of Conflict and Boater DensityThis information is gathered by showing boaters a map of the lake and askingthem to identify avoided and unsafe locations. Three categories of conflict weredetermined based on percentages: high > 12%, moderate 6 – 12%, and low < 6%.Boater density is the amount of surface water available for each boat. Thisinformation is derived from the boat count data. Boater density data are the best meansof comparing use levels between times of high and low usage as well as over severalyears. In addition, density strongly correlates with boater conflicts. As boater densityincreases, so does the percent of conflicted areas within a management compartment.Boater conflict is defined as the number of avoided and unsafe locations within amanagement compartment divided by the total number of avoided and unsafe locationson the lake. An area with fewer than 6% of the total conflicts for a body of water is“low” on the conflict scale while an area with more than 12% of conflicts for a body ofwater is “high” on the conflict scale. Ten acres per boat is the density figure used by lakeand reservoir managers as a threshold beyond which a body of water is “high” on the30<strong>Possum</strong> <strong>Kingdom</strong> <strong>Lake</strong> <strong>Boating</strong> <strong>Capacity</strong> <strong>Study</strong> April 2006, All Rights Reserved, ©Park Studies, Inc.
conflict scale and considered “overcrowded”. The matrix below characterizes use levelcategories and conflict criteria on the basis of boater density.Conflict Scale(# of avoided and unsafelocations within acompartment/total avoided andunsafe locations on lake)Table 5: Conflict and Density CriteriaDensity Criteria Use Level Category(Surface water/boat)>25 acres Very Low12.0% High 10-15 acres High
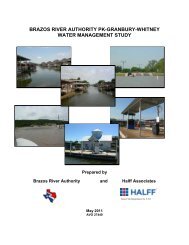
Fig. 2 – Example Boat count – <strong>Possum</strong> <strong>Kingdom</strong> <strong>Lake</strong>, July 10, 2005After the number of boatsper management compartment wasfound, they were divided into theacres to find acres per boat.Density levels were reached byusing this chart.Table 6: Management CompartmentClassificationCriteria MatrixIncidence of ConflictUse LevelHigh Moderate LowVery High I I IIIHigh I I II IIIModerate I II IILow II II IVVery Low II II IVTo find the finalclassification for each managementcompartment, density levels andconflict levels were looked at incombination. Classifications were based on the matrix (Table 6).32<strong>Possum</strong> <strong>Kingdom</strong> <strong>Lake</strong> <strong>Boating</strong> <strong>Capacity</strong> <strong>Study</strong> April 2006, All Rights Reserved, ©Park Studies, Inc.
ManagementTable 7: Time Period Influence on Maps A & Bcompartment density wasTime PeriodWeighted Influencefound in two ways. Map AMap A Map Buses only data fromWeekdays (2 days) 33.3% 25%scheduled counts (excludes(12.5%x2days)July 3) with a 66.7% weightfor weekends and 33.3% forWeekends (2 days) 66.7% 50%weekdays (Table 7). Map B(25%x2days)includes data from July 3. July 3 0 25%Each weekend day contributed 25% for a weighted influence of 50%. Each weekdaycontributed 12.5% for a weighted influence of 25%. July 3 counted for 25% and onlycontributed to Map B. Map B is shown here as the recommended map for PKL whileMap A is provided in Appendix B.To find the final classification for each management compartment, density levelsand conflict levels were examined in combination. After classifications were found,maps were developed for the lake, for each scenario (Maps A and B), including mapsbased on projected increases in density (20%, 40%, 60%, 80%, and 100%) for the lake.Class IClass IIClass IIIClass IVTable 8: Management Compartment ClassificationExisting <strong>Boating</strong>ConditionsModerate to very high boat trafficdensity at peak use times and highto very high incidence of conflictModerate to high boat trafficdensity at peak use times andmoderate to very low incidence ofconflictHigh to very high boat trafficdensity at peak use times but lowincidence of conflictLow or very low boat trafficdensity, even at peak usetimes, and low incidence ofconflictManagement ObjectivesNo new development is recommended sinceit may worsen the conditions for safety andenjoyment. Greater law enforcement,boating patrol, and education are necessary.Consideration of new development ispossible in combination with managementand resource factors.Since conditions are often characterized bystationary boats located in sheltered “escapecoves” it is important to protect theseopportunities and no development isrecommended.No development is recommended toprotect low density/low conflict orpristine experiences on the water.33<strong>Possum</strong> <strong>Kingdom</strong> <strong>Lake</strong> <strong>Boating</strong> <strong>Capacity</strong> <strong>Study</strong> April 2006, All Rights Reserved, ©Park Studies, Inc.
On-The-Water Boat CountsAs an alternative to costly andweather-limited aerial photography as ameans of measuring boating activity,boat counts were conducted from a boattraveling the length of the study area.The scheduling of boat counts on<strong>Possum</strong> <strong>Kingdom</strong> <strong>Lake</strong> was done tomeet the standard for this procedure.Boat Count RoutesThe count boat was operated by a <strong>Lake</strong> Ranger while the recorder marked thelocation of boats on the lake on a map. In addition to location, boat type was noted foreach observed boat.The count boat went into coves only as far as necessary to see all the boatspresent. Field glasses were used to see distant boats. An effort was made to progressdown the lake as fast as possible, while still allowing the necessary observations to be34<strong>Possum</strong> <strong>Kingdom</strong> <strong>Lake</strong> <strong>Boating</strong> <strong>Capacity</strong> <strong>Study</strong> April 2006, All Rights Reserved, ©Park Studies, Inc.
made in order to minimize the number of double counts. Occasionally, the boat countprogress down the lake was interrupted by the <strong>Lake</strong> Ranger’s need to respond to somelaw enforcement problem.The total number of boats observed during each count and numbers of watercraftof different types were tallied later from the maps. The count data from the maps weretransferred to Microsoft Excel software.35<strong>Possum</strong> <strong>Kingdom</strong> <strong>Lake</strong> <strong>Boating</strong> <strong>Capacity</strong> <strong>Study</strong> April 2006, All Rights Reserved, ©Park Studies, Inc.
36<strong>Possum</strong> <strong>Kingdom</strong> <strong>Lake</strong> <strong>Boating</strong> <strong>Capacity</strong> <strong>Study</strong> April 2006, All Rights Reserved, ©Park Studies, Inc.
3. ResultsIntroductionThis section of the report presents the results of both boater surveys. A widevariety of baseline information about the boaters utilizing the lake was obtained throughthese efforts. Though a nearly inexhaustible series of analyses can be done on the surveydata, we have chosen to present this information in the form of frequencies, averages, andgrouped responses. We believe this allows for the most immediate and accessiblepresentation of information and is sufficient to expand understanding of currentconditions. The data collected in this survey provide a baseline of information fromwhich to draw conclusions about current conditions, and compare future changes.Subsequent monitoring, using similar survey methods, would allow for tracking of trendsin use patterns and perceptions of conditions.Each of these pieces of information helps describe and differentiate the variousboater populations that use the lake. The reason for collecting each type of informationand its potential usefulness to lake managers is described prior to the discussion of surveydata. The intent is to "paint a picture" of the boater populations on the lake and facilitateunderstanding of their make-up and activity.The boater survey results are presented after a discussion of survey response rates.Presented first are the descriptive data that explain who the boaters are on the lake interms of length of boaters’ experience, frequency of use, boat size, and activitiesparticipated in on the lake. The second part presents boaters’ perceptions about thequality of their recreational experience, location preferences, safety and crowding issues,and preferences regarding natural resource, social, and managerial conditions.Survey Response RatesMail-back Surveys. A total of 143 ramp user surveys were administered at public boatramps. 800 surveys were mailed to a sample of marina slip renters and private dockowners. There were 702 valid surveys and 61% (427) were returned. The total samplesize was 570 boaters. Addresses were re-checked for accuracy on all undeliveredquestionnaires. Response rates should achieve close to 50% as a requirement for soundscience.37<strong>Possum</strong> <strong>Kingdom</strong> <strong>Lake</strong> <strong>Boating</strong> <strong>Capacity</strong> <strong>Study</strong> April 2006, All Rights Reserved, ©Park Studies, Inc.
Descriptive Statistics for Ramp UsersFor these tables, the information is presented as a summary following the section.Missing refers to questions that the respondent did not answer on the survey therebyreducing the valid sample size for the purpose of analysis.PKL Ramp BoatersYear <strong>Boating</strong> PKLNumber of WeekendDays <strong>Boating</strong> Last YearNumber of Week Days<strong>Boating</strong> Last YearFeetHPValid NN Minimum Maximum Mean Std. Deviation138 .0 44.0 10.319 10.1989136 0 52 9.33 9.888134 0 260 6.43 23.371143 7.00 42.00 19.2434 4.73437143 18 550 199.17 108.899132Male or FemaleValidCumulativeFrequency Percent Valid Percent PercentMale 103 70.5 83.1 83.1Female 21 14.4 16.9 100.0Total 124 84.9 100.0Missing System 22 15.1Total 146 100.0Ever Boated PKLValidCumulativeFrequency Percent Valid Percent PercentNo 17 11.6 11.8 11.8Yes 127 87.0 88.2 100.0Total 144 98.6 100.0Missing System 2 1.4Total 146 100.038<strong>Possum</strong> <strong>Kingdom</strong> <strong>Lake</strong> <strong>Boating</strong> <strong>Capacity</strong> <strong>Study</strong> April 2006, All Rights Reserved, ©Park Studies, Inc.
Size of Party TodayValidCumulativeFrequency Percent Valid Percent Percent1 8 5.5 5.6 5.62 20 13.7 13.9 19.43 27 18.5 18.8 38.24 25 17.1 17.4 55.65 19 13.0 13.2 68.86 22 15.1 15.3 84.07 3 2.1 2.1 86.18 9 6.2 6.3 92.49 3 2.1 2.1 94.410 2 1.4 1.4 95.811 3 2.1 2.1 97.915 1 .7 .7 98.620 1 .7 .7 99.325 1 .7 .7 100.0Total 144 98.6 100.0Missing System 2 1.4Total 146 100.0Number of Days for This VisitValidCumulativeFrequency Percent Valid Percent Percent1 72 49.3 51.4 51.42 21 14.4 15.0 66.43 27 18.5 19.3 85.74 10 6.8 7.1 92.95 6 4.1 4.3 97.17 1 .7 .7 97.98 2 1.4 1.4 99.310 1 .7 .7 100.0Total 140 95.9 100.0Missing System 6 4.1Total 146 100.039<strong>Possum</strong> <strong>Kingdom</strong> <strong>Lake</strong> <strong>Boating</strong> <strong>Capacity</strong> <strong>Study</strong> April 2006, All Rights Reserved, ©Park Studies, Inc.
Runabout/Speedboat/SkiboatValidCumulativeFrequency Percent Valid Percent PercentNo 71 48.6 49.3 49.3Yes 73 50.0 50.7 100.0Total 144 98.6 100.0Missing System 2 1.4Total 146 100.0Percent Time FishingValidCumulativeFrequency Percent Valid Percent Percent0 138 94.5 95.8 95.810 1 .7 .7 96.515 1 .7 .7 97.220 1 .7 .7 97.933 1 .7 .7 98.675 1 .7 .7 99.3100 1 .7 .7 100.0Total 144 98.6 100.0Missing System 2 1.4Total 146 100.040<strong>Possum</strong> <strong>Kingdom</strong> <strong>Lake</strong> <strong>Boating</strong> <strong>Capacity</strong> <strong>Study</strong> April 2006, All Rights Reserved, ©Park Studies, Inc.
Percent Time CruisingValidCumulativeFrequency Percent Valid Percent Percent0 25 17.1 17.4 17.420 4 2.7 2.8 20.125 11 7.5 7.6 27.830 2 1.4 1.4 29.233 3 2.1 2.1 31.334 1 .7 .7 31.940 13 8.9 9.0 41.045 1 .7 .7 41.750 49 33.6 34.0 75.760 3 2.1 2.1 77.870 1 .7 .7 78.575 5 3.4 3.5 81.980 2 1.4 1.4 83.390 1 .7 .7 84.0100 23 15.8 16.0 100.0Total 144 98.6 100.0Missing System 2 1.4Total 146 100.041<strong>Possum</strong> <strong>Kingdom</strong> <strong>Lake</strong> <strong>Boating</strong> <strong>Capacity</strong> <strong>Study</strong> April 2006, All Rights Reserved, ©Park Studies, Inc.
Percent Time Water-SkiingValidCumulativeFrequency Percent Valid Percent Percent0 64 43.8 44.4 44.45 1 .7 .7 45.120 2 1.4 1.4 46.525 10 6.8 6.9 53.530 3 2.1 2.1 55.633 1 .7 .7 56.340 8 5.5 5.6 61.850 41 28.1 28.5 90.360 3 2.1 2.1 92.470 1 .7 .7 93.175 2 1.4 1.4 94.480 1 .7 .7 95.1100 7 4.8 4.9 100.0Total 144 98.6 100.0Missing System 2 1.4Total 146 100.0Percent Time Personal WatercraftValidCumulativeFrequency Percent Valid Percent Percent0 131 89.7 91.6 91.650 1 .7 .7 92.370 1 .7 .7 93.0100 10 6.8 7.0 100.0Total 143 97.9 100.0Missing System 3 2.1Total 146 100.042<strong>Possum</strong> <strong>Kingdom</strong> <strong>Lake</strong> <strong>Boating</strong> <strong>Capacity</strong> <strong>Study</strong> April 2006, All Rights Reserved, ©Park Studies, Inc.
Percent Time SwimmingValidCumulativeFrequency Percent Valid Percent Percent0 104 71.2 72.2 72.220 7 4.8 4.9 77.125 12 8.2 8.3 85.430 1 .7 .7 86.133 3 2.1 2.1 88.234 1 .7 .7 88.940 6 4.1 4.2 93.150 4 2.7 2.8 95.860 2 1.4 1.4 97.275 1 .7 .7 97.9100 3 2.1 2.1 100.0Total 144 98.6 100.0Missing System 2 1.4Total 146 100.0Percent Time RelaxingValidCumulativeFrequency Percent Valid Percent Percent0 129 88.4 89.6 89.61 1 .7 .7 90.310 1 .7 .7 91.020 1 .7 .7 91.725 6 4.1 4.2 95.830 1 .7 .7 96.533 1 .7 .7 97.234 1 .7 .7 97.960 2 1.4 1.4 99.375 1 .7 .7 100.0Total 144 98.6 100.0Missing System 2 1.4Total 146 100.043<strong>Possum</strong> <strong>Kingdom</strong> <strong>Lake</strong> <strong>Boating</strong> <strong>Capacity</strong> <strong>Study</strong> April 2006, All Rights Reserved, ©Park Studies, Inc.
Percent Time Other ActivityValidCumulativeFrequency Percent Valid Percent Percent0 141 96.6 97.9 97.910 1 .7 .7 98.6100 2 1.4 1.4 100.0Total 144 98.6 100.0Missing System 2 1.4Total 146 100.0Favorite LocationValidCumulativeFrequency Percent Valid Percent PercentNo 38 26.0 26.6 26.6Yes 105 71.9 73.4 100.0Total 143 97.9 100.0Missing System 3 2.1Total 146 100.0Any Place You Deliberately AvoidValidCumulativeFrequency Percent Valid Percent Percent0 93 63.7 66.0 66.01 48 32.9 34.0 100.0Total 141 96.6 100.0Missing System 5 3.4Total 146 100.044<strong>Possum</strong> <strong>Kingdom</strong> <strong>Lake</strong> <strong>Boating</strong> <strong>Capacity</strong> <strong>Study</strong> April 2006, All Rights Reserved, ©Park Studies, Inc.
Any Place You Feel Unsafe On Water?ValidCumulativeFrequency Percent Valid Percent PercentNo 122 83.6 85.9 85.9Yes 20 13.7 14.1 100.0Total 142 97.3 100.0Missing System 4 2.7Total 146 100.0Feel Safe at Boat RampValidFrequency Percent Valid PercentCumulativePercentNot at allSafe1 .7 .7 .7SomewhatSafe2 1.4 1.4 2.1ModeratelySafe30 20.5 21.0 23.1ExtremelySafe110 75.3 76.9 100.0Total 143 97.9 100.0Missing System 3 2.1Total 146 100.0Feel Safe on WaterValidFrequency Percent Valid PercentCumulativePercentNot at allSafe1 .7 .7 .7SomewhatSafe5 3.4 3.5 4.2ModeratelySafe40 27.4 28.0 32.2ExtremelySafe97 66.4 67.8 100.0Total 143 97.9 100.0Missing System 3 2.1Total 146 100.045<strong>Possum</strong> <strong>Kingdom</strong> <strong>Lake</strong> <strong>Boating</strong> <strong>Capacity</strong> <strong>Study</strong> April 2006, All Rights Reserved, ©Park Studies, Inc.
Crowded at Boat RampValidFrequency Percent Valid PercentCumulativePercentNot at allCrowded102 69.9 71.3 71.3SomewhatCrowded25 17.1 17.5 88.8ModeratelyCrowded11 7.5 7.7 96.5ExtremelyCrowded5 3.4 3.5 100.0Total 143 97.9 100.0Missing System 3 2.1Total 146 100.0Crowded on WaterValidFrequency Percent Valid PercentCumulativePercentNot at allCrowded96 65.8 67.1 67.1SomewhatCrowded28 19.2 19.6 86.7ModeratelyCrowded11 7.5 7.7 94.4ExtremelyCrowded8 5.5 5.6 100.0Total 143 97.9 100.0Missing System 3 2.1Total 146 100.046<strong>Possum</strong> <strong>Kingdom</strong> <strong>Lake</strong> <strong>Boating</strong> <strong>Capacity</strong> <strong>Study</strong> April 2006, All Rights Reserved, ©Park Studies, Inc.
Adequate number of Boat RampsValidFrequency Percent Valid PercentCumulativePercentToo Many 1 .7 .7 .7AboutRight132 90.4 92.3 93.0Need More 10 6.8 7.0 100.0Total 143 97.9 100.0Missing System 3 2.1Total 146 100.0Adequate Number of Parking AreasValidFrequency Percent Valid PercentCumulativePercentAboutright131 89.7 91.6 91.6Need more 12 8.2 8.4 100.0Total 143 97.9 100.0Missing System 3 2.1Total 146 100.0Adequate Number of MarinasValidFrequency Percent Valid PercentCumulativePercentToo many 2 1.4 1.4 1.4Aboutright128 87.7 89.5 90.9Need more 13 8.9 9.1 100.0Total 143 97.9 100.0Missing System 3 2.1Total 146 100.047<strong>Possum</strong> <strong>Kingdom</strong> <strong>Lake</strong> <strong>Boating</strong> <strong>Capacity</strong> <strong>Study</strong> April 2006, All Rights Reserved, ©Park Studies, Inc.
Positive or Negative ChangesValidFrequency Percent Valid PercentCumulativePercentNegativeChange14 9.6 9.9 9.9No Change 71 48.6 50.0 59.9Both NegativeAnd Positive13 8.9 9.2 69.0ChangePositiveChange44 30.1 31.0 100.0Total 142 97.3 100.0Missing System 4 2.7Total 146 100.0State of OriginValidFrequency Percent Valid PercentCumulativePercent16 11.0 11.0 11.0TX 130 89.0 89.0 100.0Total 146 100.0 100.048<strong>Possum</strong> <strong>Kingdom</strong> <strong>Lake</strong> <strong>Boating</strong> <strong>Capacity</strong> <strong>Study</strong> April 2006, All Rights Reserved, ©Park Studies, Inc.
Descriptive Statistics for Marina/Dock UsersPKL Marina/Dock BoatersYear boating LGNumber of weekenddays boating last yearNumber of weekdays boating last yearFeetHPValid NN Minimum Maximum Mean Std. Deviation347 1 67 19.60 15.576344 0 150 23.12 19.968343 0 300 15.66 22.760360 .00 55.00 24.1537 7.50090329 0 1200 265.71 180.362294Have You Boated on This <strong>Lake</strong> Before?ValidCumulativeFrequency Percent Valid Percent PercentNo 23 5.4 6.3 6.3Yes 344 80.6 93.7 100.0Total 367 85.9 100.0Missing System 60 14.1Total 427 100.0Runabout/Speedboat/SkiboatValidCumulativeFrequency Percent Valid Percent PercentNo 168 39.3 45.7 45.7Yes 200 46.8 54.3 100.0Total 368 86.2 100.0Missing System 59 13.8Total 427 100.049<strong>Possum</strong> <strong>Kingdom</strong> <strong>Lake</strong> <strong>Boating</strong> <strong>Capacity</strong> <strong>Study</strong> April 2006, All Rights Reserved, ©Park Studies, Inc.
Fishing/Bass BoatValidCumulativeFrequency Percent Valid Percent PercentNo 311 72.8 84.5 84.5Yes 57 13.3 15.5 100.0Total 368 86.2 100.0Missing System 59 13.8Total 427 100.0Pontoon BoatValidCumulativeFrequency Percent Valid Percent PercentNo 305 71.4 82.9 82.9Yes 63 14.8 17.1 100.0Total 368 86.2 100.0Missing System 59 13.8Total 427 100.050<strong>Possum</strong> <strong>Kingdom</strong> <strong>Lake</strong> <strong>Boating</strong> <strong>Capacity</strong> <strong>Study</strong> April 2006, All Rights Reserved, ©Park Studies, Inc.
Personal WatercraftValidCumulativeFrequency Percent Valid Percent PercentNo 259 60.7 70.4 70.4Yes 109 25.5 29.6 100.0Total 368 86.2 100.0Missing System 59 13.8Total 427 100.0Percent Personal Watercraft806040200NoYes51<strong>Possum</strong> <strong>Kingdom</strong> <strong>Lake</strong> <strong>Boating</strong> <strong>Capacity</strong> <strong>Study</strong> April 2006, All Rights Reserved, ©Park Studies, Inc.
High Performance BoatValidCumulativeFrequency Percent Valid Percent PercentNo 356 83.4 96.7 96.7Yes 12 2.8 3.3 100.0Total 368 86.2 100.0Missing System 59 13.8Total 427 100.0House BoatValidCumulativeFrequency Percent Valid Percent PercentNo 357 83.6 97.0 97.0Yes 11 2.6 3.0 100.0Total 368 86.2 100.0Missing System 59 13.8Total 427 100.0Cabin CruiserValidCumulativeFrequency Percent Valid Percent PercentNo 310 72.6 84.2 84.2Yes 58 13.6 15.8 100.0Total 368 86.2 100.0Missing System 59 13.8Total 427 100.052<strong>Possum</strong> <strong>Kingdom</strong> <strong>Lake</strong> <strong>Boating</strong> <strong>Capacity</strong> <strong>Study</strong> April 2006, All Rights Reserved, ©Park Studies, Inc.
Flatbottom/Jonboat V HullValidCumulativeFrequency Percent Valid Percent PercentNo 358 83.8 97.3 97.3Yes 10 2.3 2.7 100.0Total 368 86.2 100.0Missing System 59 13.8Total 427 100.0Sailboat/SailboardValidCumulativeFrequency Percent Valid Percent PercentNo 363 85.0 98.6 98.6Yes 5 1.2 1.4 100.0Total 368 86.2 100.0Missing System 59 13.8Total 427 100.0Other Boat TypeValidCumulativeFrequency Percent Valid Percent PercentNo 359 84.1 97.8 97.8Yes 8 1.9 2.2 100.0Total 367 85.9 100.0Missing System 60 14.1Total 427 100.053<strong>Possum</strong> <strong>Kingdom</strong> <strong>Lake</strong> <strong>Boating</strong> <strong>Capacity</strong> <strong>Study</strong> April 2006, All Rights Reserved, ©Park Studies, Inc.
Favorite LocationValidCumulativeFrequency Percent Valid Percent PercentNo 53 12.4 14.6 14.6Yes 309 72.4 85.1 99.7Total 363 85.0 100.0Missing System 64 15.0Total 427 100.0Percent Favorite Location100806040200NoYes54<strong>Possum</strong> <strong>Kingdom</strong> <strong>Lake</strong> <strong>Boating</strong> <strong>Capacity</strong> <strong>Study</strong> April 2006, All Rights Reserved, ©Park Studies, Inc.
Any Place You Deliberately Avoid?ValidCumulativeFrequency Percent Valid Percent PercentNo 145 34.0 40.5 40.5Yes 213 49.9 59.5 100.0Total 358 83.8 100.0Missing System 69 16.2Total 427 100.0Any Place You Feel Unsafe on <strong>Lake</strong>?ValidCumulativeFrequency Percent Valid Percent PercentNo 222 52.0 64.3 64.3Yes 123 28.8 35.7 100.0Total 345 80.8 100.0Missing System 82 19.2Total 427 100.0Feel Safe at Boat RampValidFrequency Percent Valid PercentCumulativePercentNot at allSafe1 .2 .4 .4SomewhatSafe7 1.6 2.7 3.1ModeratelySafe86 20.1 32.8 35.9ExtremelySafe167 39.1 63.7 99.6Total 262 61.4 100.0Missing System 165 38.6Total 427 100.055<strong>Possum</strong> <strong>Kingdom</strong> <strong>Lake</strong> <strong>Boating</strong> <strong>Capacity</strong> <strong>Study</strong> April 2006, All Rights Reserved, ©Park Studies, Inc.
Feel Safe on WaterFrequency Percent Valid PercentCumulativePercentValid Not at allSafe3 .7 .9 .9SomewhatSafe27 6.3 8.2 9.1ModeratelySafe141 33.0 42.7 51.8ExtremelySafe159 37.2 48.2 100.0Total 330 77.3 100.0Missing System 97 22.7Total 427 100.0Percent Feel Safe on Water50403020100Not at all Safe Somewhat Safe Moderately Safe Extremely Safe56<strong>Possum</strong> <strong>Kingdom</strong> <strong>Lake</strong> <strong>Boating</strong> <strong>Capacity</strong> <strong>Study</strong> April 2006, All Rights Reserved, ©Park Studies, Inc.
Crowded at Boat RampValidFrequency Percent Valid PercentCumulativePercentNot at allCrowded111 26.0 43.7 43.7SomewhatCrowded72 16.9 28.3 72.0ModeratelyCrowded59 13.8 23.2 95.3ExtremelyCrowded11 2.6 4.3 99.6Total 254 59.5 100.0Missing System 173 40.5Total 427 100.057<strong>Possum</strong> <strong>Kingdom</strong> <strong>Lake</strong> <strong>Boating</strong> <strong>Capacity</strong> <strong>Study</strong> April 2006, All Rights Reserved, ©Park Studies, Inc.
Percent Crowded at Boat Ramp50403020100Not at allCrowdedSomewhatCrowdedModeratelyCrowdedExtremelyCrowded58<strong>Possum</strong> <strong>Kingdom</strong> <strong>Lake</strong> <strong>Boating</strong> <strong>Capacity</strong> <strong>Study</strong> April 2006, All Rights Reserved, ©Park Studies, Inc.
Crowded on WaterValidFrequency Percent Valid PercentCumulativePercentNot at allCrowded98 23.0 29.2 29.2SomewhatCrowded103 24.1 30.7 59.8ModeratelyCrowded97 22.7 28.9 88.7ExtremelyCrowded38 8.9 11.3 100.0Total 336 78.7 100.0Missing System 91 21.3Total 427 100.059<strong>Possum</strong> <strong>Kingdom</strong> <strong>Lake</strong> <strong>Boating</strong> <strong>Capacity</strong> <strong>Study</strong> April 2006, All Rights Reserved, ©Park Studies, Inc.
Percent Crowded on Water3020100Not at all CrowdedSomewhatCrowdedModeratelyCrowdedExtremely Crowded60<strong>Possum</strong> <strong>Kingdom</strong> <strong>Lake</strong> <strong>Boating</strong> <strong>Capacity</strong> <strong>Study</strong> April 2006, All Rights Reserved, ©Park Studies, Inc.
Adequate Number of Boat RampsValidFrequency Percent Valid PercentCumulativePercentToo Many 5 1.2 1.6 1.6AboutRight245 57.4 76.3 77.9Need More 71 16.6 22.1 100.0Total 321 75.2 100.0Missing System 106 24.8Total 427 100.0Percent Adequate Number of Boat Ramps806040200Too Many About Right Need More61<strong>Possum</strong> <strong>Kingdom</strong> <strong>Lake</strong> <strong>Boating</strong> <strong>Capacity</strong> <strong>Study</strong> April 2006, All Rights Reserved, ©Park Studies, Inc.
Adequate Number of Parking AreasValidFrequency Percent Valid PercentCumulativePercentToo many 9 2.1 2.9 2.9Aboutright227 53.2 73.2 76.1Need more 74 17.3 23.9 100.0Total 310 72.6 100.0Missing System 117 27.4Total 427 100.0Percent Adequate Number of Parking Areas806040200Too many About right Need more62<strong>Possum</strong> <strong>Kingdom</strong> <strong>Lake</strong> <strong>Boating</strong> <strong>Capacity</strong> <strong>Study</strong> April 2006, All Rights Reserved, ©Park Studies, Inc.
Adequate Number of MarinasValidFrequency Percent Valid PercentCumulativePercentToo many 12 2.8 3.6 3.6Aboutright231 54.1 70.0 73.6Need more 87 20.4 26.4 100.0Total 330 77.3 100.0Missing System 97 22.7Total 427 100.0Percent Adequate Number of Marinas706050403020100Too many About right Need more63<strong>Possum</strong> <strong>Kingdom</strong> <strong>Lake</strong> <strong>Boating</strong> <strong>Capacity</strong> <strong>Study</strong> April 2006, All Rights Reserved, ©Park Studies, Inc.
Positive or Negative ChangesValidFrequency Percent Valid PercentCumulativePercentNegativeChange136 31.9 37.8 37.8No Change 75 17.6 20.8 58.6Both Negativeand Positive118 27.6 32.8 91.4ChangePositiveChange31 7.3 8.6 100.0Total 360 84.3 100.0Missing System 67 15.7Total 427 100.064<strong>Possum</strong> <strong>Kingdom</strong> <strong>Lake</strong> <strong>Boating</strong> <strong>Capacity</strong> <strong>Study</strong> April 2006, All Rights Reserved, ©Park Studies, Inc.
Evidence that 2005 was a Low-Use YearBased on preliminary discussions with the <strong>Possum</strong> <strong>Kingdom</strong> <strong>Lake</strong> Ranger staffand State Park personnel, it was suggested that the 2005 boating season was unusuallylow. Mr. Rocky Holland, Park Superintendent, PK State Park (personal communication,2006) supports this contention based on higher gasoline prices, unpredictable weather,and poor fishing. Although he stated that construction during the middle two weeks ofMarch (spring break) occurred, he felt that it did not impact boating in a negative way.This is typically a low-use time of the year.To investigate the contention that 2005 was a low-use year for boating, PSIsought two independent sources of information. First, <strong>Possum</strong> <strong>Kingdom</strong> State Parkprovided visitation data for the last five years. Second, BRA provided “head count” datacollected at marinas, boat ramps, and camping areas. Five years of data were assembledfrom the head count data and one-year from the State Park data to confirm or disconfirmthe condition of low-use for the 2005 boating season.Methods for “Head Count Data”BRA <strong>Lake</strong> Rangers counted persons at 32 locations during weekdays andweekend days during the years 2001-2005. The number of weekdays and weekend dayswhen the data were collected are shown below.Year Weekend Weekday Time Period2001 16 4 March 30 until October 182002 13 3 May 24 until September 022003 10 4 April 30 until August 312004 10 6 April 28 until September 172005 17 5 May 27 until October 1765<strong>Possum</strong> <strong>Kingdom</strong> <strong>Lake</strong> <strong>Boating</strong> <strong>Capacity</strong> <strong>Study</strong> April 2006, All Rights Reserved, ©Park Studies, Inc.
6000400020000Visitation for 2001-05Weekends2001, 34472002, 42752003, 54592004, 51222005, 3323Head count percentage drop from 2004 - 2005 = approximately 35%3323/5122 = .6487100 - 65 = 35.35 X 5122 = 1,792Proof: 1,792 + 3323 = 5115500040003000200010000Weekend Average for2001-04 with 20052001-04, 45762005, 3323Head count percentage drop from 2001- 04 to 2005 = approximately 27%3323\4576 = .7262100 - 73 = 27.27 X 4576 = 1,235Proof: 1,235 + 3323 = 455866<strong>Possum</strong> <strong>Kingdom</strong> <strong>Lake</strong> <strong>Boating</strong> <strong>Capacity</strong> <strong>Study</strong> April 2006, All Rights Reserved, ©Park Studies, Inc.
40003000200010000Visitation for 2001-05Weekdays2001, 5712002, 34132003, 16042004, 15632005, 1349Head count percentage drop from 2001 to 2005 = approximately 14%1349/1563 = .8708100 – 87 = 13.13 X 1563 = 203Proof: 203+ 1349 = 1,5522000150010005000Weekday Average for2001-04 with 20052001-04, 17882005, 1349Head count percentage drop from 2001 - 2004 to 2005 = approximately 25%1349/1788 = .7544100 – 75 + 25.25 X 1788 = 447Proof: 447 + 1349 = 179667<strong>Possum</strong> <strong>Kingdom</strong> <strong>Lake</strong> <strong>Boating</strong> <strong>Capacity</strong> <strong>Study</strong> April 2006, All Rights Reserved, ©Park Studies, Inc.
100000800006000040000200000State Park Visitationfor 2004 & 20052004, 80,2022005, 66,259State park percentage drop from 2004 to 2005 = approximately 18%66,259/80,202 = .8261100 – 82 = 18.18 X 80,202 = 14,436Proof: 14,436 + 66,259 = 80,695SummaryBased on two independent sources of data, we adopted 25% as a weighted influence tojustify the incorporation of July 3 data for <strong>Possum</strong> <strong>Kingdom</strong> <strong>Lake</strong>. Map B is therecommended map in support of the recommendations.68<strong>Possum</strong> <strong>Kingdom</strong> <strong>Lake</strong> <strong>Boating</strong> <strong>Capacity</strong> <strong>Study</strong> April 2006, All Rights Reserved, ©Park Studies, Inc.
4. DiscussionManagement Information ObtainedMuch has been learned during this study about how much and how often boatersuse the lake. The characteristics of boaters are closely related to how they react toobserved changes occurring on the lake and what they perceive to be quality recreationalopportunities. A wide variety of survey generated baseline information about boatergroups describes their perceptions about and preferences for the conditions that mostaffect their use and enjoyment of the lake.Overall Data SummaryA majority of boaters are returning to PKL each year. Boat ramp users have beenreturning about half as long as marina slip' renters and private dock owners. Boat rampusers spend about half as many days on the lake as the other group. The length andhorsepower of boats is larger for marina/dock users than ramp users. Fishing pressure isextremely low for a lake of this size.All three boater groups felt safe on the water; however the marina/dock group wasmore sensitive to crowding on the water. Both groups felt that the number of marinaswas about right; however the marina/dock group indicated a need for more. Both groupshad favorite locations on the lake as well as places they avoided. Places like Hells Gatewere both favorite and avoided for different reasons. The same perceptions holds true forlaw enforcement; some say more is needed while others say there is too much. Thedifferences have much to do with location versus the entire lake.For that reason, this study sought to discuss the lake in both broad terms andlocation specific terms leading to recommendations. The data created here is a baselineor “snapshot” in time. Monitoring should occur every 3-5 years and budgetedaccordingly to take advantage of trends, challenges, and changing conditions in meetingthe agency goals for improved stewardship and the ability to provide safe and enjoyableopportunities now and in the future.69<strong>Possum</strong> <strong>Kingdom</strong> <strong>Lake</strong> <strong>Boating</strong> <strong>Capacity</strong> <strong>Study</strong> April 2006, All Rights Reserved, ©Park Studies, Inc.
Management Compartment Classification and PercentProjections SummaryBased on experiences with other lakes, it was surprising that PKL did not exhibitmore areas in the red and less areas in the green classification. At first glance it wouldappear that the lake has few problems; however the percentages indicating a moderatelycrowded condition along with the comments about behavior on the lake suggest adifferent scenario. Furthermore, it was noted that many of the classified compartmentswere very borderline based on low conflicts suggesting that an increase in conflicts couldpush the classifications toward more restrictive measures.The series of maps projecting use into the future serve as a diagnostic tool fromwhich to evaluate proposed developments, direct <strong>Lake</strong> Ranger activities, and provide aformat for further discussion with local officials. These projections are conservativesince conflicts were held constant.Managers are encouraged to continue collecting accident data as well as headcount data. These two sources of information proved indispensable in corroborating theclassification maps and ultimately supporting the recommendations.Overall Management Recommendations• Do not worsen crowding/conflict problems---work to mitigate these problemswhere they exist with alternatives.• No further development in management compartments I, III, and IV that wouldresult in additional boating density and potential conflicts in those areas.• Preserve the diversity of recreation opportunities within different parts of the lakewith special attention to protecting low use areas and/or “escape” coves.70<strong>Possum</strong> <strong>Kingdom</strong> <strong>Lake</strong> <strong>Boating</strong> <strong>Capacity</strong> <strong>Study</strong> April 2006, All Rights Reserved, ©Park Studies, Inc.
Specific Management RecommendationsThese recommendations are based on cooperating partner workshops, publicworkshops, e-mail and written correspondence, and consultant experience.• Freeze existing commercial on-water facilities, wet storage marinas, to includethose previously contracted expansions, at present levels and opt for dry stackstorage at suitable locations• No additional private on-water facilities unless grandfathered• Install channel buoy markers• Authorize additional public boat ramps based upon lake impact• Continue to enhance ramp, courtesy docks, and parking conditions• Continue to enforce Federal Energy Regulatory Commission (FERC) regulationsregarding setbacks• Creation of additional shoreline buffers beyond those mandated by FERC71<strong>Possum</strong> <strong>Kingdom</strong> <strong>Lake</strong> <strong>Boating</strong> <strong>Capacity</strong> <strong>Study</strong> April 2006, All Rights Reserved, ©Park Studies, Inc.
72<strong>Possum</strong> <strong>Kingdom</strong> <strong>Lake</strong> <strong>Boating</strong> <strong>Capacity</strong> <strong>Study</strong> April 2006, All Rights Reserved, ©Park Studies, Inc.
5. Literature CitedDowning, K., and R. N. Clark. 1979. Users' and managers' perceptions of dispersedrecreation impacts: A focus on roaded-forested lands. Pages 18-23 in: Proceedings of theWildland Recreation Impacts Conference. USDA Forest Service, USDI National ParkService, R-6-001-1979.Dillman D. 1978. Mail and telephone surveys: The total design method. New York: JohnWiley.Fowler, F.J. Jr. 1993. Survey research methods. SAGE Publications, Inc., Newbury Park,California.Hendee, J. C., and R. W. Harris. 1970. Foresters' perceptions of wilderness-user attitudesand preferences. Journal of Forestry 68(12):759-762.Holland, Rocky. 2006. Personal Communication. April 25, 2006.Manning, R. E. 1999. Studies in outdoor recreation. Oregon State University Press,Corvallis.Schreyer, R. 1987. Social psychological aspects of outdoor recreation. Trends. 5 (4): 8 -13. U. S. Department of the Interior; National Park Service and National Recreation andParks Association.Titre, J. P. and J. Vogel. 1993. A Pilot test of the quality upgrading and learning (QUAL)carrying capacity process at oughiogheny River <strong>Lake</strong>, Pennsylvania. UnpublishedTechnical Report. Environmental Laboratory, U. S. Army Corps of Engineers WaterwaysExperiment Station, Vicksburg, MS.Titre, J.P., J. J Vogel, K. Chilman, V. Roe and W. M. Dunk. 1995. A study of boatingrecreation on <strong>Lake</strong> Travis, <strong>Texas</strong>, Contract Report. Vicksburg: U. S. Army Corps ofEngineers, Waterways Experiment StationTitre, J.P, J.J. Vogel, W.M. Dunk, K. Chilman, and J. Killelea. 1996. A study of boaterrecreation on Beaver <strong>Lake</strong>, Arkansas. Little Rock: U.S. Army Corps of Engineers.Washburne, R. F. 1982. Wilderness recreational carrying capacity: are numbersnecessary? Journal of Forestry. 80:726-28.73<strong>Possum</strong> <strong>Kingdom</strong> <strong>Lake</strong> <strong>Boating</strong> <strong>Capacity</strong> <strong>Study</strong> April 2006, All Rights Reserved, ©Park Studies, Inc.
74<strong>Possum</strong> <strong>Kingdom</strong> <strong>Lake</strong> <strong>Boating</strong> <strong>Capacity</strong> <strong>Study</strong> April 2006, All Rights Reserved, ©Park Studies, Inc.
75<strong>Possum</strong> <strong>Kingdom</strong> <strong>Lake</strong> <strong>Boating</strong> <strong>Capacity</strong> <strong>Study</strong> April 2006, All Rights Reserved, ©Park Studies, Inc.