Babcock & Brown
24 08 06 interim result 2006 presentation.pdf - Astrojapanproperty.com
24 08 06 interim result 2006 presentation.pdf - Astrojapanproperty.com
- No tags were found...

You also want an ePaper? Increase the reach of your titles
YUMPU automatically turns print PDFs into web optimized ePapers that Google loves.
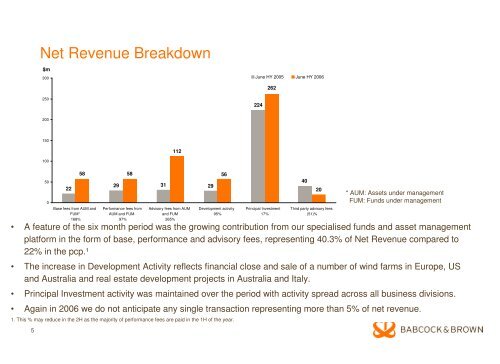
Net Revenue Breakdown<br />
$m<br />
300<br />
June HY 2005 June HY 2006<br />
262<br />
250<br />
224<br />
200<br />
150<br />
112<br />
100<br />
• A feature of the six month period was the growing contribution from our specialised funds and asset management<br />
platform in the form of base, performance and advisory fees, representing 40.3% of Net Revenue compared to<br />
22% in the pcp.¹<br />
• The increase in Development Activity reflects financial close and sale of a number of wind farms in Europe, US<br />
and Australia and real estate development projects in Australia and Italy.<br />
• Principal Investment activity was maintained over the period with activity spread across all business divisions.<br />
• Again in 2006 we do not anticipate any single transaction representing more than 5% of net revenue.<br />
1. This % may reduce in the 2H as the majority of performance fees are paid in the 1H of the year.<br />
5<br />
50<br />
0<br />
22<br />
Base fees from AUM and<br />
FUM*<br />
168%<br />
58 58<br />
29 31 29<br />
Performance fees from<br />
AUM and FUM<br />
97%<br />
Advisory fees from AUM<br />
and FUM<br />
265%<br />
56<br />
Development activity<br />
95%<br />
Principal Investment<br />
17%<br />
40<br />
20<br />
Third party advisory fees<br />
(51)%<br />
* AUM: Assets under management<br />
FUM: Funds under management