interpretation
Volume 15, Number 1 - National Association for Interpretation
Volume 15, Number 1 - National Association for Interpretation

Create successful ePaper yourself
Turn your PDF publications into a flip-book with our unique Google optimized e-Paper software.
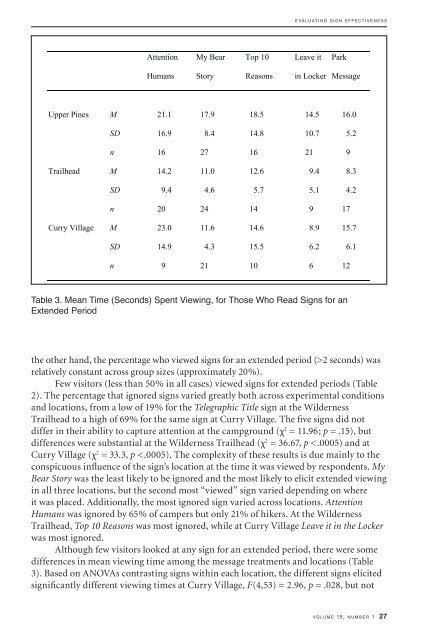
Table 3<br />
Mean Time (Seconds) Spent Viewing, for Those Who Read Signs for an Extended Period<br />
e v a l u a t i n g s i g n e f f e c t i v e n e s s<br />
Attention My Bear Top 10 Leave it Park<br />
Humans Story Reasons in Locker Message<br />
Upper Pines M 21.1 17.9 18.5 14.5 16.0<br />
SD 16.9 8.4 14.8 10.7 5.2<br />
n 16 27 16 21 9<br />
Trailhead M 14.2 11.0 12.6 9.4 8.3<br />
SD 9.4 4.6 5.7 5.1 4.2<br />
n 20 24 14 9 17<br />
Curry Village M 23.0 11.6 14.6 8.9 15.7<br />
SD 14.9 4.3 15.5 6.2 6.1<br />
n 9 21 10 6 12<br />
Table 3. Mean Time (Seconds) Spent Viewing, for Those Who Read Signs for an<br />
Extended Period<br />
the other hand, the percentage who viewed signs for an extended period (>2 seconds) was<br />
relatively constant across group sizes (approximately 20%).<br />
Few visitors (less than 50% in all cases) viewed signs for extended periods (Table<br />
2). The percentage that ignored signs varied greatly both across experimental conditions<br />
and locations, from a low of 19% for the Telegraphic Title sign at the Wilderness<br />
Trailhead to a high of 69% for the same sign at Curry Village. The five signs did not<br />
differ in their ability to capture attention at the campground (χ 2 = 11.96; p = .15), but<br />
differences were substantial at the Wilderness Trailhead (χ 2 = 36.67, p