Skykomish Draft Final Report - Wild Fish Conservancy
Skykomish Draft Final Report - Wild Fish Conservancy
Skykomish Draft Final Report - Wild Fish Conservancy

You also want an ePaper? Increase the reach of your titles
YUMPU automatically turns print PDFs into web optimized ePapers that Google loves.
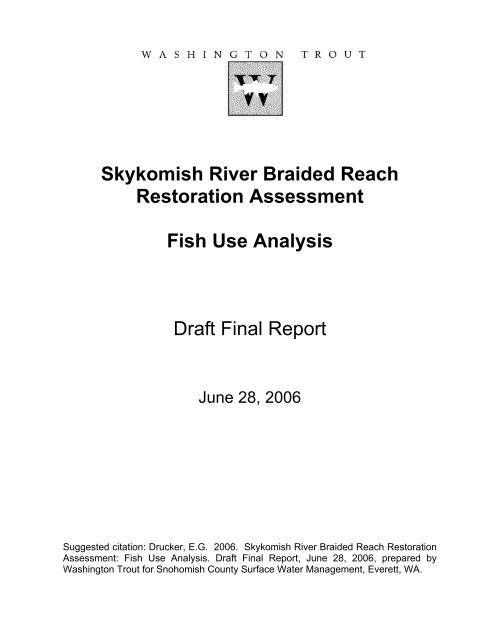
<strong>Skykomish</strong> River Braided Reach<br />
Restoration Assessment<br />
<strong>Fish</strong> Use Analysis<br />
<strong>Draft</strong> <strong>Final</strong> <strong>Report</strong><br />
June 28, 2006<br />
Suggested citation: Drucker, E.G. 2006. <strong>Skykomish</strong> River Braided Reach Restoration<br />
Assessment: <strong>Fish</strong> Use Analysis. <strong>Draft</strong> <strong>Final</strong> <strong>Report</strong>, June 28, 2006, prepared by<br />
Washington Trout for Snohomish County Surface Water Management, Everett, WA.
Introduction<br />
Snohomish County Surface Water Management and partners have proposed to identify and<br />
prioritize opportunities to restore reach-level channel processes within the braided section of the<br />
<strong>Skykomish</strong> River extending from the cities of Gold Bar to Sultan, WA. The braided reach<br />
(“study reach”) includes over ten miles of mainstem channel between “Big Eddy” in Gold Bar<br />
(rm 43.3) and Sultan (rm 33), and nearly seven miles of interconnected side channels (Figs 1–7).<br />
In 2004 Washington Trout (WT) surveyed the braided reach in support of the following project<br />
goals:<br />
• to describe patterns of current fish use within the study reach to define a baseline against<br />
which future conditions can be compared;<br />
• to identify critical fish habitats so that restoration actions with high likelihood of creating<br />
and maintaining these habitats can be prioritized;<br />
• to evaluate the biological cost and benefit of proposed restoration actions.<br />
Washington Trout’s 2004 field work served two general tasks designed to evaluate fish use<br />
within the braided reach. First, fish species composition and relative abundance were surveyed<br />
seasonally within a subsample of habitat units chosen to represent the overall habitat-type<br />
distribution in the study reach. The specific objectives of these surveys were (i) to compare<br />
species diversity and relative density of adult and juvenile fishes in the study reach’s mainstem<br />
and in associated side channel networks; (ii) to identify physical habitat features significantly<br />
related to fish relative density, including habitat unit type and size, and within-unit survey<br />
location (e.g. channel center versus edge habitat; unit middle versus upstream–downstream unit<br />
interface; Fig. 8); and (iii) to examine seasonal and diel variation in species composition,<br />
distribution, and relative abundance.<br />
The second task related to fish-use assessment was characterization of salmon spawning activity<br />
in the study reach. Redd and carcass surveys were performed in order to (i) quantify the<br />
incidence and timing of spawning activity throughout the braided reach; (ii) to document<br />
species-specific patterns in the spatial distribution of spawning; and (iii) to examine the<br />
relationship between spawning activity and physical habitat characteristics.<br />
Patterns of fish use in the <strong>Skykomish</strong> River braided reach provided guidance for developing both<br />
a general strategy and specific projects for restoring and protecting habitat. Recommendations<br />
for designing and prioritizing such projects are presented in Chapter X.<br />
Methods<br />
Reach Nomenclature<br />
The braided reach was partitioned into distinct habitat units (pools, riffles, glides) according to<br />
the Snohomish County Preliminary Habitat Analysis of July 2004 (Figs 1–7). To facilitate<br />
comparison among units, unique identifier numbers were assigned to each mainstem and side<br />
channel habitat unit surveyed. Side channel networks were named from upstream to downstream<br />
as follows: SCA (right-bank channel near the city of Gold Bar) (Fig. 3), SCB (left-bank network<br />
near Gold Bar) (Fig. 3), SCC (left-bank network between the cities of Startup and Sultan) (Figs<br />
5, 7), SCD (right-bank network near Sultan) (Fig. 6).<br />
Preliminary habitat-type designations, based on inspection of channel morphology in aerial<br />
photographs taken during summer low-flow conditions, were ground-truthed by Washington<br />
1
Trout in August and September 2004. During these summer surveys, WT crews qualitatively<br />
assessed each mapped unit’s physical characteristics including water depth, velocity, and surface<br />
turbulence. These observations were measured against the geomorphic definitions of each unit<br />
type following Cramer (2001):<br />
Pool: a unit with residual depth and no surface turbulence except at its inflow.<br />
Glide: a unit with no residual depth, little surface turbulence, and relatively uniform flow<br />
velocity.<br />
Riffle: a unit with discernable gradient and surface turbulence.<br />
Several of the preliminary habitat type designations in the mainstem channel were modified on<br />
the basis of WT’s on-site surveys. When correction of the original habitat unit type resulted in<br />
two consecutive units of the same type, the two units were consolidated into a single larger unit<br />
and renamed accordingly (e.g. mainstem unit “70+71”). In side channels, where most mapped<br />
habitat units were pools, WT crews identified and named a number of additional units not<br />
appearing on the preliminary maps. Note that the fish use surveys, which relied on these<br />
corrected preliminary maps, preceded the final habitat unit delineation based on quantitative, onsite<br />
physical surveys (cf. Appendix X). <strong>Fish</strong> survey areas and final habitat unit boundaries were<br />
largely congruent; in cases where areal discrepancies were large, associated fish use data were<br />
excluded from analysis.<br />
Species Composition and Relative Abundance<br />
Snorkel surveys were performed seasonally (Table 1) to provide estimates of fish species<br />
diversity and relative abundance within the braided reach. Survey teams were comprised of<br />
three snorkelers who floated abreast in a downstream direction during daylight hours (summer,<br />
fall and winter 2004), and at night (winter 2004), recording in notebooks the species, life stage<br />
(young-of-year and yearling juvenile versus adult) and number of all fishes observed within each<br />
habitat unit. Waterproof habitat unit maps and aerial photographs (Figs 2–6) were used to assist<br />
in identifying habitat unit boundaries in the field.<br />
Surveyors occupied three longitudinal snorkel lanes, one located in the center of the channel and<br />
one at each channel edge (Fig. 8) (cf. Fig. 3 in Pess et al., 2002; Cramer, 2001 p. 42). Snorkelers<br />
changed lanes frequently between habitat units to minimize potential spatial bias in fish counts.<br />
The width of each snorkel lane was defined by visibility on the day of the survey. Although<br />
adult fish could be discerned underwater at distances up to 25 feet in the summer and up to 15<br />
feet in the fall (Table 1), the maximum distance at which the smallest juvenile fish could be<br />
confidently identified was approximately 5 feet (cf. Hillman and Chapman, 1989). Each snorkel<br />
lane, therefore, was conservatively estimated as 10 feet wide. Within each habitat unit polygon<br />
(Figs 2–6) the ten-foot wide curvilinear corridor along the unit’s longitudinal midline was used<br />
to calculate snorkel lane area. To approximate relative fish densities for each habitat unit, total<br />
fish counts were divided by the estimated total wetted area surveyed (i.e. three-times snorkel<br />
lane area). As emphasized previously (Cramer, 2001), fish relative density calculated from a<br />
large-river census of this type must be considered representative only of the surveyed fraction of<br />
the total habitat area.<br />
To examine patterns of within-unit spatial variation in the relative density of fish species<br />
observed, each mainstem habitat unit was partitioned into nine survey subareas. The three<br />
longitudinal snorkel lanes defined left-bank, center, and right-bank areas; units were further<br />
2
partitioned into upper, middle and lower thirds (Fig. 8). The latter divisions were approximated<br />
in the field by consulting aerial photographs. The area of channel edge habitat surveyed within a<br />
unit (A E ) was taken as the sum of the left-bank and right-bank subareas. Habitat unit interface<br />
area (A I ) was calculated as the lower one-third of a given unit’s survey area plus the upper onethird<br />
of the adjacent downstream unit’s survey area. Relative densities (count m -2 ) then were<br />
calculated for (i) upper, middle and lower survey areas within units by dividing corresponding<br />
fish counts by one-third of the total unit survey area; (ii) edge habitat areas within units by<br />
dividing the sum of left- and right-bank fish counts by A E (i.e. two-thirds of the total unit survey<br />
area); and (iii) habitat unit interface areas using fish counts within A I . This sampling approach<br />
allowed testing of the hypothesis that relative fish density in habitat unit subareas with relatively<br />
great physical heterogeneity (channel edge and habitat unit interface) exceeds that in more<br />
homogeneous habitats (channel center and middle) (cf. Fig. 8).<br />
For both mainstem and side channel survey areas, fish densities were calculated individually for<br />
juveniles and adults of each species observed, and for five species categories: (1) all fish species;<br />
(2) all salmonids (juvenile and adults); (3) adult salmonids; (4) juvenile salmonids; and (5) ESAlisted<br />
salmonids (Chinook salmon and bull trout, adults and juveniles). For salmonid categories<br />
2–4, mountain whitefish (Prosopium williamsoni) were excluded on the basis of the species’<br />
relatively high abundance and unthreatened status (Snohomish River Basin Salmon Recovery<br />
Forum, 2005).<br />
After an initial reconnaissance snorkel of the mainstem in late July 2004, a baseline of fish use<br />
data for summer 2004 was obtained over the course of five days (early August to early<br />
September) by snorkeling every mapped mainstem habitat unit between rm 34.5 and rm 43.3<br />
(units 1–74 consecutively; Figs 2–6) as well as the majority of mapped units within side channel<br />
networks SCB (22 units) and SCC (30 units) (Tables 1, 3). In the subsequent fall 2004 survey,<br />
mainstem habitat units were sampled by a stratified (proportional allocation) subsampling<br />
protocol (EPA, 2002). Specifically, habitat units of different types were selected randomly for<br />
survey in proportion to the frequency of their occurrence within two contiguous segments of the<br />
study reach with distinct geomorphological profiles (cf. Appendix X): “Big Eddy” in Gold Bar to<br />
Startup and Startup to the mouth of the Sultan River (Table 2). The mainstem was subsampled<br />
using this protocol on a single day in fall 2004 (mid November). Selected units in side channel<br />
network SCC were surveyed in winter 2004 (late December) to allow seasonal comparisons with<br />
summer fish use data from this network. Preliminary observations on diel variation in fish<br />
distribution and relative abundance were also made during this winter survey (cf. Table 1). WT<br />
crews attempted to snorkel side channel network SCD and the adjacent mainstem reach (i.e.<br />
below the mouth of the Sultan River; <strong>Skykomish</strong> rm 33–34.5) in December 2004 but extremely<br />
poor visibility in both areas precluded the collection of fish use data. Snorkel sites and habitat<br />
unit sample sizes for all 2004 side channel surveys are listed in Table 3.<br />
Spawning Surveys<br />
Washington Trout coordinated with Washington Department of <strong>Fish</strong> and <strong>Wild</strong>life personnel to<br />
identify the range of dates that typically encompasses the spawning runs of Chinook, chum and<br />
coho salmon in the <strong>Skykomish</strong> River braided reach. On four days within this range during fall<br />
2004 (between September and December; Table 1), WT field crews conducted surveys<br />
throughout the mainstem channel and side channel networks SCA, SCB, SCC and SCD (rm 33–<br />
43.3) to record evidence of salmon spawning activity. Surveys were performed by boat and on<br />
3
foot; polarized sunglasses were worn to facilitate observation of salmon redds and carcasses. At<br />
each redd, the following data were collected:<br />
• redd location (using GPS);<br />
• redd habitat (pool, riffle, glide, tailout, channel edge/bank);<br />
• redd substrate (cobble, gravel, sand);<br />
• presence (and number) or absence of live spawners.<br />
When reduced water visibility precluded identification of the species of fish on a redd, or when a<br />
redd was unoccupied, WT crews made presumptive species assignments based on observed<br />
physical characteristics of the redd. The “chinook (assumed)” assignment was given to isolated<br />
redds exceeding 4 feet in length and occurring in large-cobble mainstem habitat; “chum<br />
(assumed)” was assigned to clustered redds, each less than 4 feet in length, occurring in side<br />
channel habitat units.<br />
From each salmon carcass observed, the following data were collected:<br />
• carcass location (using GPS);<br />
• species;<br />
• sex;<br />
• body length;<br />
• presence/absence of adipose fin;<br />
• spawning status (when practical, body cavities of female fish were opened to inspect the<br />
degree of egg retention).<br />
Statistical Analyses<br />
To facilitate comparison with other fish use studies, average relative fish densities in the<br />
<strong>Skykomish</strong> River were calculated from fish counts and survey areas of all habitat units surveyed,<br />
regardless of fish presence or absence. For the purpose of statistical analysis, however, adjusted<br />
relative densities were calculated following Pess et al. (2002). In the <strong>Skykomish</strong> braided reach,<br />
as in other large river systems of the northwest thus far studied, many fish species and age<br />
classes are absent from the majority of habitat units sampled by snorkelers (G. Pess, NOAA<br />
<strong>Fish</strong>eries, Northwest <strong>Fish</strong>eries Science Center, pers. comm.). As a result, relative abundance<br />
data are commonly dominated by zero counts; such data skew greatly reduces the power to<br />
detect statistically significant differences in density when fish are present. Except where noted<br />
otherwise (e.g. Table 4), this study reports adjusted relative fish density, defined as the fish count<br />
per square meter of survey area excluding habitat units in which no fish were observed. These<br />
‘where present’ density estimates are presented graphically together with data on the proportion<br />
of surveyed habitat units with fish present (cf. Pess et al., 2002). Note that fish densities are<br />
reported only for summer 2004, since habitat unit areas were not measured in other seasons<br />
during which snorkel surveys were performed. In this report, fall and winter 2004 relative<br />
abundance data appear as absolute counts.<br />
The assumptions of parametric statistical methodology were evaluated by conducting K-S<br />
normality tests and Bartlett’s tests for homogeneity of variance (StatView, SAS Institute Inc.).<br />
When appropriate, one-way analysis of variance (ANOVA) was performed for each life stage of<br />
each species to test whether adjusted relative density varies significantly with river system<br />
(mainstem versus side channel and among side channel systems), habitat unit type (pool, riffle,<br />
glide), within-unit survey area, and habitat-unit interface type (latter two factors evaluated only<br />
4
in mainstem). Scheffe’s tests were used for post-hoc comparisons. These analyses were<br />
conducted on summer 2004 mainstem fish densities within three reaches: (1) entire study reach<br />
(mainstem habitat units 1–74); (2) mainstem above the Startup levee (units 1–42); (3) mainstem<br />
below the Startup levee (units 43–74) (see Figs 2–6). Units 42–43 spanning the levee were<br />
selected as marking the approximate transition from higher gradient and faster flows to lower<br />
gradient and slower flows in the mainstem (cf. Appendix X). Univariate ANOVA was used to<br />
test for seasonal variation in relative abundance within the mainstem (summer versus fall 2004)<br />
and within side channel network SCC (summer versus winter 2004). This method of analysis<br />
was also applied to day versus night snorkel-survey data from side channel network SCC to<br />
assess the significance of diel variation in fish counts. When assumptions of parametric testing<br />
were not met, Kruskal-Wallis tests were used to investigate significant effects of spatial,<br />
temporal and habitat-related variation on relative fish abundance and density.<br />
Results<br />
Habitat Designations<br />
Preliminary habitat unit maps used during the 2004 fish use surveys are shown in Figures 1–7.<br />
Adjustments to these maps made in the field (cf. Reach Nomenclature section of Methods) were<br />
restricted to the mainstem channel; no changes in habitat unit type were recorded in the side<br />
channel networks. Modifications of preliminary unit type in the mainstem are not presented<br />
graphically here (see final habitat unit maps in Appendix X), but are reflected in the total count<br />
of pools, riffles and glides surveyed (Table 2). Typical mainstem habitat surveyed is illustrated<br />
in Figure 9.<br />
The four side channel networks within the study reach differ markedly in size and complexity.<br />
SCA (Fig. 3) is a single, broad channel connecting mainstem habitat units 12 (rm X) and 19 (rm<br />
X). Network SCB (Fig. 3) extends downstream from mainstem unit 15 (rm X) via a well-defined<br />
and continuously wetted channel (SCB) which rejoins the mainstem at unit 22 (rm X). Channel<br />
SCB also contributes to an intermittently wetted channel (SCB1) which rejoins the mainstem<br />
downstream at unit 30 (rm X). Network SCC (Figs 5, 7), the most complex within the<br />
<strong>Skykomish</strong> braided reach, contains two distinct systems: a series of channels whose flow<br />
originates from surface and possibly also subsurface discharge from the mainstem (channels<br />
SCC, SCC1, SCC2, SCC3) and an apparent spring brook system with flow fed by groundwater<br />
discharge (channels SBA, SBA1, SBA2, SBA3, SBA4). Collectively, this side channel network<br />
connects mainstem habitat units 49 and 58D (rm X and Y, respectively). Network SCD (Fig. 6)<br />
is comprised of a main channel extending from the mainstem pool immediately downstream of<br />
unit 74 (rm X) to the downstream terminus of the study reach, and associated side channels<br />
SCD1–SCD5. Representative habitats surveyed within the side channel networks are illustrated<br />
in Figure 9.<br />
Species/Age-Class Composition and Relative Abundance<br />
Reach-Level Patterns<br />
Washington Trout field crews made over 38,000 individual fish observations within the<br />
<strong>Skykomish</strong> River study reach during snorkel surveys in 2004. Over the course of summer, fall<br />
and winter surveys, ten species were documented in the mainstem channel and side channel<br />
networks, of which seven were salmonids: bull trout, Salvelinus confluentus; Chinook salmon,<br />
Oncorhynchus tshawytscha; chum salmon, Oncorhynchus keta; coho salmon, Oncorhynchus<br />
kisutch; coastal cutthroat trout, Oncorhynchus clarki clarki; rainbow trout/steelhead,<br />
5
Oncorhynchus mykiss; and mountain whitefish, Prosopium williamsoni. Also observed were<br />
largescale sucker, Catostomus macrocheilus; threespine stickleback, Gasterosteus aculeatus; and<br />
sculpin, Cottus sp. The relative abundance of salmonids varied among habitat units from<br />
roughly one-quarter to nearly 100% of the total fish count. In the mainstem and side channels,<br />
snorkel survey area represented 19±10% and 26±21% (mean±S.D.), respectively, of total habitat<br />
unit wetted area (Fig. 10).<br />
Over 8,500 fish belonging to eight species were observed in the braided reach mainstem, with<br />
mountain whitefish and largescale sucker among the most abundant during summer and fall<br />
surveys (Fig. 11; Tables 5, 6). Adults of these two species were observed in a large proportion<br />
of all mainstem habitat units surveyed (83% and 43%, respectively, during the summer) (Fig.<br />
12C). Anadromous salmonids were dominated by coho, Chinook and chum salmon, and resident<br />
salmonids were represented in greatest numbers by juvenile trout (Fig. 11). <strong>Fish</strong>es found only in<br />
the mainstem during the intensive summer snorkel surveys (i.e. not also observed within side<br />
channel networks) were juvenile and adult bull trout, and adult Chinook, steelhead, and<br />
largescale sucker (Fig. 12).<br />
Approximately 30,000 fish belonging to ten species were observed in the braided reach side<br />
channel networks, with juvenile coho salmon far outnumbering all other fishes in the majority of<br />
channels during summer and winter surveys (Fig. 13; Tables 7–10). In side channel networks<br />
SCB and SCC, juvenile coho were documented in 69% of all habitat units surveyed during the<br />
summer (Fig. 12A). Other salmonids observed in side channels, in order of decreasing relative<br />
abundance, were rainbow and cutthroat trout, mountain whitefish, and juvenile Chinook salmon<br />
(Fig. 13). Adult stickleback were observed at high relative densities but were patchily<br />
distributed in the side channels, occurring in just 5% of habitat units surveyed; this species was<br />
found only in the side channels (i.e. not also observed in the mainstem) (Fig. 12C).<br />
Reach-level analysis of the summer 2004 snorkel-survey data revealed distinct patterns of spatial<br />
variation in fish relative density. For several species and life stages, adjusted relative density<br />
(i.e. density evaluated in habitat units with fish present) was significantly higher in the side<br />
channel networks than in the mainstem channel. This pattern was found for juvenile Chinook<br />
and juvenile coho salmon, adult rainbow trout, and juvenile rainbow/cutthroat trout (Fig. 12A,B).<br />
A similar pattern was found for all species-summary categories examined. Although fish were<br />
present in approximately 90% of all habitat units surveyed in both the mainstem and side<br />
channels, the adjusted relative densities of all species observed, all salmonids, and ESA-listed<br />
salmonids were significantly higher in the off-channel networks (Fig. 14).<br />
Species diversity, age-class composition and relative abundance also varied between and within<br />
the side channel networks. The two major networks, SCB and SCC, contained the same seven<br />
fish species during summer snorkel surveys, but Oncorhynchus and Prosopium were represented<br />
only by juveniles in SCB while SCC held both juvenile and adult trout and whitefish (Tables 7–<br />
9). In addition, SCB during the summer contained significantly higher densities of juvenile<br />
largescale sucker (t-test: d.f.=6; P
flow system also contained significantly more fish (i.e. higher average count of all fish species<br />
within pools) during the summer than either the spring brook or mainstem (t-tests: d.f.=23, 32;<br />
P
and overall was comprised of three fewer species of salmonids than the summer population<br />
(Tables 5, 6). Chum salmon succeeded Chinook as the most prevalent adult anadromous fish<br />
(Fig. 11A,B). In addition, the ratio of juvenile-to-adult trout and salmon observed in pools fell<br />
from approximately 10 to 0.01 over this period, reflecting a pronounced change in life historystage<br />
usage of the mainstem during the day.<br />
Snorkel survey data collected during summer and winter 2004 in side channel network SCC<br />
highlights additional seasonal variation in fish relative abundance, diversity, and age class<br />
structure. Mean daytime fish counts in surface-flow and spring-brook side channel pools<br />
showed a significant decrease between the two survey seasons, a pattern also observed in<br />
mainstem pools between summer and fall (Fig. 22A). The daytime winter population in side<br />
channel network SCC lacked five species observed in the summer (rainbow and cutthroat trout,<br />
sculpin, largescale sucker and mountain whitefish) but contained adult chum salmon (Table 10).<br />
As in the mainstem, a seasonal reduction in the relative abundance of juvenile salmonids was<br />
measured in side channel network SCC. Between summer and winter, the ratio of juvenile-toadult<br />
trout and salmon observed in pools during daylight hours fell roughly 2000-fold in the<br />
surface-flow side channel system, and 20-fold in the spring brook channels. Associated with<br />
these patterns of seasonal variation in fish use was an 8–13 °C average decline in daytime water<br />
temperature in mainstem and side channel pools (Fig. 22B).<br />
Paired day–night snorkel surveys were performed in side channel network SCC in December<br />
2004 to test the hypothesis that fish are in fact present within side channel pools during the<br />
winter, but take cover during daylight hours. These surveys revealed that both juvenile and adult<br />
trout and salmon, presumably seeking refuge during the day, indeed emerge during the night.<br />
Both surface-flow and spring-brook side channel pools showed a trend toward increasing overall<br />
relative fish abundance (i.e. juveniles and adults of all species) at night; this pattern was<br />
statistically significant for pools fed by surface flow (t-test: d.f.=14; P
Chinook and chum were 14% (1 of 7 carcasses examined) and 16% (10 of 63 carcasses),<br />
respectively. The single female coho carcass found in the braided reach was also a PSM<br />
candidate, bearing full and intact egg skeins.<br />
The locations of all salmon redds and carcasses observed during the spawning surveys are shown<br />
in Figs 2–7. The general pattern evident from these maps is that the distribution of salmon<br />
spawning activity is species-specific. Chinook redds were built primarily in the mainstem, often<br />
near the channel bank (e.g. units #7–13 [Fig. 2] and unit #45 [Fig. 4]), while chum redds were<br />
most commonly found within the four side channel networks (Figs 3, 5, 6, 7, 24A). Several<br />
exceptions to this pattern of non-overlapping spawning areas are noted: Chinook and chum redds<br />
were found together within mainstem units #18–20 at the mouth of side channel network SCA<br />
(Fig. 3). The only instance of confirmed chum redds outside the immediate vicinity of a side<br />
channel was in mainstem unit #35 (Fig. 3). Chinook and chum carcasses showed a similar<br />
distribution to that of redds (Fig. 24B). Although largely restricted to distinct spawning areas,<br />
carcasses of the two species were found in proximity within side channel SCB, resembling the<br />
adjacent mainstem in its habitat unit diversity (Fig. 3), as well as in a seasonal backwater channel<br />
in the vicinity of mainstem units #42–44 (Fig. 4) and in the lower reaches of side channel SCC<br />
(Figs 5, 7). A large proportion of chum redds were occupied by live spawners (93% of mainstem<br />
redds and 86% of side channel redds), whereas Chinook redds contained live fish less frequently<br />
(22% in mainstem; 57% in side channels) (Fig. 24A).<br />
The habitat preferences of spawning salmon in the braided reach were examined in detail by<br />
analyzing the physical characteristics of redd sites. The majority of Chinook redds were<br />
observed in glides, while a large proportion of chum redds were built in pools; for both species,<br />
riffle habitats were also frequently selected for spawning (Fig. 25A,B). Chinook redds were<br />
constructed almost exclusively in large cobble; chum salmon utilized a variety of substrates,<br />
including cobble, gravel and sand (Fig. 25C,D). The depth of water in which redds were<br />
constructed did not differ significantly between Chinook (mean 13.4 in.) and chum (mean 16.4<br />
in.) (t-test: d.f.=116; P=0.09).<br />
Washington Trout’s spawning surveys were generally more extensive in their geographic<br />
coverage than were snorkel surveys within a given channel system. Accordingly, the spawning<br />
surveys provided information about fish use that helped refine the distributional data obtained<br />
from snorkel surveys earlier in the year. For example, the small left-bank braid of the mainstem<br />
at habitat units #38–39 was dry during summer 2004 and excluded from snorkel surveys. In<br />
November, the same channel was found to contain the highest density of chum salmon redds<br />
within the braided reach (Fig. 4).<br />
Sources of Sampling Bias<br />
Discussion<br />
<strong>Fish</strong> Abundance and Density<br />
<strong>Fish</strong> counts obtained by snorkel survey typically underestimate the “true” number of fish present<br />
in a habitat unit as determined by more accurate methods of measuring fish abundance (e.g.<br />
electrofishing/removal, mark–recapture) (Rodgers et al., 1992). The calibration recommended<br />
by Hankin and Reeves (1988) involving adjustment of snorkel counts by the ratio of “true” fish<br />
numbers to snorkel estimates was not performed in this study because exhaustive removal<br />
methods were not feasible in the large habitat units surveyed (see also Thompson and Lee, 2000;<br />
9
Burnett, 2001). Accordingly, the <strong>Skykomish</strong> River snorkel counts are assumed to be negatively<br />
biased, but since the amount of bias is unknown they are used only to provide estimates of<br />
relative abundance and density.<br />
Snorkel-survey area represented an approximately constant proportion of total habitat unit<br />
wetted area for small and intermediate-sized units in both the mainstem and side channels. For<br />
the largest units sampled (>25,000 m 2 in the mainstem and >7,000 m 2 in the side channels),<br />
however, survey area comprised a disproportionately small fraction of total unit area (Fig. 10).<br />
Hence, fish densities recorded for these largest units may be artificially low due to sampling<br />
bias. The inverse relationship between Oncorhynchus mykiss density and habitat unit area (Fig.<br />
16) suggests preferential use of smaller units by juvenile and adult trout, but it is important to<br />
recognize that true densities in the largest units may be higher than those observed.<br />
Water velocities in the <strong>Skykomish</strong> mainstem prevented snorkelers from surveying in an<br />
upstream direction, as is typical in studies of smaller river systems (e.g. Hankin and Reeves,<br />
1988) to avoid disturbing or displacing fish. This study, therefore, was subject to potential<br />
observer bias in fish distribution within habitat units. However, a consistent pattern of declining<br />
relative abundance from upstream to downstream within units, an expected result of such bias,<br />
was not observed.<br />
Variation in water clarity during summer and fall snorkel surveys must also be taken into<br />
consideration when interpreting the relative fish abundance patterns described here. The marked<br />
seasonal decline in fish counts within the mainstem and side channels (Figs 21, 22) is likely due<br />
in part to reduced daytime visibility during surveys performed later in the year (Table 1).<br />
Patterns of <strong>Fish</strong> Density in the <strong>Skykomish</strong> and Other Northwest Rivers<br />
Comparison of fish abundance data among river systems is complicated by variation in<br />
enumeration methodology used in different studies (Lister and Genoe, 1970; Rodgers et al.,<br />
1992). Such comparison is further confounded by sampling performed at different times of year<br />
and by the use of different means for calculating relative fish density. To facilitate accurate<br />
comparison of relative density data from the <strong>Skykomish</strong> River braided reach and from other<br />
large northwest river systems we examine below densities derived from snorkel surveys of the<br />
same season and consider different density metrics separately.<br />
The traditional index of mean relative fish density, widely reported in fish use studies, is the<br />
average number of individuals observed per unit area in all habitat units surveyed, including<br />
those units with fish absent. For juvenile salmon and trout in the <strong>Skykomish</strong> braided reach, this<br />
traditional density measure falls within the ranges reported for other northwest river systems.<br />
Specifically, the average relative densities of juvenile trout and Chinook salmon measured<br />
during summer in the <strong>Skykomish</strong> mainstem (Table 4) match those documented in other large<br />
river mainstems (i.e. >50 m bankfull width), including the Wenatchee (WA) and Grande Ronde<br />
(OR) (Table 15) (see also review by Bartz et al., 2006).<br />
An alternative mean density index, which excludes from consideration all surveyed habitat units<br />
with fish absent, can be employed when fish are patchily distributed among units to facilitate<br />
parametric statistical analyses (cf. Methods). This adjusted relative fish density, or “where<br />
present” density index, is not currently in widespread use but here is compared among sites for<br />
which data are available. The mean adjusted relative densities of adult Chinook salmon,<br />
10
steelhead and whitefish measured in the <strong>Skykomish</strong> River mainstem during summer snorkel<br />
surveys (Fig. 12A–C) are very similar to those reported by Pess et al. (2002) for the North Fork<br />
Stillaguamish River (WA). In addition, juvenile salmon and trout exhibited mean summer<br />
“where present” densities in the <strong>Skykomish</strong> mainstem (Fig. 12A,B) that closely match those<br />
recorded for the mainstem Elwha River (WA) (Pess et al., 2002). In off-channel habitat, mean<br />
adjusted relative densities of juvenile salmonids from the <strong>Skykomish</strong> and Elwha in summer<br />
show general agreement with the exception of juvenile Chinook, for which average summer<br />
“where present” densities were an order of magnitude higher in the <strong>Skykomish</strong> side channel<br />
networks (cf. Fig. 12A, Table 15).<br />
Patterns of spatial and temporal variation in fish density in the <strong>Skykomish</strong> braided reach are also<br />
largely consistent with those documented in other large northwest rivers. The relatively great<br />
abundance of juvenile coho salmon in side channel network SCC during summer (Fig. 13B,C)<br />
reflects the well-documented importance of off-channel floodplain habitat for coho rearing (e.g.<br />
Nickelson et al., 1992). Juvenile coho counts in side channel network SCC exceeding those in<br />
side channel network SCB and in the <strong>Skykomish</strong> mainstem (Figs 11A, 13) may be related to<br />
site-specific variation in water temperature. Mean summer temperatures measured in pools were<br />
up to 8 °C cooler in side channel network SCC than in network SCB or the mainstem, reflecting<br />
the possible use by juvenile coho of groundwater-influenced off-channel habitat in network SCC<br />
as thermal refugia (cf. Brown, 2002).<br />
The marked decline in relative fish abundance between summer and fall/winter measured in the<br />
<strong>Skykomish</strong> during daylight hours (Fig. 22A) is likely related to the reduced swimming<br />
performance of fish at low temperatures. As reviewed by Brown (2002), juvenile salmonids<br />
may migrate to protected sites, including the interstices of river bed substrate, to avoid predation<br />
and to reduce energy expenditure when swimming ability is compromised. The diel variation in<br />
fish counts recorded in December 2004 within <strong>Skykomish</strong> side channel network SCC (Fig. 23)<br />
matches a general behavioral pattern documented for salmonids during winter: residing in cover<br />
during the day and emerging to feed at night (Lister and Genoe, 1970; Hillman et al., 1989;<br />
Peters et al., 1998; Brown, 2002).<br />
The hypothesis that habitats with relatively great physical heterogeneity support higher densities<br />
of fish than more homogeneous habitats received partial support from this study. In the<br />
<strong>Skykomish</strong> mainstem, juvenile salmonids exhibited significantly higher relative densities at the<br />
edges of habitat units, especially those with marginal woody debris and riprap, than in the center<br />
of units (Fig. 18D, Table 11). A similar pattern has been noted for juvenile salmonids in other<br />
Pacific Northwest rivers (e.g. Lister and Genoe, 1970; Cramer, 2001; Jeanes and Hilgert, 2001;<br />
Brown, 2002; Beamer et al., 2005). The concentration of adult fish in the less physically<br />
complex centers of habitat units (Fig. 18A–C) may be a function of the relative scarcity of large<br />
woody debris in the <strong>Skykomish</strong> mainstem and of the ability of adults to navigate more<br />
effectively the higher water velocities of the thalweg. Despite the presumed physical<br />
heterogeneity of habitat unit interfaces (cf. Fig. 8), neither juvenile nor adult fish showed their<br />
highest relative densities in these areas, typically aggregating more densely in the adjacent,<br />
longitudinal “middles” of units (Fig. 19). It is notable, however, that salmonids were more<br />
frequently observed in these transitional habitats, raising the possibility that unit interfaces<br />
support relatively low-density, evenly distributed populations rather than function as discrete<br />
distributional “hot spots.” Further study of transitional habitats in the <strong>Skykomish</strong> and other river<br />
systems is warranted to improve our understanding of the relationship between fish use and<br />
habitat complexity.<br />
11
Patterns of Salmon Spawning Activity<br />
Spawning surveys of the <strong>Skykomish</strong> braided reach performed independently by Washington<br />
Trout and by Washington Department of <strong>Fish</strong> and <strong>Wild</strong>life (WDFW) in fall 2004 allow a<br />
valuable comparison of redd count data collected by different techniques. During the two weeks<br />
for which data are available from both sources, redd counts obtained by boat and on foot (WT)<br />
closely match those obtained by aerial survey (WDFW). Specifically, 118 Chinook redds were<br />
counted by WDFW on September 26, 2004 between “Big Eddy” in Gold Bar, WA to the mouth<br />
of the Sultan River; 85 Chinook redds were counted by WT four days later in the same reach. At<br />
the end of the Chinook spawning run, WT and WDFW each recorded zero Chinook redds<br />
(surveys on November 9 and November 10, 2004, respectively) (Table 12; Jackson, 2005b). The<br />
total number of Chinook redds documented by WT in the <strong>Skykomish</strong> braided reach during fall<br />
2004 (136), however, represents roughly one-third of the total tally reported by WDFW (418)<br />
(Jackson, 2005a). This discrepancy may reflect differences in total area surveyed, survey effort<br />
(i.e. number of flights/surveys), error in salmon species-assignment of redds, and/or techniquespecific<br />
variation in sensitivity of redd detection.<br />
The <strong>Skykomish</strong> River 2004 redd survey data underscore the importance of the braided reach as a<br />
productive salmon spawning ground. Of 840 Chinook redds documented by WDFW in fall 2004<br />
between the mouth of the <strong>Skykomish</strong> River and the anadromous fish barrier at Sunset Falls (rm<br />
51.5), approximately 50% were observed in the braided reach. The number of Chinook redds<br />
observed per river mile in the braided reach (49.2) exceeded that in all other WDFW survey<br />
reaches on the <strong>Skykomish</strong> River in 2004 (Table 13).<br />
The documentation of pre-spawning mortality in female Chinook, chum and coho salmon within<br />
the braided reach (see Results) adds to a growing set of PSM observations across western<br />
Washington. To date, the phenomenon has been noted for several salmonid species with<br />
intensive spawning studies focused on both rural/residential habitats and urban creeks (e.g.<br />
Glasgow et al., 2005; McMillan et al., 2006; N. Scholz, NOAA <strong>Fish</strong>eries, Northwest <strong>Fish</strong>eries<br />
Science Center, pers. comm.). Ongoing work by Washington Trout and by NOAA <strong>Fish</strong>eries<br />
seeks to refine understanding of the current geographic extent of PSM in the Pacific Northwest<br />
and to identify causal factors, including patterns of land use and water quality, related to PSM<br />
incidence.<br />
12
Summary<br />
<strong>Fish</strong> species composition and relative abundance:<br />
• During summer, fall and winter 2004 snorkel surveys of the <strong>Skykomish</strong> River braided<br />
reach, ten fish species were documented in the mainstem channel and side channel<br />
networks, of which seven were salmonids and two were ESA-listed (bull trout and<br />
Chinook salmon).<br />
• Relative fish densities measured by snorkel survey during summer in the <strong>Skykomish</strong><br />
braided reach were generally similar to those recorded for other large northwest rivers.<br />
• Relative fish density was generally higher in the side channel networks than in the<br />
mainstem channel during summer. This pattern was significant for all ESA-listed<br />
salmonids encountered. Side channel pools supported relatively more fish than mainstem<br />
pools during winter.<br />
• Juvenile coho salmon far outnumbered all other fishes in the majority of side channels<br />
surveyed during summer and winter 2004, occurring in nearly 70% of all habitat units<br />
examined.<br />
• <strong>Fish</strong> species diversity, age-class composition and relative abundance varied significantly<br />
between and within the <strong>Skykomish</strong> River side channel networks.<br />
• The adjusted relative density (i.e. density measured only for habitat units with fish<br />
present) of adult and juvenile rainbow trout/steelhead exhibited an inverse relationship<br />
with habitat unit wetted area during summer.<br />
• Significantly higher densities of adult trout and salmon were observed in mainstem pools<br />
than in mainstem riffles or glides during summer. Juvenile salmonids in the mainstem<br />
were found in highest densities within riffles during summer, but in the side channel<br />
networks, no significant relationship between fish density and habitat unit type was<br />
detected.<br />
• Summer fish densities measured in the <strong>Skykomish</strong> mainstem exhibited distinct patterns<br />
of within- and between-unit spatial variation: (a) adult salmonids were typically found in<br />
higher densities within the center of habitat units than at unit edges, while juvenile<br />
salmonids aggregated more densely in edge habitat including large woody debris and<br />
riprap bank armoring; (b) adult and juvenile salmonids were more frequently observed in<br />
the transition area between habitat units than in the longitudinal “middle” of units, but<br />
within these interfaces fish densities were relatively low. Pool-riffle and riffle-pool<br />
transitions contained significantly higher salmonid densities, on average, than all other<br />
habitat unit transitions studied.<br />
• Mean daytime fish counts in both the mainstem and side channels declined sharply<br />
between summer and fall/winter. During winter, mean counts increased at night for most<br />
fish species and age classes examined.<br />
13
Summary, continued<br />
Salmon spawning activity:<br />
• During fall 2004 spawning surveys of the <strong>Skykomish</strong> braided reach, the majority of<br />
salmon carcasses encountered were female Chinook and chum of presumed natural origin<br />
(intact adipose fins). Pre-spawning mortality (i.e. death prior to egg deposition) was<br />
documented in 14% of Chinook females and 16% of chum females.<br />
• The distribution of salmon spawning activity was species-specific: Chinook redds were<br />
built primarily in the mainstem, often near the channel bank, while chum redds were most<br />
commonly found within side channels.<br />
• Redd counts obtained by boat survey and on foot approximated those obtained by<br />
WDFW aerial surveys in fall 2004. Both datasets highlight the <strong>Skykomish</strong> River braided<br />
reach as an important salmon spawning ground.<br />
14
References<br />
Bartz, K. K., Lagueux, K. M., Scheuerell, M. D., Beechie, T., Haas, A. D. and Ruckelshaus, M.<br />
H. (2006). Translating restoration scenarios into habitat conditions: an initial step in<br />
evaluating recovery strategies for Chinook salmon (Oncorhynchus tshawytscha). Can. J.<br />
<strong>Fish</strong>. Aquat. Sci. 63: 1578-1595.<br />
Beamer, E. M., Hayman, B. and Smith, D. (2005). Linking freshwater rearing habitat to Skagit<br />
Chinook salmon recovery. Appendix C of the Skagit Chinook Recovery Plan 2005. Skagit<br />
River System Cooperative, La Conner, WA, 24 pp.<br />
Brown, T. G. (2002). Floodplains, flooding, and salmon rearing habitats in British Columbia: a<br />
review. <strong>Fish</strong>eries and Oceans Canada, Canadian Science Advisory Secretariat. Research<br />
Document 2002/007, 155 pp. & appendices.<br />
Burnett, K. M. (2001). Relationships among juvenile anadromous salmonids, their freshwater<br />
habitat, and landscape characteristics over multiple years and spatial scales in the Elk River,<br />
Oregon. Ph.D. thesis, Oregon State University, Corvallis, OR.<br />
Cramer, S. P. (2001). The relationship of stream habitat features to potential for production of<br />
four salmonid species, draft report. Prepared by S.P. Cramer & Associates, Inc. February<br />
2001, Gresham, OR., viii+182 pp.<br />
EPA (2002). Guidance on choosing a sampling design for environmental data collection. EPA<br />
QA/G-5S.<br />
Snohomish River Basin Salmon Recovery Forum. (2005). <strong>Draft</strong> <strong>Final</strong> Snohomish Basin Salmon<br />
Conservation Plan. June 2005. Snohomish County Surface Water Management Division,<br />
Everett, WA.<br />
Glasgow, J., Drucker, E. and Russell, D. (2005). Land use and coho prespawning mortality in<br />
the Snohomish watershed, Washington. Poster presentation at WDFW Habitat Program's All<br />
Hands Meeting, April 26–27, 2005, Wenatchee, WA.<br />
Hankin, D. G. and Reeves, G. H. (1988). Estimating total fish abundance and total habitat area in<br />
small streams based on visual estimation methods. Can. J. <strong>Fish</strong>. Aquat. Sci. 45: 834-844.<br />
Hillman, T. W. and Chapman, D. W. (1989). Abundance, growth, and movement of juvenile<br />
Chinook salmon and steelhead. In Summer and winter ecology of juvenile Chinook salmon<br />
and steelhead trout in the Wenatchee River, Washington. <strong>Final</strong> <strong>Report</strong> to Chelan County<br />
Public Utility District, Wenatchee, WA, pp. 1-41. Don Chapman Consultants, Inc., Boise,<br />
ID.<br />
Hillman, T. W., Chapman, D. W. and Griffith, J. S. (1989). Seasonal habitat use and behavioral<br />
interaction of juvenile Chinook salmon and steelhead. I. Daytime habitat selection. In<br />
Summer and winter ecology of juvenile Chinook salmon and steelhead trout in the<br />
Wenatchee River, Washington. <strong>Final</strong> <strong>Report</strong> to Chelan County Public Utility District,<br />
Wenatchee, WA, pp. 43-82. Don Chapman Consultants, Inc., Boise, ID.<br />
15
Jackson, C. (2005a). Email to E. Drucker reporting unpublished WDFW redd count data,<br />
December 5, 2005.<br />
Jackson, C. (2005b). Email to E. Drucker reporting unpublished WDFW redd count data, June<br />
22, 2005.<br />
Jeanes, E. D. and Hilgert, P. J. (2001). Juvenile salmonid use of lateral stream habitats, Middle<br />
Green River, Washington, 2000 Data <strong>Report</strong>. Prepared by R2 Resource Consultants, Inc.<br />
July 19, 2001, Redmond, WA, viii+63 pp. & appendix.<br />
Jonasson, B. C., Carmichael, R. W. and Keefe, M. (1997). Investigations into the early life<br />
history of naturally produced spring Chinook salmon in the Grande Ronde River basin.<br />
Oregon Department of <strong>Fish</strong> and <strong>Wild</strong>life, Annual Progress <strong>Report</strong>, 1 September 1995 to 31<br />
August 1996, 28 pp.<br />
Keefe, M., Carmichael, R. W., Jonasson, B. C., Messmer, R. T. and Whitesel, T. A. (1995).<br />
Investigations into the early life history of naturally produced spring Chinook salmon in the<br />
Grande Ronde River basin. Oregon Department of <strong>Fish</strong> and <strong>Wild</strong>life, Annual Progress<br />
<strong>Report</strong>, 1 September 1993 to 31 August 1994.<br />
Lister, D. B. and Genoe, H. S. (1970). Stream habitat utilization by cohabiting underyearlings of<br />
chinook (Oncorhynchus tshawytscha) and coho (O. kisutch) salmon in the Big Qualicum<br />
River, British Columbia. J. <strong>Fish</strong>. Res. Bd Can. 27: 1215-1224.<br />
McMillan, B., Crabb, D., Staller, F., Drucker, E. and Glasgow, J. (2006). Unexpected<br />
abundance: coastal cutthroat trout (Oncorhynchus clarki clarki) as the inheritors of Seattle<br />
urban creeks in the declining presence of other wild salmonids. In review for Proceedings of<br />
the 2005 Coastal Cutthroat Trout Symposium: Biology, Status, Management, and<br />
Conservation, Port Townsend, WA.<br />
Nickelson, T. E., Solazzi, M. F., Johnson, S. L. and Rodgers, J. D. (1992). Effectiveness of<br />
selected stream improvement techniques to create suitable summer and winter rearing habitat<br />
for juvenile coho salmon (Oncorhynchus kisutch) in Oregon coastal streams. Can. J. <strong>Fish</strong>.<br />
Aquat. Sci. 49: 790-794.<br />
Pess, G. R., Liermann, M., McHenry, M., Bennett, T., Peters, R., Kiffney, P. and Coe, H. (2002).<br />
Juvenile and adult salmonid response to the placement of logjams in the Elwha and<br />
Stillaguamish Rivers: Preliminary results. <strong>Final</strong> draft submitted by NOAA Northwest<br />
<strong>Fish</strong>eries Science Center to Stillaguamish Tribe, Lower Elwha Klallam Tribe and<br />
Washington Trout, 49 pp.<br />
Peters, R. J., Missildine, B. R. and Low, D. L. (1998). Seasonal fish densities near river banks<br />
stabilized with various stabilization methods: First year report of the flood technical<br />
assistance project. Prepared by the U.S. <strong>Fish</strong> and <strong>Wild</strong>life Service December 1998, Lacey,<br />
Washington. 34 pp.<br />
Scarnecchia, D. L. and Roper, B. B. (2000). Large-scale, differential summer habitat use of three<br />
anadromous salmonids in a large river basin in Oregon, U.S.A. <strong>Fish</strong>. Manag. Ecol. 7: 197-<br />
209.<br />
16
Rodgers, J. D., Solazzi, M. F., Johnson, S. L. and Buckman, M. A. (1992). Comparison of three<br />
techniques to estimate juvenile coho salmon populations in small streams. N. Am. J. <strong>Fish</strong>.<br />
Manag. 12: 79-86.<br />
Thompson, W. L. and Lee, D. C. (2000). Modeling relationships between landscape-level<br />
attributes and snorkel counts of chinook salmon and steelhead parr in Idaho. Can. J. <strong>Fish</strong>.<br />
Aquat. Sci. 57: 1834-1842.<br />
17
Figure Legends for maps on pages 19–25<br />
Fig. 1. Overview of the <strong>Skykomish</strong> River braided reach with preliminary habitat type<br />
designations. Contiguous segments of the study reach are illustrated in greater detail in Figures<br />
2–7. Note that final habitat type designations are presented in Appendix X.<br />
Fig. 2–6. Preliminary habitat type designations and observed salmon spawning activity within<br />
the <strong>Skykomish</strong> River braided reach. Redd and carcass data were collected between September<br />
and December 2004 (Tables 1, 12).<br />
Fig. 7. Detailed view of side channel network SCC (cf. Fig. 5).<br />
18
Figure 8. Schematic illustration of the snorkel-survey subareas within each mainstem habitat<br />
unit. Two consecutive units are depicted. Ten-foot wide snorkel lanes (gray shading) defined<br />
left, center, and right subareas. Upper, middle and lower subareas of equal size were defined by<br />
transverse boundaries (approximated in the field). The area of edge habitat surveyed within each<br />
unit was taken as the sum of left and right subareas. Habitat unit interface area was taken as the<br />
sum of adjacent lower and upper subareas in consecutive units.<br />
26
Figure 9<br />
Representative <strong>Skykomish</strong> River braided reach habitats surveyed in 2004<br />
Snorkel survey of mainstem habitat unit #48 on left-bank<br />
(November 2004).<br />
Snorkel survey of isolated pool in lower reach of<br />
side channel SCB1 (August 2004).<br />
Snorkel survey of pool within side channel network SCC (December 2004).<br />
27
Figure 9 (continued)<br />
Representative <strong>Skykomish</strong> River braided reach habitats surveyed in 2004<br />
Upstream view of confluence of side channel SCC (at left)<br />
and SBA1 (October 2004).<br />
Chum redd with live fish (in background) within<br />
side channel SCC (October 2004).<br />
Spawning survey of side channel SCD (December 2004).<br />
28
Figure 10. Relationship between snorkel-survey area and total habitat unit wetted area in <strong>Skykomish</strong><br />
River braided reach during summer 2004. Linear regression lines are shown for small to intermediate<br />
sized habitat units in the mainstem (y=0.150x+323.0; r 2 =0.66) and in the side channels<br />
(y=0.133x+63.3; r 2 =0.87). In the largest units, survey area comprised a disproportionately small<br />
fraction of total unit area. Side channel data are pooled values from networks SCB and SCC.<br />
29
Figure 11. <strong>Fish</strong> species composition and relative abundance in mainstem <strong>Skykomish</strong> River<br />
braided reach assessed by seasonal snorkel surveys. Pie charts present counts of largescale<br />
sucker, mountain whitefish and ‘other’ fishes (sculpin and unidentified non-salmonid juveniles)<br />
for all pools, riffles and glides surveyed. Bar charts illustrate relative abundance of all salmonids<br />
excluding whitefish; juveniles and adults of these species are totaled separately (shown above<br />
and below dashed lines, respectively). Counts of largescale sucker and mountain whitefish are<br />
the sum of juvenile and adult counts for each species. <strong>Fish</strong> count totals: 8,206 in summer 2004<br />
(76 units surveyed); 326 in fall 2004 (20 units). All counts made during daylight hours.<br />
30
Figure 12 (legend on p. 33)<br />
31
Figure 13 (legend on p. 33)<br />
32
Figure 12. Relative densities of all fish species and age classes observed in the <strong>Skykomish</strong> River<br />
braided reach during summer 2004 snorkel surveys. The adjusted (“where present”) density of<br />
each species/age class is shown together with the proportion of surveyed habitat units with fish<br />
present. All data presented as mean±S.E.M.; densities calculated from an average of 14 habitat<br />
units per species/age class (range: 1–60 units). Significant differences in relative density<br />
between the mainstem (MS) and side channels (SC) (pooled data from networks SCB and SCC)<br />
were assessed by univariate ANOVA: *, P
Figure 14. Relative fish densities for five species categories (defined in text) from summer 2004<br />
snorkel surveys of the <strong>Skykomish</strong> River braided reach. The adjusted (“where present”) density<br />
of each category is shown together with the proportion of surveyed habitat units with fish<br />
present. All data presented as mean±S.E.M.; densities calculated from an average of 46 habitat<br />
units per category (range: 29–67 units). Significant differences in relative density between the<br />
mainstem and side channels (pooled data from networks SCB and SCC) were assessed by<br />
univariate ANOVA: *, P
Figure 15. Comparison of adjusted relative densities of (A) juvenile coho salmon and (B)<br />
juvenile largescale sucker in pools within side channel networks SCB and SCC during summer<br />
2004. Data are presented as mean±S.E.M. with number of pools sampled. Asterisks indicate<br />
significant differences in relative density at P
Figure 16. Relationship between adjusted relative fish density and habitat unit area for trout and<br />
steelhead in the <strong>Skykomish</strong> mainstem and side channels (pooled data from networks SCB and<br />
SCC) during summer 2004.<br />
36
Figure 17. Relative fish densities for different habitat unit types in the <strong>Skykomish</strong> braided reach<br />
mainstem during summer 2004. Adjusted (“where present”) densities are presented for selected<br />
species as mean±S.E.M. with associated proportions of units with fish present and number of<br />
units sampled. Asterisks indicate significant differences in relative density at P
Figure 18. Relative fish densities for habitat unit edges and centers (cf. Fig. 8) in the <strong>Skykomish</strong><br />
braided reach mainstem during summer 2004. Adjusted (“where present”) densities are<br />
presented for selected species as mean±S.E.M. with associated proportions of survey subareas<br />
with fish present and number of subareas sampled. Asterisks indicate significant differences in<br />
relative density at P
Figure 19 (legend on p. 40)<br />
39
Figure 19. Relative fish densities for habitat unit middles and adjacent unit interfaces (cf. Fig. 8)<br />
in the <strong>Skykomish</strong> braided reach mainstem during summer 2004. Adjusted (“where present”)<br />
densities are presented for selected species as mean±S.E.M. with associated proportions of survey<br />
subareas with fish present and number of subareas sampled. Asterisks indicate significant<br />
differences in relative density at P
Figure 21. Seasonal variation in <strong>Skykomish</strong> mainstem fish counts (juveniles and adults of all<br />
species; daytime surveys). Data are presented as means with S.E.M. errors bars and habitat unit<br />
sample sizes. Mean fish counts in all unit types sampled declined significantly from summer to<br />
fall (t-tests: d.f.=19, 40, 31; P
Figure 22. Spatial and seasonal variation in (A) daytime fish counts (juveniles and adults of all<br />
species) and (B) corresponding daytime temperatures in <strong>Skykomish</strong> braided reach pools. Data<br />
are presented as means with S.E.M. errors bars and pool sample sizes for the surface flow and<br />
spring brook systems within side channel network SCC (summer and winter) and for the<br />
mainstem (summer and fall) (cf. Table 1). Mean summer counts were significantly higher in the<br />
surface-flow side channels than in either the spring brook side channels or the mainstem<br />
(univariate ANOVA: P
Figure 23. Diel variation in winter fish counts (juveniles and adults of all species) for side<br />
channel pools within the <strong>Skykomish</strong> braided reach. Data from December 2004 snorkel surveys<br />
of side channel network SCC are presented as means with S.E.M. error bars and pool sample<br />
sizes. Asterisk indicates significant difference in average daytime and nighttime fish counts<br />
within surface-flow side channel pools (univariate ANOVA: P
Figure 24. Distribution of salmon redds and carcasses in the <strong>Skykomish</strong> braided reach. MS,<br />
mainstem; SC, side channels.<br />
44
Figure 25. Salmon redd counts by habitat unit type (A, B) and by substrate type (C, D). Redds<br />
for which habitat and substrate determinations were not recorded during spawning surveys are<br />
not enumerated here; see Table 12 for total redd counts.<br />
45