Seafood Watch
Pacific Salmon - Wild Fish Conservancy
Pacific Salmon - Wild Fish Conservancy
- No tags were found...

You also want an ePaper? Increase the reach of your titles
YUMPU automatically turns print PDFs into web optimized ePapers that Google loves.
<strong>Seafood</strong> <strong>Watch</strong><br />
<strong>Seafood</strong> Report<br />
Pacific Salmon<br />
Chinook salmon (Oncorhynchus tshawytscha)<br />
Chum salmon (Oncorhynchus keta)<br />
Coho salmon (Oncorhynchus kisutch)<br />
Pink salmon (Oncorhynchus gorbuscha)<br />
Sockeye salmon (Oncorhynchus nerka)<br />
Image © B. Guild Gillespie /www.chartingnature.com<br />
West Coast Region<br />
Final Report<br />
Original Report Published February 25, 2005<br />
Updated October 8, 2010<br />
Matthew Elliott<br />
Consulting Researcher
About <strong>Seafood</strong> <strong>Watch</strong>® and the <strong>Seafood</strong> Reports<br />
Monterey Bay Aquarium’s <strong>Seafood</strong> <strong>Watch</strong>® program evaluates the ecological sustainability of<br />
wild-caught and farmed seafood commonly found in the United States marketplace. <strong>Seafood</strong><br />
<strong>Watch</strong>® defines sustainable seafood as originating from sources, whether wild-caught or farmed,<br />
which can maintain or increase production in the long-term without jeopardizing the structure or<br />
function of affected ecosystems. <strong>Seafood</strong> <strong>Watch</strong>® makes its science-based recommendations<br />
available to the public in the form of regional pocket guides that can be downloaded from the<br />
Internet (seafoodwatch.org) or obtained from the <strong>Seafood</strong> <strong>Watch</strong>® program by emailing<br />
seafoodwatch@mbayaq.org. The program’s goals are to raise awareness of important ocean<br />
conservation issues and empower seafood consumers and businesses to make choices for healthy<br />
oceans.<br />
Each sustainability recommendation on the regional pocket guides is supported by a <strong>Seafood</strong><br />
Report. Each report synthesizes and analyzes the most current ecological, fisheries and<br />
ecosystem science on a species, then evaluates this information against the program’s<br />
conservation ethic to arrive at a recommendation of “Best Choices,” “Good Alternatives,” or<br />
“Avoid.” The detailed evaluation methodology is available upon request. In producing the<br />
<strong>Seafood</strong> Reports, <strong>Seafood</strong> <strong>Watch</strong>® seeks out research published in academic, peer-reviewed<br />
journals whenever possible. Other sources of information include government technical<br />
publications, fishery management plans and supporting documents, and other scientific reviews<br />
of ecological sustainability. <strong>Seafood</strong> <strong>Watch</strong>® Fisheries Research Analysts also communicate<br />
regularly with ecologists, fisheries and aquaculture scientists, and members of industry and<br />
conservation organizations when evaluating fisheries and aquaculture practices. Capture fisheries<br />
and aquaculture practices are highly dynamic; as the scientific information on each species<br />
changes, <strong>Seafood</strong> <strong>Watch</strong>’s sustainability recommendations and the underlying <strong>Seafood</strong> Reports<br />
will be updated to reflect these changes.<br />
Parties interested in capture fisheries, aquaculture practices and the sustainability of ocean<br />
ecosystems are welcome to use <strong>Seafood</strong> Reports in any way they find useful. For more<br />
information about <strong>Seafood</strong> <strong>Watch</strong>® and <strong>Seafood</strong> Reports, please contact the <strong>Seafood</strong> <strong>Watch</strong>®<br />
program at Monterey Bay Aquarium by calling (831) 647-6873 or emailing<br />
seafoodwatch@mbayaq.org.<br />
Disclaimer<br />
<strong>Seafood</strong> <strong>Watch</strong>® strives to have all <strong>Seafood</strong> Reports reviewed for accuracy and completeness by<br />
external scientists with expertise in ecology, fisheries science and aquaculture. Scientific review,<br />
however, does not constitute an endorsement of the <strong>Seafood</strong> <strong>Watch</strong>® program or its<br />
recommendations on the part of the reviewing scientists. <strong>Seafood</strong> <strong>Watch</strong>® is solely responsible<br />
for the conclusions reached in this report.<br />
<strong>Seafood</strong> <strong>Watch</strong>® and <strong>Seafood</strong> Reports are made possible through a grant from the David and<br />
Lucile Packard Foundation.
<strong>Seafood</strong> <strong>Watch</strong>® Wild Pacific Salmon Report October 8, 2010<br />
Table of Contents<br />
I. Executive Summary……………………………………………………………………….3<br />
II.<br />
III.<br />
IV.<br />
Introduction………………………………………………………………………………..7<br />
Analysis of <strong>Seafood</strong> <strong>Watch</strong>® Sustainability Criteria for Wild-caught Species…………12<br />
Criterion 1: Inherent Vulnerability to Fishing Pressure………………………………….12<br />
Criterion 2: Status of Wild Stocks……………………………………………………….38<br />
Criterion 3: Nature and Extent of Wild Stocks…………………………………………..66<br />
Criterion 4: Effect of Fishing Practices on Habitats and Ecosystems…………………...88<br />
Criterion 5: Effectiveness of the Management Regime………………………………...96<br />
Overall Evaluation and <strong>Seafood</strong> Recommendation…………………………………….105<br />
V. References………………………………………………………………………………107<br />
VI.<br />
Appendices……………………………………………………………………………...115<br />
2
<strong>Seafood</strong> <strong>Watch</strong>® Wild Pacific Salmon Report October 8, 2010<br />
I. Executive Summary<br />
This seafood report evaluates the ecological sustainability of wild-caught U.S. West Coast<br />
salmon. To make an overall recommendation, salmon fisheries have been analyzed using<br />
<strong>Seafood</strong> <strong>Watch</strong>’s five basic criteria: inherent vulnerability to fishing pressure, status of wild<br />
stocks, nature and extent of bycatch, effects of fishing methods on habitats and ecosystems, and<br />
effectiveness of the management regime. Due to the substantial variation observed between<br />
salmon fisheries, this report breaks U.S. West Coast salmon down along geographic lines (i.e.,<br />
by state – Alaska, Washington, Oregon, and California) in order to better inform consumers.<br />
The commercial salmon season in California and Oregon (south of Cape Falcon) occurs<br />
between May and September, and most product is sold fresh during these months. As a<br />
result, salmon from California and Oregon (south of Cape Falcon) is not readily available<br />
from October through April. Therefore, these fisheries are not evaluated using <strong>Seafood</strong><br />
<strong>Watch</strong>® criteria in this report, but general background information on these fisheries is<br />
included. An evaluation will be included when the season re-opens in 2011.<br />
Inherent Vulnerability<br />
Salmon have natural reproductive traits that imply a biological resilience to overfishing. They are<br />
relatively short-lived animals (two to five years on average) that release large numbers of eggs<br />
when spawning, indicating a high potential reproductive rate. However, the dependence of<br />
salmon on specific freshwater areas leaves them susceptible to habitat loss and concomitant<br />
population crashes. Notably, in the contiguous U.S. (i.e., the lower 48 states) numerous stocks of<br />
salmon have been severely depleted or entirely extirpated due to human activities. Where these<br />
downturns have occurred, remaining stocks are left considerably more vulnerable to fishing<br />
pressure. The comparatively pristine freshwater systems in Alaska have left salmon runs there<br />
comparatively resilient to fishing pressure.<br />
Stock Status<br />
As a result of habitat loss, climatic shifts, historic overfishing, and other factors, the abundance<br />
of many populations of salmon has declined substantially over the past century. Overall,<br />
Chinook, coho, sockeye, and pink salmon stocks in California, Oregon, and Washington have<br />
been significantly depleted from peak abundances, although fishing is not considered one of the<br />
primary causes of the declines in many cases. In Washington, several large runs continue to be<br />
viable. In several cases, long-term declines in abundance have been halted or reversed in the<br />
recent past. The health of Washington and Oregon (north of Cape Falcon) stocks are considered<br />
a moderate conservation concern because abundances and trends vary in space and time, with<br />
targeted stocks depleted from historical levels of abundance, but generally meeting conservation<br />
goals. In contrast, Alaskan salmon, augmented by large hatchery operations, appear to be in<br />
robust health, with record abundance and harvests over the past two decades. The status of<br />
Alaska salmon stocks is therefore a low conservation concern.<br />
Bycatch<br />
The gear employed in commercial salmon fisheries includes drift and set gillnets, purse seines,<br />
and trolling gear (also referred to as hook-and-line gear). When combined with management<br />
constraints such as area closures and gear restrictions, the methods used to catch salmon are<br />
highly selective for salmon, and overall bycatch rates appear low in all salmon fisheries.<br />
3
<strong>Seafood</strong> <strong>Watch</strong>® Wild Pacific Salmon Report October 8, 2010<br />
However, one of the inherent difficulties of managing salmon is that they are captured in mixedstock<br />
fisheries, in which salmon from a variety of different areas may be caught in the same nets<br />
or on the same hooks. This poses a particularly difficult problem in California and the Pacific<br />
Northwest where nearly thirty salmon and steelhead Evolutionarily Significant Units (ESUs)<br />
have been listed as Threatened or Endangered under the Endangered Species Act, resulting in a<br />
high conservation concern for bycatch in the Washington and Oregon (north of Cape Falcon)<br />
salmon fisheries. Regular landings of these fish remains a serious concern despite management<br />
efforts to reduce exploitation rates. In Alaska, the relative health of salmon stocks and low<br />
bycatch rates of endangered and threatened stocks from the Pacific Northwest has reduced the<br />
seriousness of the bycatch issue.<br />
Habitat Effects<br />
The gear types used in salmon fisheries (drift gillnets, purse seines, and trolling gear) rarely<br />
touch the sea floor. As such, salmon fisheries have little lasting physical impact on aquatic<br />
habitats. However, the salmon fishery system can indirectly affect aquatic habitats. Most notably,<br />
the widespread use of salmon hatcheries for conservation and fisheries augmentation purposes<br />
has, in many cases, significantly degraded the natural habitat of wild salmonids. Hatcheries have<br />
often been poorly integrated with wild runs, and can jeopardize their health especially in areas<br />
where wild salmon populations are depleted. The effects of salmon hatcheries on the health of<br />
wild salmon stocks has been empirically demonstrated in California and the Pacific Northwest,<br />
and important questions about Alaskan hatcheries remain unanswered. As such, habitat and<br />
ecosystem effects are a moderate conservation concern in Oregon (north of Cape Falcon) and<br />
Washington, and a low conservation concern in Alaska.<br />
Management<br />
Managers of U.S. West Coast salmon fisheries assess stocks on a timely basis, typically issuing<br />
preseason abundance forecasts and updating regulations as the season progresses. Managers<br />
regularly assess fisheries-dependent data, such as landings, and fisheries-independent data, such<br />
as run size, ocean conditions, and fish age, to determine stock status and fishing levels.<br />
Management does not have a track record of setting catch quotas over what its scientific advisors<br />
have recommended. Managers require specific gear types and employ closed areas to reduce<br />
wasteful discards, and actively craft fishing seasons and regulations to reduce harmful impacts<br />
on endangered or struggling stocks. However, the effectiveness of the bycatch reduction<br />
measures is not clear, as bycatch of some species has decreased, while bycatch of other species<br />
remains high, including bycatch of some ESA-listed salmonids. Alaska salmon regulations also<br />
limit gear sizes (including mesh size as well as boat and gear length) and limit the time during<br />
which gear can be in the water. Management has not prevented the long-term declines of many<br />
salmonids in Washington, Oregon, and California. Overall, management is considered<br />
moderately effective in Washington and Oregon (north of Cape Falcon) and highly effective in<br />
Alaska.<br />
Summary<br />
The fundamental finding is that Alaskan salmon fisheries, which comprise the vast majority of<br />
U.S. Pacific salmon, are very robust, and represent a Best Choice. In contrast, many of the<br />
remaining Pacific salmon stocks on the West Coast (including inland river systems) are in<br />
trouble, primarily because of damage to freshwater ecosystems that are important as spawning<br />
and rearing habitats. Historically, overfishing also has caused damage to salmon runs. Hatchery<br />
enhancement has, in some circumstances, also contributed harm. Fish from vulnerable ESUs<br />
4
<strong>Seafood</strong> <strong>Watch</strong>® Wild Pacific Salmon Report October 8, 2010<br />
occur in groups with or in proximity to fish from “healthy” stocks. As a result, some of the fish<br />
from depleted/threatened/endangered populations are caught in commercial fisheries that are<br />
directed at “healthy” stocks. This problem may occur regardless of how well-managed the<br />
commercial fisheries are. While recognizing that recreational and commercial uses are wellestablished,<br />
a strongly precautionary approach requires that vulnerable “by-catch” from mixed<br />
stocks be minimized. In general, stocks targeted by the Washington fishery are moderately<br />
healthy. Salmon from Columbia River stocks make up most of the catch north of Cape Falcon,<br />
Oregon. Based on the difference in stock composition and the Pacific Fisheries Management<br />
Council’s delineation of a single management area (extending from Cape Falcon, Oregon to the<br />
Canadian border), salmon north of Cape Falcon, Oregon are considered under the <strong>Seafood</strong><br />
<strong>Watch</strong> recommendation for Washington state. The Columbia River stocks targeted by these<br />
fisheries have generally met escapement goals in recent years and the stock is considered<br />
moderately healthy; therefore salmon caught in the ocean fisheries north of Cape Falcon, Oregon<br />
and in the Columbia River in-river fisheries are considered a Good Alternative. Please see<br />
Figure 2.13 on page 54 of this report for a map of the management area.<br />
In summary, Columbia River salmon and all Oregon salmon caught and landed north of Cape<br />
Falcon (including the Astoria port) are considered a Good Alternative., all Washington salmon<br />
are a Good Alternative, and all Alaska salmon are considered a Best Choice.<br />
Pocket guide note: It is sometimes necessary to consolidate <strong>Seafood</strong> <strong>Watch</strong><br />
recommendations for consumer pocket guides, to best reflect the product available in the U.S.<br />
seafood market.<br />
This report was last updated on October 8, 2010. Please see Appendix I for a summary of<br />
changes made at this time.<br />
Table of Sustainability Ranks<br />
Conservation Concern<br />
Sustainability Criteria Low Moderate High Critical<br />
Inherently Vulnerability √ (AK)<br />
√ (WA, OR –<br />
north of Cape<br />
Falcon)<br />
Status of Wild Stocks √ (AK)<br />
√ (WA, OR –<br />
north of Cape<br />
Falcon)<br />
Nature of Bycatch<br />
Habitat Effects<br />
Management Effectiveness<br />
√ (AK<br />
except<br />
Chinook)<br />
√ (AK)<br />
√ (AK)<br />
√ (AK Chinook)<br />
√ (WA, OR –<br />
north of Cape<br />
Falcon)<br />
√ (WA, OR –<br />
north of Cape<br />
Falcon)<br />
√ (WA, OR –<br />
north of Cape<br />
Falcon)<br />
5
<strong>Seafood</strong> <strong>Watch</strong>® Wild Pacific Salmon Report October 8, 2010<br />
About the Overall <strong>Seafood</strong> Recommendation:<br />
• A seafood product is ranked “Avoid” if two or more criteria are of High Conservation<br />
Concern (red) OR if one or more criteria are of Critical Conservation Concern (black)<br />
in the table above.<br />
• A seafood product is ranked “Good Alternative” if the five criteria “average” to<br />
yellow (Moderate Conservation Concern) OR if the “Status of Stocks” and<br />
“Management Effectiveness” criteria are both of Moderate Conservation Concern.<br />
• A seafood product is ranked “Best Choice” if three or more criteria are of Low<br />
Conservation Concern (green) and the remaining criteria are not of High or Critical<br />
Conservation Concern.<br />
Overall <strong>Seafood</strong> Recommendation:<br />
Alaska:<br />
Best Choice Good Alternative Avoid<br />
Washington and Oregon (north of Cape Falcon):<br />
Best Choice Good Alternative Avoid<br />
6
<strong>Seafood</strong> <strong>Watch</strong>® Wild Pacific Salmon Report October 8, 2010<br />
II. Introduction<br />
Pacific salmon include several species of fish belonging to the family Salmonidae and to the<br />
genus Oncorhynchus. Of the seven members of Oncorhynchus found on the West Coast, five are<br />
reviewed in this report: Chinook salmon (Oncorhynchus tshawytscha), chum salmon<br />
(Oncorhynchus keta), coho salmon (Oncorhynchus kisutch), pink salmon (Oncorhynchus<br />
gorbuscha), and sockeye salmon (Oncorhynchus nerka). The anadromous trouts (steelhead and<br />
cutthroat trout) are not reviewed here due to the absence of a major commercial fishery.<br />
Pacific salmon share some special life history characteristics. Notably, salmon are anadromous;<br />
they are born in freshwater but live their adult lives at sea. Once at sea, anadromous salmon only<br />
return to freshwater to spawn (see Important Terms, below). Generally, salmon spawn in the<br />
rivers and lakes of their birth, and do so in different seasonal “runs” (e.g., summer, fall, late-fall,<br />
winter) identified by when the fish enter freshwater. Salmon are also unusual in that they are<br />
“semelparous,” spawning only once in their lives and subsequently dying, with their very<br />
carcasses carrying marine nutrients to freshwater spawning grounds.<br />
Important Terms<br />
Anadromous – Anadromous fish are those that spend their adult life in the ocean, but migrate<br />
upriver to freshwater spawning grounds in order to reproduce.<br />
Escapement – The portion of a salmon run that is not killed or harvested and survives to<br />
reach the spawning grounds.<br />
ESU (Evolutionarily Significant Unit) – To be considered for protection under the U.S.<br />
Endangered Species Act, a group of organisms must first qualify as an “Evolutionarily<br />
Significant Unit,” or ESU. ESUs, by definition, are reproductively isolated from conspecific<br />
populations, and contribute substantially to the ecological/genetic diversity of the species. An<br />
example of an ESU is California Coastal Chinook (See “run” and “stock” below).<br />
Run – A salmon “run” is comprised of all of the salmon that migrate upstream to spawn at a<br />
specific time. It is frequently discussed in terms of a specific river, species, and season (e.g.,<br />
Sacramento River winter-run Chinook). An ESU may be comprised of a single run or<br />
multiple runs.<br />
Semelparity – A life history characteristic in which the organism dies after spawning or<br />
reproducing.<br />
Stock – The part of a fish population under consideration from the point of view of potential<br />
utilization. “Stock” can also refer to an ESU.<br />
7
<strong>Seafood</strong> <strong>Watch</strong>® Wild Pacific Salmon Report October 8, 2010<br />
In part because of the concentrated nature of salmon runs and the tremendous productivity they<br />
embody, salmon fisheries on the Pacific Coast have a notable history. Seasonal runs of salmon<br />
have long formed a staple for Native American tribes and First Nations along the West Coast,<br />
with pre-industrial harvests in some regions (e.g., California) considerably greater than they are<br />
today. The arrival of Europeans brought even greater fishing efforts. The intensive commercial<br />
salmon fishery as we know it truly began in 1864 with the introduction of canning technology to<br />
the Sacramento River (McEvoy 1986, Lichatowich et al. 1999).<br />
Despite the apparent plentitude of salmon runs, even 130 years ago the U.S. was well aware of<br />
the factors that can endanger salmon populations. In 1875, America’s first national Fish<br />
Commissioner, Spencer Baird, issued a report identifying habitat alteration, dam construction,<br />
and over-exploitation as factors with the potential to threaten salmon populations (Lichatowich et<br />
al. 1999). Unfortunately, this foresight was not sufficient to prevent declines in salmonid<br />
populations throughout California and the Pacific Northwest. Harvests in rivers throughout the<br />
contiguous U.S. generally peaked between 1880 and 1920, and have gradually declined despite<br />
management efforts. By the early 1990s, native salmon species had been extirpated from an<br />
estimated 40% of their native spawning territory in California, Idaho, and the Pacific Northwest.<br />
Moreover, numerous remaining ESUs are listed as Threatened or Endangered under the U.S.<br />
Endangered Species Act (ESA). In contrast to their southern cousins, Alaskan salmon<br />
populations have remained numerically healthy, and landings have soared over the past quarter<br />
century.<br />
Today, Pacific salmon are one of the most intensively monitored and managed groups of fish on<br />
the planet. Given their commercial importance as well as their ESA status, considerable attention<br />
is devoted to stock abundance. The species are managed by a variety of agencies including state<br />
and tribal authorities, the Pacific Fishery Management Council (PFMC), the National Marine<br />
Fisheries Service (NMFS), the North Pacific Anadromous Fish Commission, and the U.S.-<br />
Canadian Pacific Salmon Commission. 1<br />
Scope of the analysis and the ensuing recommendation:<br />
This report focuses on the five main Pacific salmon species: Chinook, chum, coho, pink, and<br />
sockeye. Steelhead trout, a related salmonid, is not assessed due to the absence of a large<br />
commercial fishery, though bycatch of steelhead is addressed. The geographic range of salmon<br />
on the coast of North America extends from Southern California through Alaska. However,<br />
because salmon from California and Oregon (south of Cape Falcon) fisheries are generally<br />
available only from May through September, they are not currently ranked in this report, but will<br />
be re-evaluated when the 2011 season opens.<br />
The status of Canadian stocks is only briefly mentioned in this report, as recommendations are<br />
specific to U.S. salmon stocks. British Columbia salmon fisheries are important, however, as the<br />
Frasier River system historically supported one of the largest salmon runs in North America.<br />
1 Unlike its southern counterpart, the North Pacific Fishery Management Council does not play an active role in<br />
salmon management.<br />
8
<strong>Seafood</strong> <strong>Watch</strong>® Wild Pacific Salmon Report October 8, 2010<br />
Availability of Science<br />
Pacific salmon are intensively managed for several reasons, including their commercial value,<br />
their anadromous nature, and the listing of depleted salmon ESUs under the Endangered Species<br />
Act. As a result, a large body of both scientific and management literature exists regarding<br />
salmon. Despite the availability of this literature, a number of difficulties in conducting a review<br />
of West Coast salmon fisheries still exist. Assessments of fisheries are complicated by the role of<br />
habitat degradation, climatic oscillations, and other non-fishery related factors in impacting<br />
stocks, as well as by the mixed-stock nature of many salmon fisheries and the shifting role of<br />
hatcheries in salmon conservation and stock augmentation. An abundance of hatchery fish can<br />
mask long-term trends in natural spawners. More importantly, because salmon return to their<br />
natal streams to spawn, there can be and often is a high level of variation between the health of<br />
salmon stocks in relatively close proximity. Given this geographic difference, along with the<br />
remaining uncertainties and complicating factors, this assessment does not claim to review each<br />
individual salmon run. Instead, it provides basic guidelines for assessment, and attempts to make<br />
recommendations on a broad regional basis.<br />
Market Availability<br />
Common and market names:<br />
o Pacific salmon:<br />
o Chinook salmon is also known as king salmon or spring salmon.<br />
o Coho salmon is also known as silver salmon.<br />
o Sockeye salmon is also known as red salmon or blueback salmon.<br />
o Chum salmon is also known as dog salmon.<br />
o Pink salmon is also known as humpback salmon.<br />
o Salmon may also be marketed by the name of their river of origin.<br />
Seasonal availability:<br />
Pacific salmon can typically be found year-round in both retail and service markets, with peak<br />
abundance varying by season and region. The 2010 fisheries for salmon from California and<br />
Oregon (south of Cape Falcon) was small and resulted in mainly a fresh supply of salmon. As<br />
such, salmon from those areas is likely no longer available in the market until the fishing season<br />
opens again in 2011. The wild supply of salmon is augmented by a comparatively small<br />
international production of farmed Pacific salmon. Additionally, large quantities of farmed<br />
Atlantic salmon are available year-round. Farmed salmon are reviewed separately in the <strong>Seafood</strong><br />
<strong>Watch</strong>® Farmed Salmon report.<br />
Product forms:<br />
Pacific salmon are marketed as canned, fresh, or frozen fillets, frozen whole fish, smoked, or<br />
value-added products (e.g., prepared meal portions).<br />
Import and export sources and statistics:<br />
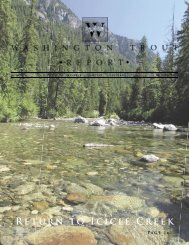
The vast majority of Pacific salmon on the U.S. market is landed domestically, with a large<br />
quantity of landings exported abroad. Since 1980, between 250,000 and 450,000 metric tons (mt)<br />
of Pacific salmon have been landed annually at U.S. ports. By quantity, the main species landed<br />
have been pink and sockeye salmon from Alaska, followed by chum salmon and to a lesser<br />
9
<strong>Seafood</strong> <strong>Watch</strong>® Wild Pacific Salmon Report October 8, 2010<br />
extent coho and Chinook salmon (NMFS 2004b). In addition to commercial landings, a thriving<br />
recreational fishery for salmon exists, and salmon remains an important subsistence fishery<br />
(particularly in Alaska).<br />
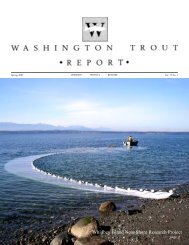
In 2002, the U.S. exported 108,000 mt of salmon worth over $330 million, consisting mainly of<br />
sockeye (44%) and pink salmon (31%). The same year, the U.S. also imported a smaller<br />
quantity of wild salmon, around 6,000 mt, primarily from Canada (NMFS 2004b). The value of<br />
imported wild Pacific salmon was approximately $18 million. Canadian exports of wild Pacific<br />
salmon to the U.S. consisted mainly of pink, chum, coho, and Chinook salmon. Small quantities<br />
of farmed Pacific salmon are also imported from Canada, and significantly larger quantities of<br />
farmed Atlantic salmon are imported from Canada, Chile, and other nations. Farmed salmon is<br />
not addressed in this report.<br />
This report evaluates the ecological sustainability of wild-caught West Coast salmon using<br />
<strong>Seafood</strong> <strong>Watch</strong>’s five basic criteria: inherent vulnerability to fishing pressure, status of wild<br />
stocks, nature and extent of bycatch, effects of fishing methods on habitats and ecosystems, and<br />
effectiveness of the management regime. Where relevant, West Coast salmon are broken by<br />
species, region, state, river of origin, or specific run.<br />
U.S. Commercial Salmon Landings by Species<br />
500,000<br />
450,000<br />
400,000<br />
Metric Tons<br />
350,000<br />
300,000<br />
250,000<br />
200,000<br />
150,000<br />
100,000<br />
50,000<br />
0<br />
Chinook<br />
Coho<br />
Chum<br />
Sockeye<br />
Pink<br />
1950<br />
1953<br />
1956<br />
1959<br />
1962<br />
1965<br />
1968<br />
1971<br />
1974<br />
1977<br />
1980<br />
1983<br />
1986<br />
1989<br />
1992<br />
1995<br />
1998<br />
2001<br />
Year<br />
10
<strong>Seafood</strong> <strong>Watch</strong>® Wild Pacific Salmon Report October 8, 2010<br />
U.S. Exports of Pacific Salmon, by Species<br />
200,000,000<br />
180,000,000<br />
160,000,000<br />
Exports (kg)<br />
140,000,000<br />
120,000,000<br />
100,000,000<br />
80,000,000<br />
60,000,000<br />
Sockeye<br />
Pink<br />
Coho<br />
Chum<br />
Chinook<br />
40,000,000<br />
20,000,000<br />
0<br />
1989 1990 1991 1992 1993 1994 1995 1996 1997 1998 1999 2000 2001 2002 2003<br />
U.S. Imports of Pacific Salmon, by Species<br />
kg<br />
200,000,000<br />
180,000,000<br />
160,000,000<br />
140,000,000<br />
120,000,000<br />
100,000,000<br />
80,000,000<br />
60,000,000<br />
40,000,000<br />
20,000,000<br />
0<br />
1989 1990 1991 1992 1993 1994 1995 1996 1997 1998 1999 2000 2001 2002 2003<br />
sockeye<br />
pink<br />
coho<br />
chum<br />
chinook<br />
11
<strong>Seafood</strong> <strong>Watch</strong>® Wild Pacific Salmon Report October 8, 2010<br />
III. Analysis of <strong>Seafood</strong> <strong>Watch</strong>® Sustainability Criteria for Wild-caught<br />
Species<br />
Criterion 1: Inherent Vulnerability to Fishing Pressure<br />
Guiding Principle: Sustainable wild-caught species have a low vulnerability to fishing pressure,<br />
and hence a low probability of being overfished, because of their inherent life history<br />
characteristics.<br />
Summary: Pacific salmon possess life history characteristics that vary by species and by<br />
Evolutionarily Significant Unit (ESU). Generally speaking, Pacific salmon have relatively<br />
resilient life histories based on their high reproductive capacity. The specifics are detailed in<br />
tabular form (Table 1.1), but include:<br />
• A young age at maturity; on average age 2 to 4 depending on the species.<br />
• A low maximum age (less than ten years) due in part to the fact that adults die after<br />
reproducing.<br />
• Relatively high fecundity, with hundreds to thousands of large eggs produced per female<br />
during reproduction.<br />
Due to their short maturation period and high fecundity, Pacific salmon are far more resilient to<br />
fishing pressure than long-lived species slow to reach maturation, or animals that bear only a few<br />
young. These reproductive traits and the high intrinsic rate of growth they imply can help salmon<br />
to recover from periods of low populations. As a result, the resilience of salmon populations is<br />
considered to be moderate to high, with a minimum doubling time between one and a half and<br />
four and a half years (Musick 1999, Froese and Pauly 2004). Other considerations aside, these<br />
factors would merit a low conservation concern for all Pacific salmonids under the Inherent<br />
Vulnerability criterion.<br />
Yet despite these relatively robust reproductive characteristics, recent history indicates that<br />
salmon are far more vulnerable than most species to anthropogenic pressures. Over 120 years<br />
ago, habitat alteration, hatcheries, dams, and over-harvesting were identified as major factors<br />
with the potential to impact the Pacific salmon industry (Lichatowich et al. 1999). Today, this list<br />
remains essentially unchanged. By the early 1990s, native salmon had been extirpated from<br />
roughly 40% of their original range in California, Oregon, Washington, and Idaho (Anderson<br />
1993). Given the empirical success of America in decimating numerous salmon populations, it is<br />
clear that the fish have a higher inherent vulnerability than their age at maturation might<br />
otherwise suggest. There are reasons to suggest that many populations of Pacific salmon have<br />
characteristics apart from their life-cycle that increase their vulnerability to fishing pressure.<br />
First, salmon are anadromous, spawning in freshwater but living the bulk of their adult lives at<br />
sea. Far more so than the marine environment, many freshwater habitats have been highly<br />
degraded by humans, thereby increasing the vulnerability of populations dependent upon them.<br />
In many cases, habitat destruction from a variety of human activities (e.g., dams, logging, water<br />
diversions, etc.) has already combined with other factors such as pollution, introduced species,<br />
12
<strong>Seafood</strong> <strong>Watch</strong>® Wild Pacific Salmon Report October 8, 2010<br />
and fishing to exterminate or endanger salmon runs. These habitat losses have been particularly<br />
evident in the southern half of salmon’s North American range.<br />
Second, salmon have a highly developed “homing” instinct, generally returning to the specific<br />
lakes and rivers of their birth. This homing instinct is a fundamental component of salmon<br />
biology, and is largely responsible for the formation of discrete populations. While the degree of<br />
homing (and its opposite, “straying”) varies across species and locations, homing creates<br />
reproductive isolation and helps to facilitate localized adaptation (Stewart et al. 2003). The<br />
combination of isolation and adaptation has led to the evolution of numerous Evolutionarily<br />
Significant Units (ESUs), which are treated under Endangered Species Act legislation as separate<br />
species. As a consequence of the diversity of Pacific salmon ESUs, the loss of local populations<br />
increases the chance of losing overall genetic diversity.<br />
Third, Pacific salmon populations are subject to natural fluctuations that can increase their<br />
vulnerability. Salmon populations are strongly influenced by changing atmospheric–oceanic<br />
conditions on a number of different temporal scales. Changes in climate affect oceanic structure<br />
and can generate significant and often sudden differences in salmon marine survival and returns<br />
(Francis and Hare 1994). These include both the subdecadal variability of the El Nino Southern<br />
Oscillation (ENSO) and the longer-scale (50-70 years) climate oscillations that have operated<br />
over the North Pacific for at least the past three centuries.<br />
Over the long-term, sediment cores indicate that sockeye salmon populations have undergone<br />
significant swings during the past two millennia (Finney et al. 2002). For example, populations<br />
were depressed from ~ 100 BC to AD 800, but consistently higher from AD 1200 to 1900.<br />
Similarly, Bristol Bay sockeye salmon have undergone several major shifts over the past three<br />
centuries (Finney et al. 2000). In the medium-term, regime shifts in the subarctic and California<br />
Current ecosystems associated with the Pacific Decadal Oscillation (PDO) have strongly<br />
influenced salmon productivity. A regime shift during the late 1970s (and again in the late<br />
1980s) appears to have reduced oceanic survival of salmon in the Pacific Northwest, while<br />
increasing oceanic survival in Alaska (Hare et al. 1999, Tolimieri and Levin 2004). Hilborn,<br />
Quinn et al. (2003) note that “the productivity of Alaskan sockeye salmon populations appears to<br />
be among the more sensitive biological systems that respond to interdecadal climate shifts and is<br />
strongly coherent with changes in the Pacific Decadal Oscillation.”<br />
In the near-term, smaller scale environmental conditions have significant effects on salmon<br />
population variability. One recent study documents that early marine survival of three species of<br />
salmon from Washington to Alaska is strongly influenced by sea surface temperature (SST)<br />
within a few hundred kilometers of the stock’s natal stream (Mueter et al. 2002). SST is likely a<br />
proxy for changes in ecological interactions in the marine realm. The authors found that survival<br />
of pink, sockeye, and chum salmon was strongly affected by the oceanic processes related to<br />
SST, and that these effects were consistent across species. Interestingly, it appears that water<br />
conditions during the salmon’s first few months at sea have a greater influence on salmonid<br />
survival than larger-scale variability associated with the PDO. Complicating the management<br />
picture, stocks of even the same species may react in a non-uniform manner to changing climatic<br />
conditions (Tolimieri and Levin 2004).<br />
While these fluctuations demonstrate that shifts between productivity regimes occur outside of<br />
the influence of anthropogenic factors, human pressures can add to the natural instability facing<br />
13
<strong>Seafood</strong> <strong>Watch</strong>® Wild Pacific Salmon Report October 8, 2010<br />
salmon. Finney, Gregory-Eaves et al. (2002) conclude that “a more thorough understanding of<br />
the linkages between climatic change and ocean ecosystems is critical for future sustainable<br />
management of northern Pacific fisheries, as fish stocks are now faced with many additional<br />
stresses including commercial fishing, habitat degradation and global warming.”<br />
These fluctuations are compounded by the fact that Pacific salmon are semelparous (PFMC<br />
2004a). Ecological studies indicate that semelparity increases the amplitude of population<br />
fluctuations and reduces the “effective” population size of some salmonid populations by<br />
roughly one half (Waples 2002). In contrast to semelparity, larger population sizes tend to<br />
dampen natural fluctuations due in part to a more complex spatial and genetic structure and<br />
wider spatial distribution (Einum et al. 2003). As a corollary, it would seem that the reduced<br />
populations now seen in West Coast salmon runs are likely to be effectively both smaller and<br />
less stable than their numbers imply.<br />
As a result of these factors—most notably habitat loss—Pacific salmon in the southern half of<br />
the North American range (California, Oregon, Washington, and Idaho) have proven to be more<br />
vulnerable than reproductive capacity would otherwise suggest. The reduced resilience depresses<br />
the ability of salmon runs to sustain fishery pressure. Consequently, the inherent vulnerability<br />
ranking for salmon in Washington and Oregon (north of Cape Falcon) is downgraded from<br />
resilient (low conservation concern) to moderately resilient (moderate conservation concern).<br />
The geographic division of southern North American versus Alaska corresponds roughly to a<br />
species division as well: Chinook and coho runs have lost the largest share of habitat, while pink,<br />
chum, and sockeye salmon in Alaska have been less impacted to date. Alaskan freshwater habitat<br />
overall has remained relatively pristine, and salmon originating in Alaska do not share the same<br />
vulnerabilities as those in California and the Pacific Northwest.<br />
Table 1.1 provides a summary of relevant life-history factors, and Table 1.2 summarizes Pacific<br />
salmon habitat degradation in North America. The tables are followed by in-depth species-byspecies<br />
assessments of inherent vulnerability.<br />
14
<strong>Seafood</strong> <strong>Watch</strong>® Wild Pacific Salmon Report October 8, 2010<br />
Table 1.1. Life history information for commercially important Pacific salmon.<br />
COMMON<br />
NAME<br />
Chinook<br />
Coho<br />
Chum<br />
Pink<br />
Sockeye<br />
SPECIES RANGE 2<br />
Arctic and Americas:<br />
Ventura River, CA to<br />
Point Hope, AK. Asia:<br />
Japan, Sea of Japan,<br />
Bering Sea, and Sea of<br />
Okhotsk<br />
N. America: Baja<br />
California to Kotzebue<br />
Sound, AK; Aleutian<br />
Islands. Asia: Kamchatka,<br />
Hokkaido, and Korea.<br />
CoA in N. America: OR<br />
to SE AK.<br />
Arctic and Americas:<br />
Sacramento River, CA to<br />
Mackenzie River,<br />
Canada. Asia: Kyushu,<br />
Japan to Lena River,<br />
Siberia, Bering Sea, Sea<br />
of Okhotsk.<br />
Arctic and Americas: CA<br />
to AK, Aleutian Islands.<br />
Asia: Bering Sea,<br />
Okhotsk Sea, Korea,<br />
Hokkaido, Russia.<br />
Americas: Klamath River,<br />
CA to Bathurst Inlet,<br />
Canada. Asia: Hokkaido<br />
to Anadyr River, Siberia.<br />
CoA: Bristol Bay, AK.<br />
GROWTH<br />
RATE/MAX<br />
SIZE<br />
Max Size: 50<br />
kg, 150 cm TL<br />
(total length)<br />
Max Size: 15<br />
kg, 110 cm TL<br />
male, 66 cm TL<br />
female<br />
Max Size: 16<br />
kg, 100 cm FL<br />
(fork length)<br />
K: 0.27-0.45<br />
Max Size: 7 kg,<br />
76 cm TL<br />
Max Size: 8 kg,<br />
84 cm TL male,<br />
71 cm TL<br />
female<br />
K: 0.37-0.58<br />
AGE at<br />
MATURITY<br />
Mean age at<br />
maturity: 4 years.<br />
Range: 2-7 years.<br />
Mean age at<br />
maturity: 3 years.<br />
Range: 2-4 years.<br />
Mean age at<br />
maturity: 3-4<br />
years. Range: 2-5<br />
years<br />
Mean age at<br />
maturity: 2 years.<br />
Range: Almost<br />
exclusively 2<br />
year olds (odd +<br />
even year<br />
populations)<br />
Mean age at<br />
maturity: 3 years.<br />
Range: 2-7 years<br />
in different<br />
stocks.<br />
LONGEVITY FECUNDITY LITERATURE<br />
Maximum<br />
reported age: 9<br />
years<br />
Maximum<br />
reported age: 5<br />
years<br />
Maximum<br />
reported age: 6<br />
years<br />
Maximum<br />
reported age: 3<br />
years<br />
Maximum<br />
reported age: 7<br />
years<br />
Fecundity: 1,200-<br />
14,000 eggs<br />
Fecundity: 1,400-<br />
4,500 eggs<br />
(Delaney 1994, Myers et<br />
al. 1998, DFO 2001,<br />
Froese and Pauly 2004)<br />
(Elliott 1994, DFO 2001,<br />
2003, Froese and Pauly<br />
2004, PFMC 2004a)<br />
Fecundity: 700-<br />
(Buklis 1994, Froese and<br />
7,000 eggs (2,400-<br />
Pauly 2004)<br />
3,100 typical)<br />
Fecundity: 800-<br />
2,000 eggs<br />
Fecundity: 2,000-<br />
4,500 eggs<br />
(Kingsbury 1994, Froese<br />
and Pauly 2004, PFMC<br />
2004a).<br />
(ADFG 1994, NMFS<br />
2001a, Froese and Pauly<br />
2004)<br />
2 CoA = Center of Abundance<br />
15
<strong>Seafood</strong> <strong>Watch</strong>® Wild Pacific Salmon Report October 8, 2010<br />
Table 1.2. Vulnerability of Pacific salmon. 3<br />
STATE<br />
California<br />
Oregon<br />
Washington<br />
Alaska<br />
PERCENTAGE of<br />
ALL U.S. PACIFIC<br />
SALMON LANDED<br />
SINCE 1950 4<br />
Chinook 21%<br />
Coho 2%<br />
Chinook 17%<br />
Coho 10%<br />
Sockeye < 0.01%<br />
Pink < 0.01%<br />
Chinook 23%<br />
Coho 23%<br />
Chum 10%<br />
Sockeye 6%<br />
Pink 4%<br />
Pink 96%<br />
Sockeye 94%<br />
Chum 90%<br />
Coho 65%<br />
Chinook 39%<br />
COMPOSITION of<br />
SALMON LANDED<br />
WITHIN GIVEN<br />
STATE SINCE 1950 5<br />
Chinook 88.1%<br />
Coho 11.9%<br />
Chinook 54.7%<br />
Coho 43%<br />
Chum 0.7%<br />
Sockeye 0.7%<br />
Pink 0.7%<br />
Sockeye 23.9%<br />
Coho 22%<br />
Chum 18.7%<br />
Pink 18.5%<br />
Chinook 16.9%<br />
Pink 40.3%<br />
Sockeye 34.7%<br />
Chum 16.5%<br />
Coho 5.9%<br />
Chinook 2.6%<br />
HYDROELECTRIC<br />
FACILITIES<br />
Significant in-state<br />
hydro-generation,<br />
equivalent to Oregon.<br />
40 billion mWh 6<br />
generation<br />
200+ large dams on<br />
Columbia, 90% without<br />
fish ladders, 1,000+<br />
smaller dams; Majority<br />
of Snake River<br />
obstructed. 40 billion<br />
mWh generation<br />
200+ large dams on<br />
Columbia, 90% without<br />
fish ladders, 1,000+<br />
smaller dams; Majority<br />
of Snake River<br />
obstructed. 80 billion<br />
mWh generation<br />
160 dams; ~1% of WA<br />
hydroelectric generation<br />
LOGGING<br />
85% loss coastal<br />
redwood forests; 90%<br />
loss Central Valley<br />
forests; 90-98% loss Sac.<br />
River riparian forests<br />
96% coastal temperate<br />
rainforest logged; 80%<br />
Douglas-fir old growth<br />
forests logged<br />
75% coastal temperate<br />
rainforest logged; 90%<br />
Douglas-fir old growth<br />
forests logged<br />
11% coastal forests<br />
logged<br />
WETLAND LOSSES<br />
91% all wetlands lost;<br />
94% inland wetlands lost;<br />
62% salt marsh lost; 69%<br />
tule marsh lost<br />
1/3 of wetlands lost since<br />
1780<br />
1/3 of wetlands lost since<br />
1780<br />
0.1% wetland losses<br />
INTRODUCED<br />
SPECIES<br />
~200 introduced fish<br />
species. Brook trout in<br />
20 drainages; mainly<br />
Sierra Nevada.<br />
~70 introduced fish<br />
species.<br />
Significant negative<br />
effects documented from<br />
brook trout in Columbia,<br />
Snake, Rogue, etc.<br />
~70 introduced fish<br />
species.<br />
Significant negative<br />
effects documented from<br />
brook trout in Columbia,<br />
Snake, Rogue, etc.<br />
< 10 introduced fish<br />
species – brook trout<br />
insignificant factor.<br />
3 Sources: Noss 2004; EIA 2002; Noss et al. 1995; USGS 2004; Schmidt 1994; Fuller 2003; DFG 2003; Levin et al. 2002.<br />
4 The column reflects the state-by-state distribution of Pacific salmon landings totaled over the past fifty years. It is intended to serve as a rough proxy for the distribution of<br />
salmon habitat, though it has several shortcomings. Most notably, the shortcomings include: 1) it shows variable fishing effort across species and states (landings do not<br />
correspond to habitat); 2) it does not account for the considerable habitat loss that occurred before 1950; and 3) it ignores the presence of rare populations.<br />
5 In-state commercial landings since 1950 is intended to better reflect relative abundance of each species within states. It is subject to the same qualifications and caveats as<br />
the preceding column. In addition, significant changes in harvests and management have occurred over the past twenty years.<br />
6 mWh = megawatt hour (one million watt-hours), a unit of electrical generation.<br />
16
<strong>Seafood</strong> <strong>Watch</strong>® Wild Pacific Salmon Report October 8, 2010<br />
Chinook Salmon (Oncorhynchus tshawytscha)<br />
Chinook salmon, also called king or spring salmon, is the largest of the Pacific salmon species,<br />
with adult fish commonly exceeding 30 pounds. Chinook salmon is Alaska’s state fish and<br />
represents an important commercial and recreational species throughout the northern Pacific<br />
(Delaney 1994).<br />
Distribution<br />
In North America, the natural range of freshwater habitats for Chinook salmon stretches from the<br />
Ventura River in California northward to Kotzebue Sound in Alaska (Figure 1.1) (DFO 2001).<br />
Once at sea, Chinook may swim anywhere from the U.S.-Mexico border to the Chukchi Sea off<br />
of Alaska.<br />
On the Asian side of the Pacific, Chinook occur in freshwater from the Anadyr River area of<br />
Siberia (64 degrees north) southward to Hokkaido, Japan. In marine waters, they are found in the<br />
Sea of Japan, Bering Sea, and Sea of Okhotsk (Delaney 1994, Froese and Pauly 2004).<br />
ESUs<br />
In the contiguous U.S., 17 ESUs of Chinook salmon have been identified:<br />
• Sacramento River Winter-run<br />
• Upper Columbia River Spring-run<br />
• Snake River Spring/Summer-run<br />
• Snake River Fall-run<br />
• Puget Sound<br />
• Lower Columbia River<br />
• Upper Willamette River<br />
• Central Valley Spring-run<br />
• California Coastal<br />
• Central Valley Fall and Late Fall-run<br />
• Upper Klamath-Trinity Rivers<br />
• Oregon Coast<br />
• Washington Coast<br />
• Middle Columbia River Spring-run<br />
• Upper Columbia River Summer/Fall-run<br />
• Southern Oregon and Northern California Coastal<br />
• Deschutes River Summer/Fall-run<br />
As of June 2004, two of these 17 ESUs (Sacramento River Winter-run and Upper Columbia<br />
River Spring-run) were listed as Endangered Species. In addition, seven of the 17 ESUs were<br />
listed as Threatened Species, and one ESU (Central Valley Fall and Late Fall-run) was<br />
designated a Species of Concern (NMFS 2004a).<br />
In Alaska, Chinook salmon are managed on a regional basis, rather than dividing the species into<br />
ESUs. The four overarching regions in Alaska are: Southeast Alaska, Central Region, Westward<br />
Region, and Arctic-Yukon-Kuskokwim Region. Chinook salmon are predominantly harvested in<br />
17
<strong>Seafood</strong> <strong>Watch</strong>® Wild Pacific Salmon Report October 8, 2010<br />
Southeast Alaska, but significant commercial landings are taken in all four regions. Once in<br />
Alaska’s interior, it is unclear where many fish go to spawn.<br />
Life History Traits<br />
As with most Pacific salmon, Chinook salmon are anadromous. Many Chinook salmon make farreaching<br />
freshwater spawning migrations to reach home streams that form the tributaries to<br />
larger river systems (Delaney 1994). These spawning habitats can lie relatively close to the coast<br />
or over 3,000 kilometers upriver (PFMC 2004a). For example, Yukon River Chinook spawners<br />
bound for Yukon Territory, Canada, can travel more than 3,000 river kilometers during a 60-day<br />
period. Chinook do not feed during their return freshwater migrations, and their bodies gradually<br />
deteriorate as their energy stores are used up over the course of the run and in the production of<br />
gametes (Delaney 1994).<br />
Adult Chinook typically spend between one and four years in the ocean before returning to<br />
spawn. Chinook salmon usually become sexually mature between their second and sixth year,<br />
with a maximum reported age of nine years. As a result, they also vary greatly in size, ranging<br />
from less than four pounds to well over fifty pounds (Delaney 1994). Most returning Chinook<br />
salmon are between three and five years old (PFMC 2004a), though a significant fraction of<br />
Chinook salmon mature at age two to three after spending only one winter in the ocean. These<br />
precocious fish are commonly referred to as “jacks” and are usually males (Delaney 1994,<br />
PFMC 2004a).<br />
During spawning, female salmon each typically deposit several thousand eggs in several gravel<br />
nests, called redds (Delaney 1994, Myers et al. 1998). Generally, redds are located in stream<br />
bottoms with specific characteristics including clear water and gravel of a size that can be<br />
manipulated by the fish (PFMC 2004a). In Alaska, eggs usually hatch in late winter or early<br />
spring, depending on time of spawning and water temperature (Delaney 1994). The newly<br />
hatched fish, called fry, live in the gravel for several weeks, absorbing the food in their attached<br />
yolk sacs. These fry then emerge, and, after maturing into smolts capable of living in salt water,<br />
migrate downstream towards the ocean, though they may pause in lakes or estuaries before<br />
entering the marine environment (PFMC 2004a). In Alaska, most juvenile Chinook salmon<br />
remain in fresh water for a year, and migrate to the ocean in their second year of life (Delaney<br />
1994). Once at sea, Chinook salmon can travel widely. The adult fish prey on a wide diversity of<br />
organisms, including “fish, squid, euphausiids, amphipods, copepods, pteropods, crustacean<br />
larvae, gelatinous zooplankton, polychaetes, chaetognaths, and appendicularia” (Kaeriyama et al.<br />
2004).<br />
Despite these commonalities, Chinook salmon also show significant life history variation<br />
between fish. Scientists have identified two kinds of Chinook salmon, one called stream-type and<br />
the other called ocean-type (Myers et al. 1998). There are significant differences in the age at<br />
which they move to the sea, their migration patterns, and spawning times, between the two types<br />
of Chinook. Stream-type Chinook spend more time in streams (one to two years) before they<br />
head out to the ocean. Once they are in salt water they make long voyages away from their natal<br />
streams and come back early before spawning. Adult stream-type Chinook typically enter rivers<br />
in the spring and summer, and spawn in late summer or early fal1 (PFMC 2004a). Conversely,<br />
ocean-type Chinook spend less time in fresh water (just a few days to months), though they may<br />
remain longer in estuarine areas. Once ocean-type Chinook reach the ocean they stay close to<br />
their natal streams, but only return to freshwater just before spawning (Delaney 1994, DFO<br />
18
<strong>Seafood</strong> <strong>Watch</strong>® Wild Pacific Salmon Report October 8, 2010<br />
2001). Generally, the timing of returns of ocean-type Chinook varies between late summer and<br />
the winter months, though in some river systems the fish may return for much of the year (PFMC<br />
2004a).<br />
The seasonal variation in salmon spawning is important as the same river system can support<br />
several runs of salmon. The 2004 PFMC Environmental Assessment notes that “not all runs<br />
types are equally abundant. In Oregon and Washington, spring (March through May) and fall<br />
(August through November) Chinook runs are most common; a few stocks run in summer (May<br />
through July). In California there are also late fall and winter runs (December through July) in<br />
the Sacramento River. A late fall run has also been reported from the Eel River” (PFMC 2004a).<br />
The fact that Pacific salmon are semelparous reduces the stability of population sizes. Because<br />
there is no overlap in the breeding population between years, one study (Waples 2002)<br />
demonstrated both theoretically and empirically that variable semelparous populations with<br />
overlapping year classes can reduce the effective population size in Pacific salmon. With respect<br />
to Chinook in particular, the author estimated a reduction of 40-60% in the effective population<br />
size of one particular Snake River Chinook salmon population due to variability in run sizes<br />
between years (Waples 2002).<br />
Habitat<br />
Human settlement along stream and river corridors during the past 150 years has<br />
altered the fundamental processes that created the habitat conditions under which<br />
salmonid populations have evolved and adapted over centuries. (Larsen et al.<br />
2004b)<br />
Over the past two centuries, habitat loss has become a major issue for Chinook and other<br />
salmonid species. Damming, logging, pollution, and hatchery fish have all put undue pressure on<br />
many wild Chinook stocks. As a consequence, the Pacific Fishery Management Council notes<br />
that “wild Chinook populations have disappeared from large areas where they used to flourish,<br />
and several evolutionarily significant units (ESUs) have been listed or proposed for listing as at<br />
risk for extinction under the Endangered Species Act” (PFMC 2004b). This is particularly true in<br />
the southern half of the Chinook salmon range, as graphically depicted in Figure 1.1.<br />
19
<strong>Seafood</strong> <strong>Watch</strong>® Wild Pacific Salmon Report October 8, 2010<br />
Figure 1.1. North American Chinook salmon range (Brownell 1999). 7<br />
Dams<br />
One of the key factors in Chinook freshwater habitat loss has been the construction of dams. The<br />
presence of a dam can profoundly alter salmon habitat by changing several factors including<br />
stream flow, sedimentation rates, nutrient levels, and obstacles to passage. In some cases, fish are<br />
unable to pass dams, effectively excluding them from the freshwater habitat above. As of the<br />
year 2000, the Columbia River Basin alone possessed over 200 large (> 15 meters high) dams<br />
and thousands of other dams as little as a meter or two in height. Of the large dams, less than<br />
10% were equipped with fish ladders or similar devices (Levin and Tolimieri 2001), often<br />
excluding salmon from the spawning grounds above. Of those dams passable to fish, many still<br />
cause significant mortality. For example, a single mid-Columbia River hydroproject consisting<br />
of two powerhouses is estimated to kill 5% of migrating salmon smolts (Skalski et al. 2002).<br />
Levin and Tolimieri similarly examined the fate of 16 Chinook salmon populations before and<br />
after dam construction in several areas of the Pacific Northwest (Levin and Tolimieri 2001). The<br />
authors concluded that in all cases dam construction had obvious detrimental effects on Chinook<br />
salmon habitat. Moreover, dams in the Upper Columbia River continue to have significant<br />
7 One reviewer raised concerns about the accuracy of this map in the Columbia/Puget Sound region. The scientist<br />
noted that mid-Columbia spring Chinook are regarded as relatively healthy, and that Grande Ronde and Upper<br />
Columbia Chinook are listed, but not extinct. In contrast, the map variably marks Puget Sound Chinook, but the<br />
ESU is listed as threatened. These maps are intended to provide a general sense of the relative health of salmon<br />
throughout their historical distribution. However, they are not substitutes for the more detailed information available<br />
in the Stock Status and Bycatch criteria of this report.<br />
20
<strong>Seafood</strong> <strong>Watch</strong>® Wild Pacific Salmon Report October 8, 2010<br />
negative effects on salmon populations despite mitigation measures, and may be currently<br />
preventing recovery of endangered salmon populations.<br />
Prior to 2002, the Army Corp of Engineers compiled information on the location and distribution<br />
of dams by state. The National Inventory of Dams indicated that in 2001 California had 1,470<br />
existing dams, Oregon 812, Washington 675, Idaho 404, and Alaska just 110 (Figure 1.2)<br />
(USACOE 2002).<br />
Number of Dams by State<br />
Dams<br />
1600<br />
1400<br />
1200<br />
1000<br />
800<br />
600<br />
400<br />
200<br />
0<br />
AK CA ID OR WA<br />
State<br />
Figure 1.2. Number of dams in the U.S. Pacific Northwest and Alaska.<br />
While it is clear that these hydroprojects have been devastating to many fish populations in<br />
North America, and more generally worldwide (Pringle et al. 2000), Chinook and coho salmon<br />
in the contiguous states have been among the most negatively affected. According to one recent<br />
analysis (Dauble et al. 2003), only 13% and 58% of Chinook salmon’s original riverine habitat in<br />
the Columbia and Snake Rivers, respectively, remains, with much of the Snake River habitat<br />
located behind the Hells Canyon dam and therefore inaccessible to salmon. Of the nearly 1,500<br />
km of these rivers once used for spawning by fall Chinook salmon, under 250 km (
<strong>Seafood</strong> <strong>Watch</strong>® Wild Pacific Salmon Report October 8, 2010<br />
In contrast to the widespread use of dams in California, Oregon, and Washington, water storage<br />
and hydroelectric projects are far less abundant in Alaska, due largely to the scarcity of major<br />
metropolitan or agricultural areas and greater abundance of water. According to one count, of the<br />
roughly 75,000 dams in the U.S., just 160 are located in Alaska (Alaska 2000). However, where<br />
dams do exist, they continue to have effects on anadromous fish. Few of the existing hydro<br />
facilities in Alaska appear to have anadromous fish ladders, and there is evidence that where<br />
dams do exist formerly strong salmon runs have dwindled (Boltwood 2002). As a proxy for the<br />
presence and extent of dams, data from the Energy Information Agency indicates that in the year<br />
2000 hydroelectric facilities in Alaska generated 1 billion kilowatt hours (kWh) (Figure 1.3). In<br />
contrast, California and Oregon each generated 38 times that amount, and Washington State<br />
generated more than the other three states combined (EIA 2002).<br />
Hydroelectric Production by State (2000)<br />
90000<br />
80000<br />
WA<br />
70000<br />
Million kWh<br />
60000<br />
50000<br />
40000<br />
30000<br />
CA<br />
OR<br />
Alaska<br />
California<br />
Idaho<br />
Oregon<br />
Washington<br />
20000<br />
10000<br />
0<br />
AK<br />
ID<br />
Figure 1.3. Hydroelectric production in the year 2000. Data source: (EIA 2002)<br />
Other Habitat Alterations<br />
In addition to dam development, Pacific salmon habitat has been compromised by other forms of<br />
human activity, including logging, water diversions, road construction, the proliferation of<br />
impervious surfaces, channelization of rivers, the removal of woody debris and riparian<br />
vegetation, disruption in sediment and nutrient supply, and a general fragmentation of habitats<br />
(Larsen et al. 2004b, OPR 2004). Again according to the NMFS Office of Protected Resources:<br />
“Studies indicate that in most western states, about 80 to 90 percent of the historic riparian<br />
habitat has been eliminated…. In Washington, the number of large, deep pools in National Forest<br />
streams has decreased by as much as 58 percent due to sedimentation and loss of pool-forming<br />
structures such as boulders and large wood. Similarly, in Oregon, the abundance of large, deep<br />
pools on private coastal lands has decreased by as much as 80 percent” (OPR 2004). The<br />
disappearance of these natural features can reduce the suitable habitat for Pacific salmon.<br />
An earlier but more comprehensive review by the U.S. Geological Survey notes that Oregon and<br />
Washington have witnessed the logging of 96% and 75% of their original coastal temperate<br />
rainforests, respectively (Noss et al. 1995). In addition, both states have incurred losses of oldgrowth<br />
forests in Douglas-fir regions on the order of 80-90%. California’s habitat losses have<br />
22
<strong>Seafood</strong> <strong>Watch</strong>® Wild Pacific Salmon Report October 8, 2010<br />
been even more severe, and read like an encyclopedia of habitat destruction: an 85% loss of<br />
coastal redwood (Sequoia sempervirens) forests, an 89% loss of Central Valley riparian forests, a<br />
90-98% decline of Sacramento River riparian and bottomland forests, a 99.9% loss of Central<br />
Valley riparian oak forest, a 94% loss of inland wetlands (including the Central Valley), a 69%<br />
loss of tule marsh, a 66-88% loss of Central Valley vernal pools, and a 62% loss of salt marshes<br />
(compiled by: (Noss et al. 1995)). Notably, Washington and Oregon both lost over a third of<br />
their wetlands between 1780 and 1980, and 91% of California’s wetlands have been drained or<br />
otherwise destroyed (Noss et al. 1995). In contrast, just 0.1% of Alaska’s wetlands were lost over<br />
that period. Indeed, Alaska is the only region of the United States without endangered<br />
ecosystems. While 11 percent of Alaska's original coastal temperate rainforests have been<br />
logged, the percentage still compares favorably against the 75-90% losses in California, Oregon,<br />
and Washington.<br />
Pollution can also be detrimental to salmon habitat. In many coastal regions, agricultural and<br />
urban run-off as well as atmospheric deposition have significantly reduced freshwater, estuarine,<br />
and coastal water quality (Boesch et al. 2001). Pollution can reduce the viability of salmon<br />
embryos, though the extent of these effects has not been quantified on West Coast salmon.<br />
Typically, agricultural chemicals such as pesticides are found in freshwater habitats at levels well<br />
below thresholds for acute mortality; however, pesticides can still cause sublethal effects that<br />
could ultimately cause ecological mortality. Potential harms include impaired swimming ability,<br />
reduced sense of smell, and disrupted immune and hormonal systems. The lack of data on the<br />
sublethal toxicity of pesticides for salmonids has been described as a “key uncertainty” for the<br />
recovery prospects of many ESUs (Sandahl et al. 2004). In 2002, a court order prohibited the<br />
application of 30 types of pesticides within close proximity to salmon waters in California,<br />
Oregon, and Washington.<br />
As with dams, this wide array of damages to salmon habitat appears to have significantly<br />
reduced both the quantity and quality of available Pacific salmon spawning habitat in the<br />
southern half of their traditional range. Alaskan habitat appears to have remained relatively<br />
robust during this period. Pollution is likewise less prominent of an issue in Alaska. While the<br />
Exxon Valdez oil spill received considerable attention for the detrimental effects it caused to<br />
salmon and other animals, current research indicates that spawning habitat has largely recovered<br />
from the spill 15 years ago (Carls et al. 2004).<br />
Introduced Species<br />
In addition to physical alterations, biological alterations to habitat can have substantial effects on<br />
salmon. In particular, introduced species can represent a subtler degradation of habitat. For<br />
example, over the past 150 years, over 20 species of fish have been introduced into the Columbia<br />
River Basin, several of which have become established. Currently, one fifth of the number of fish<br />
found in designated “wilderness area” streams in the basin are introduced species (Levin et al.<br />
2002). In many areas, introduced species are even more pervasive. For example, in a 1993<br />
survey of nearly one thousand samples (boat electrofishing, gillnets, and hoopnets) in the<br />
southern Sacramento-San Joaquin Delta, introduced species represented 99% of the total number<br />
of fish collected (Feyrer and Healey 2002).<br />
In many areas, these introductions have had significant detrimental effects on salmon. One of the<br />
most detrimental introductions is brook trout (Salvelinus fontinalis), the most abundant<br />
introduced species in threatened spring and summer-run Chinook spawning habitat in the<br />
23
<strong>Seafood</strong> <strong>Watch</strong>® Wild Pacific Salmon Report October 8, 2010<br />
Columbia River. Brook trout have been stocked widely for sport fishing throughout the<br />
American West, including California, Oregon, Idaho, Washington, and Alaska (Fuller 2003).<br />
Levin, Achord et al. (2002) note that brook trout “appear to easily outcompete anadromous<br />
salmon and may be important predators of salmon eggs and juveniles.” Levin, Achord et al.<br />
(2002) found a 12% decrease in the survival rates of juvenile salmon in sites where brook trout<br />
were present. It seems likely that where brook trout and Pacific salmon co-occur, brook trout<br />
may reduce salmon survival rates.<br />
In addition to the Columbia, brook trout have also been introduced into the Snake, Bear,<br />
Kootenai, and Rogue Rivers and into other drainages in Idaho, Oregon, and Washington. In<br />
California, brook trout have been stocked in over twenty rivers and drainages, and are currently<br />
spread throughout the Sierra Nevada (CDFG 2003, Fuller 2003). In Alaska, brook trout have<br />
only been stocked in Southeast Alaska. None of the fish introduced into Alaskan drainages have<br />
survived in the rivers and streams, and few brook trout have survived in lakes with access to the<br />
sea, leaving only a few brook trout populations in enclosed lakes (Schmidt 1994). As such, and<br />
in contrast to the Columbia River, it appears unlikely that brook trout are degrading salmon<br />
habitat in Alaska.<br />
Another introduced species, striped bass, can also have a negative effect on salmon, as they can<br />
prey upon juvenile Chinook salmon. Striped bass were introduced into the Sacramento River in<br />
1879 to encourage a commercial fishery. Striped bass have performed well in the Sacramento,<br />
but over the past three decades bass populations declined from 2 million to 1 million adults for a<br />
number of reasons (e.g., entrainment in water diversion projects and habitat loss). As of 2003, a<br />
proposed augmentation of Sacramento River striped bass populations was under debate. Such an<br />
augmentation program could negatively affect Chinook salmon populations. An analysis by<br />
Lindley and Mohr (2003) indicates that the Sacramento River winter-run Chinook population has<br />
a 28% chance of going extinct in the next 50 years, though the probability of extinction nearly<br />
doubles if striped bass populations are enhanced and stabilized at 3 million fish.<br />
As a more general point about the effects of introduced species and habitat, it appears that<br />
Alaskan habitat has been significantly less affected by introduced species to date than the rest of<br />
the West Coast. The Nonindigenous Aquatic Species Database maintained by the U.S.<br />
Geological Survey (USGS) indicates that only a handful of fish have been introduced and<br />
successfully established in Alaska. In contrast, the USGS database lists over 190 species<br />
introduced in California and 60 to 70 species introduced in each of the states of Oregon,<br />
Washington, and Idaho (USGS 2004).<br />
Summary: Chinook Salmon<br />
Overall, there is little debate that Chinook salmon habitat and other Pacific salmon freshwater<br />
habitat has been severely compromised over the past two centuries. Most of the habitat loss and<br />
fragmentation has been concentrated on the lower 48 states. Fortunately, freshwater habitats<br />
appear to have remained relatively intact in the sparsely populated state of Alaska. Figure 1.1<br />
depicts the consensus that Alaskan freshwater systems, by and large, have not been impacted to<br />
nearly the same extent as those in California, Oregon, Idaho, and Washington.<br />
24
<strong>Seafood</strong> <strong>Watch</strong>® Wild Pacific Salmon Report October 8, 2010<br />
Coho Salmon (Oncorhynchus kisutch)<br />
Coho salmon is also known as “silver” salmon. Of the five main Pacific salmon species, coho<br />
have proven to be the species perhaps most vulnerable to human pressure. While coho occupy<br />
the widest range of freshwater habitat types, they are not the most abundant species and have<br />
seen their numbers decline substantially throughout the southern portion of their range (Olsen et<br />
al. 2003).<br />
Distribution<br />
In North America, coho salmon spawn in many locations between the San Lorenzo River in<br />
Monterey Bay, California and Point Hope, Alaska in the Chukchi Sea (PFMC 2003). At sea,<br />
coho salmon range throughout the Pacific, from as far south as Baja California to Kotzebue<br />
Sound in the north. They are most frequently found in coastal waters between Central Oregon<br />
and Southeast Alaska (DFO 2001, PFMC 2004c).<br />
On the Asian side of the Pacific, coho salmon range throughout the Aleutian Islands, Kamchatka<br />
Peninsula, Hokkaido, Japan, and Korea (DFO 2001).<br />
ESUs<br />
Seven evolutionarily significant units (ESUs) of coho salmon have been identified on the West<br />
Coast of the United States:<br />
• Central California (Endangered under California Endangered Species Act)<br />
• Southern Oregon/Northern California Coasts<br />
• Oregon Coast<br />
• Lower Columbia River<br />
• Puget Sound/Strait of Georgia<br />
• Southwest Washington<br />
• Olympic Peninsula<br />
As of 2008, the Central California ESU is listed as endangered, the next three ESUs above were<br />
listed as threatened species, while the Puget Sound/Strait of Georgia ESU has a “species of<br />
concern” designation, all under the U.S. Endangered Species Act (NMFS 2010a). Additionally,<br />
coho south of Punta Gorda in California are listed as Endangered under the California<br />
Endangered Species Act.<br />
In Alaska, fishery managers have not divided coho salmon into ESUs. Instead fishery<br />
management is divided along geographic lines, splitting the state harvest into four overarching<br />
regions: Southeast Alaska, Central Region, Westward Region, and Arctic-Yukon-Kuskokwim<br />
Region. Coho salmon are harvested in all four of these regions, with a slight majority of landings<br />
coming from Southeast Alaska (Plotnick and Eggers 2004).<br />
Life History Traits<br />
Like the other species of Pacific salmon, coho salmon are anadromous, and generally have a life<br />
history similar to Chinook salmon. However, there are some differences between Chinook and<br />
coho salmon. Unlike Chinook salmon, the amount of time coho salmon spend in fresh and salt<br />
water is relatively fixed. Juvenile coho typically spend at least a year in freshwater, followed by<br />
25
<strong>Seafood</strong> <strong>Watch</strong>® Wild Pacific Salmon Report October 8, 2010<br />
18 months at sea, predominantly maturing at age-three (PFMC 2004a). However, in Southeast<br />
Alaska and Alaska’s Central Region, the majority of coho salmon adults are four year-olds,<br />
having spent an additional year in fresh water before going to sea (NWFSC 1995). As with<br />
Chinook salmon, precocious jacks will return to spawn at a younger age, typically just spending<br />
5-7 months at sea. The maximum reported age for coho is five years (Froese and Pauly 2004).<br />
Unlike Chinook salmon, where most production comes from mainstem spawning areas, 8 coho<br />
salmon tend to use smaller streams and tributaries. While coho salmon are capable of utilizing<br />
the full range of freshwater environments, most coho spawning is found in “smaller, lowgradient<br />
streams and tributaries” (PFMC 2004a). Typical coho populations are small in size, and<br />
they tend to spawn late in the year (early fall to mid winter) and utilize distant headwater streams<br />
(Olsen et al. 2003).<br />
With respect to reproductive capacity, female coho salmon typically deposit several thousand<br />
eggs, which develop during the winter and hatch in early spring. The emergent fry occupy<br />
shallow stream margins, and, as they grow, establish territories, which they defend from other<br />
salmonids. Coho fry live in ponds, lakes, and pools in streams and rivers, usually along stream<br />
banks, in quiet areas free of currents. During the fall, juvenile coho may travel miles before<br />
locating to an off-channel habitat where they pass the winter free of floods. Some fish leave fresh<br />
water in the spring and rear in brackish estuarine ponds and then migrate back into fresh water in<br />
the fall (Elliott 1994).<br />
Little is known about the ocean migrations of coho salmon. Coho appear to not migrate as far as<br />
other species of salmon, staying fairly close to shore (DFO 2003). High seas tagging indicates<br />
that maturing Southeast Alaska coho move northward throughout the spring and appear to<br />
concentrate in the central Gulf of Alaska in June. In the Gulf, the fish prey on gonatid squids and<br />
a wide range of other organisms such as fish, euphausiids, amphipods, and copepods (Kaeriyama<br />
et al. 2004). The salmon later disperse towards shore and migrate along the shoreline until they<br />
reach their stream of origin (Elliott 1994).<br />
Habitat<br />
As with Chinook salmon, coho salmon have lost a considerable portion of their habitat,<br />
particularly in the southern half of their range. The same sources of habitat degradation (i.e.,<br />
dams, water diversion, siltation, introduced species, and other human activities) have equally<br />
affected coho salmon. The current ESU listings indicate that coho salmon runs have been highly<br />
compromised in the contiguous states (Figure 1.4).<br />
In fact, coho salmon appear to be more vulnerable to habitat loss than other species. This<br />
additional vulnerability stems from at least three factors. First, while coho salmon populations<br />
are highly adaptable and can be found in a range of freshwater environments, many coho salmon<br />
rely on distant headwaters for spawning grounds (Elliott 1994). The longer lengths of freshwater<br />
migration leave the species more vulnerable to habitat disruption and loss from hydropower<br />
projects or water diversion en route. Second, the number of fish in coho runs tends to be smaller<br />
owing in part to the lesser tributaries coho prefer. Third, coho exhibit significant genetic<br />
diversity, with only weak “geographic concordance.” Because populations of coho are small<br />
8 Stream-type Chinook do not spawn in mainstem areas. They are also likely to make long migrations into the<br />
interior.<br />
26
<strong>Seafood</strong> <strong>Watch</strong>® Wild Pacific Salmon Report October 8, 2010<br />
relative to many other salmon runs, genetic diversity in coho is largely influenced by genetic<br />
drift (Olsen et al. 2003). This combination of small population sizes and the low degree of<br />
genetic overlap between coho stocks makes coho runs particularly vulnerable to anthropogenic<br />
damages. Olsen, Miller et al. (2003) comment: “Activities or conditions that cause declines in<br />
population abundance are more likely to have strong negative impacts for coho salmon than for<br />
species in which genetic variation is distributed over a broader geographic scale (e.g., chum<br />
salmon). Coho salmon are probably more susceptible to extirpation, less likely to be augmented<br />
or ‘rescued’ by other populations through straying (gene flow), and the loss of populations<br />
means loss of significant amounts of overall genetic variability.” Indeed, the National Marine<br />
Fisheries Service confirms that coho populations have been declining in streams throughout<br />
Oregon, Washington, and California, with the southernmost and easternmost stocks in the worst<br />
condition. Over the last hundred years, nearly all of the naturally reproducing populations of<br />
coho salmon are believed to have been extirpated from Columbia River tributaries (NMFS<br />
1999).<br />
As with Chinook salmon, roughly half of the natural range of coho in North America is found in<br />
Alaska. The freshwater habitat of Alaskan coho stocks has been substantially less impacted than<br />
spawning habitat in the contiguous U.S., and appears capable of supporting healthy populations<br />
(Figure 1.4).<br />
Figure 1.4. North American coho salmon range (Brownell 1999). 9<br />
9 While coho are extinct in the interior Columbia, they historically did not extend very far up the Snake River; as<br />
such the map misrepresents the species’ original range.<br />
27
<strong>Seafood</strong> <strong>Watch</strong>® Wild Pacific Salmon Report October 8, 2010<br />
Sockeye Salmon (Oncorhynchus nerka)<br />
Sockeye salmon, often referred to as “red” or “blueback” salmon, is the third most abundant of<br />
the Pacific salmonids, after pink and chum salmon. Unique in their appearance, adult spawning<br />
sockeye salmon typically turn bright red (with a green head), hence the name red salmon. During<br />
the ocean and adult migratory phases of their life cycle, sockeye often have a bluish back and<br />
silver sides (NMFS 2001a).<br />
Distribution<br />
Sockeye salmon occur in the North Pacific and Arctic oceans and associated freshwater systems.<br />
Sockeye are found from the Columbia River and its tributaries north and west to Kotzebue<br />
Sound in western Alaska, straying as far as Bathurst Inlet in the Canadian Arctic (Figure 1.5). On<br />
the Asian side of the Pacific, sockeye range from as far south as northern Hokkaido, Japan, to as<br />
far north as the Anadyr River in Siberia (ADFG 1994).<br />
ESUs<br />
Seven ESUs of sockeye salmon have been identified in the contiguous U.S.:<br />
• Snake River<br />
• Ozette Lake<br />
• Baker River<br />
• Okanogan River<br />
• Lake Wenatchee<br />
• Quinault Lake<br />
• Lake Pleasant<br />
As of June 2004, the Snake River ESU was considered an Endangered Species and the Ozette<br />
Lake ESU was listed as a Threatened Species under the Endangered Species Act (NMFS<br />
2004a).<br />
The ESU system has not been applied by the Alaska Department of Fish and Game, which<br />
manages roughly 98% of the U.S. commercial sockeye fishery. Instead, Alaska breaks<br />
commercial salmon fishing into four major areas: Southeast Alaska, Central Region, Westward<br />
Region, and Arctic-Yukon-Kuskokwim Region. Sockeye salmon are predominantly harvested in<br />
Alaska’s Central Region and Westward Region (with over half of the 2003 harvest coming from<br />
Bristol Bay, one of four management sub-units in the Central Region) (Plotnick and Eggers<br />
2004).<br />
Life History Traits<br />
As with other Pacific salmon, sockeye generally mature relatively quickly, typically spawning<br />
within the first four years after birth. Sockeye occasionally, however, spawn as late as seven<br />
years of age. During spawning, a female usually deposits 2,000 to 4,500 eggs in a redd,<br />
depending upon her size (ADFG 1994). Consistent with these factors, the growth rate for<br />
sockeye salmon has been reported as 0.37-0.58 (Froese and Pauly 2004).<br />
In general, sockeye salmon exhibit a wide variety of life history patterns that reflect a varying<br />
dependency on the fresh water environment (NMFS 2001a). Sockeye salmon may possess the<br />
28
<strong>Seafood</strong> <strong>Watch</strong>® Wild Pacific Salmon Report October 8, 2010<br />
highest degree of natal homing of any Pacific salmon species, which helps to maintain these<br />
differences (Stewart et al. 2003).<br />
With the exception of certain river-type and sea-type populations, the vast majority of sockeye<br />
salmon spawn near lakes. Most sockeye salmon spawn in the tributaries or outlets of lakes (and<br />
occasionally in the lakes themselves) because juvenile sockeye are adapted to remain in lakes for<br />
one or two years before beginning their marine migration (Stewart et al. 2003). Appropriate<br />
spawning grounds include streams and rivers ranging in depth from 10 cm to several meters, as<br />
well as groundwater-fed beaches in lakes. In these outwash areas, sockeye may spawn anywhere<br />
from the shoreline to a depth of several meters, and on substrates including small gravel, cobble,<br />
and rocky beaches (Hilborn et al. 2003, Moore et al. 2004). For this reason, the major<br />
distribution and abundance of large sockeye salmon stocks are closely related to the location of<br />
rivers that have accessible lakes in their watersheds for juvenile rearing (NMFS 2001a).<br />
Once at sea, sockeye salmon spend two to three years feeding before returning to spawn (Finney<br />
et al. 2000). In the Gulf of Alaska, sockeye prey upon a wide range of marine life including fish,<br />
squid, and other taxa. Their dominant prey appears to be gonatid squid, but sockeye salmon<br />
(along with pink and chum salmon) have demonstrated a high plasticity in diet, readily shifting<br />
prey in response to changing availability or ocean conditions (Kaeriyama et al. 2004).<br />
Some sockeye are not anadromous, spending their entire lives in freshwater (NMFS 2001a).<br />
Non-anadromous sockeye in the Pacific Northwest are known as kokanee. Occasionally, a<br />
proportion of the juveniles in an anadromous sockeye salmon population will remain in their<br />
rearing lake environment throughout their lives and will be observed on the spawning grounds<br />
together with their anadromous siblings (NMFS 2001a). Taxonomically, kokanee and sockeye<br />
salmon do not differ.<br />
Habitat<br />
On the Pacific Coast, sockeye salmon inhabit riverine, marine, and lake environments. Sockeye<br />
are no longer present in the southern reaches of their historic range, such as the Central Valley of<br />
California. As with Chinook and coho salmon, sockeye freshwater habitat in the contiguous<br />
United States has fared poorly over the past two centuries. Where sockeye salmon populations<br />
persist south of Alaska, they appear to be in sub-standard health (Figure 1.5).<br />
However, unlike Chinook and coho salmon the vast majority of sockeye salmon have<br />
traditionally been found north of the regions most impacted by habitat degradation. The center of<br />
abundance of sockeye stocks is in Bristol Bay, Alaska. Currently, roughly 98% of the U.S.<br />
commercial sockeye salmon harvest comes from Alaska, “The Last Frontier State.” As such, the<br />
bulk of sockeye freshwater habitat has been significantly less degraded than the habitat of coho<br />
or Chinook salmon, and remains capable of supporting robust populations.<br />
29
<strong>Seafood</strong> <strong>Watch</strong>® Wild Pacific Salmon Report October 8, 2010<br />
Figure 1.5. North American sockeye salmon range (Brownell 1999). 10<br />
Chum Salmon (Oncorhynchus keta)<br />
Chum salmon, known in parts of Alaska as “dog salmon,” may have historically been the most<br />
abundant of all salmonids (NMFS 2001b). Chum salmon traditionally provided a major source of<br />
dried fish to Native Americans and First Nations in the winter (Buklis 1994).<br />
Distribution<br />
Chum salmon have the widest natural geographic and spawning distribution of any Pacific<br />
salmonid, primarily because its range extends farther along the shores of the Arctic Ocean than<br />
any other salmonid (NMFS 2001b, Froese and Pauly 2004). In the Arctic, chum range east to the<br />
Mackenzie River in Canada and west to Siberia’s Lena River (Buklis 1994).<br />
Historically, chum salmon were distributed down the West Coast of the United States as far<br />
south as Monterey, California (NMFS 2001b). Presently, however, major spawning populations<br />
are found only as far south as Tillamook Bay on the northern Oregon coast (Figure 1.6) (NMFS<br />
2001b). In Asia, the southern limit to chum salmon is the island of Kyushu in the Sea of Japan<br />
(Buklis 1994).<br />
10 The map appears to list Ozette Lake Sockeye as low or no risk; in reality, they are listed as threatened. Similarly,<br />
the interior Columbia coloring makes the sockeye range appear larger than it actually is. The map also indicates that<br />
sockeye extend north to Kotzebue Sound. Commercially important densities, however, are only found as far north as<br />
the Kuskokwim. (Burgner RL. 1991. Life History of Sockeye Salmon (Oncorhynchus nerka). Pp. 1-117 in: Groot C,<br />
Margolis L, editors. Pacific Salmon Life Histories. Vancouver, British Columbia, Canada: UBC Press.)<br />
30
<strong>Seafood</strong> <strong>Watch</strong>® Wild Pacific Salmon Report October 8, 2010<br />
ESUs<br />
As of June 2004, four ESUs of chum salmon had been identified by NMFS in the contiguous<br />
United States:<br />
• Hood Canal Summer-run<br />
• Columbia River<br />
• Puget Sound/Strait of Georgia<br />
• Pacific Coast<br />
Of these four, the first two ESUs are listed as Threatened Species under the Endangered Species<br />
Act. Both threatened ESUs are supported by NMFS Critical Habitat Designation (NMFS 2004a).<br />
The designation provides notice to federal agencies and the public that the chum areas are vital to<br />
conservation.<br />
In Alaska, chum salmon are not divided by ESUs. Instead, state salmon fishery management is<br />
divided into four overarching regions: Southeast Alaska, Central Region, Westward Region, and<br />
Arctic-Yukon-Kuskokwim Region. In Alaska, chum salmon are predominantly harvested in<br />
Southeast Alaska and Alaska’s Central Region (Plotnick and Eggers 2004).<br />
Life History Traits<br />
Chum salmon are anadromous, semelparous, and spawn primarily in fresh water. Chum salmon<br />
grow to be among the largest of Pacific salmon, second only to Chinook salmon in adult size,<br />
with individuals reported over a meter in length and greater than 20 kg in weight. Average size<br />
for an adult chum is 3 to 9 kg (Buklis 1994, NMFS 2001b).<br />
The species is best known for the enormous canine-like fangs and striking body color (a calico<br />
pattern, with the anterior two-thirds of the flank marked by a jagged, reddish line and the<br />
posterior third by a jagged black line) of spawning males. Females are less boldly colored and<br />
lack the extreme dentition of the males (NMFS 2001b).<br />
Most chum salmon mature between ages two and five, with 60-90% of fish maturing at four<br />
years of age (particularly in southeastern Alaska, though there is variation in maturation rates<br />
between streams) (Buklis 1994). Age at maturity appears to follow a latitudinal trend in which a<br />
greater number of older fish occur in the northern portion of the species’ range. The maximum<br />
age reported for chum salmon is six years (Froese and Pauly 2004).<br />
Chum salmon tend to spawn in the lowermost reaches of rivers and streams, typically within 100<br />
km of the ocean. That said, some chum in the Yukon River travel over 2,000 miles to spawn in<br />
the Yukon Territory. Buklis (1994) notes: “Chum salmon often spawn in small side channels and<br />
other areas of large rivers where upwelling springs provide excellent conditions for egg survival.<br />
They also spawn in many of the same places as do pink salmon, i.e., small streams and intertidal<br />
zones.” Fecundity for female chum normally ranges between 2,400 and 3,100 eggs. The<br />
semelparous fish cease feeding on their return freshwater migration.<br />
After hatching, chum salmon migrate almost immediately to estuarine and ocean waters, in<br />
contrast to coho, Chinook, and sockeye salmon, which migrate to sea after months or years in<br />
freshwater. Migrating chum form schools in estuaries, presumably to reduce losses to predation,<br />
31
<strong>Seafood</strong> <strong>Watch</strong>® Wild Pacific Salmon Report October 8, 2010<br />
and, while in freshwater and estuarine areas, feed on small insects. After entering marine<br />
environments, chum remain close to shore for a few months before dispersing to sea (Froese and<br />
Pauly 2004). Once in marine waters, Alaskan chum move into the Bering Sea and Gulf of Alaska<br />
by the fall, where they spend the next several winters (Buklis 1994). At sea, chum feed on a<br />
relatively diverse array of prey, able to shift the main components of their diets between<br />
jellyfish, micronekton, and zooplankton in response to prey availability (Buklis 1994, Kaeriyama<br />
et al. 2004). As a result of their rapid transition from freshwater to estuarine and marine<br />
environments, chum salmon appear to be less dependent on freshwater conditions than on<br />
favorable estuarine and marine conditions.<br />
Habitat<br />
As with the other Pacific salmonids, freshwater chum salmon habitat in the contiguous U.S. has<br />
been negatively affected by development. Chum salmon have been extirpated from historical<br />
spawning areas in California and parts of Oregon (Figure 1.6), and two of the four chum ESUs in<br />
the Pacific Northwest are currently listed as Threatened Species. In Alaska, chum habitat appears<br />
to be relatively robust.<br />
Figure 1.6. North American chum salmon range (Brownell 1999). 11<br />
11 The historic distribution of chum salmon up the Columbia may be over-represented by this depiction.<br />
Additionally, Hood Canal chum, shown here as low/no risk, are a listed ESU. Presumably, were Alaskan chum<br />
salmon to have been analyzed, the runs would rank as low or no risk.<br />
32
<strong>Seafood</strong> <strong>Watch</strong>® Wild Pacific Salmon Report October 8, 2010<br />
Pink Salmon (Oncorhynchus gorbuscha)<br />
Pink salmon are the smallest of North American salmon, with adults weighing on average less<br />
than four pounds and measuring under two feet long (PFMC 2004a). Pink salmon (pinks), also<br />
known as “humpback” salmon because of the pronounced hump that develops on the backs of<br />
mature adult males, maintain a two-year lifecycle, thus large runs follow a biennial pattern.<br />
Distribution<br />
Pink salmon are found on both sides of the North Pacific. On North American shores they extend<br />
from Puget Sound north to Alaska and the Aleutian Islands. In Asia, pink salmon spawn between<br />
Russia, North Korea, and Hokkaido, Japan, and range into the Bering and Okhotsk Seas (Hard et<br />
al. 1996, Froese and Pauly 2004). In latitudinal terms, pink salmon currently spawn around the<br />
Pacific Rim from 44°N to 65°N in Asia and from 48°N to 64°N in North America (Hard et al.<br />
1996).<br />
Currently, Washington appears to be the southern limit of the spawning distribution of pink<br />
salmon in North America (Hard et al. 1996); however, historic pink drainages may have<br />
stretched further south into California (Brownell 1999, Froese and Pauly 2004).<br />
ESUs<br />
The National Marine Fisheries Service has not identified geographically-specific ESUs for pink<br />
salmon in the Pacific Northwest. It has identified, however, odd- and even-year runs, but neither<br />
odd- nor even-year pink salmon runs have been listed as threatened or endangered (NMFS<br />
2004a). In Alaska, pink salmon are not divided by ESUs. Fishery management is instead divided<br />
into four overarching regions: Southeast Alaska, Central Region, Westward Region, and Arctic-<br />
Yukon-Kuskokwim Region. Of these four regions, pink salmon are predominantly harvested in<br />
the first three (Plotnick and Eggers 2004).<br />
Life History Traits<br />
Adult pink salmon enter spawning streams between late June and mid-October (Kingsbury 1994,<br />
Hard et al. 1996). Most pink salmon spawn within a few miles of the coast and spawning within<br />
the intertidal zone or the mouths of streams is common (Steelquist 1992, Kingsbury 1994).<br />
Shallow riffles, where flowing water breaks over coarse gravel or cobble-size rock, and the<br />
downstream ends of pools are favored spawning areas (ADFG 2000). Female pink salmon each<br />
carry 1,500 to 2,000 eggs depending on her size (Steelquist 1992, Kingsbury 1994, Hard et al.<br />
1996). As with the other species of Pacific salmon, females dig nests, or redds, with their tails<br />
and release the eggs, which are then fertilized by males and covered over. The process is<br />
commonly repeated several times until all of the female's eggs have been released, after which<br />
the spawning adults soon die, usually within two weeks (Kingsbury 1994).<br />
Sometime during early to mid-winter, eggs hatch. The alevins, or young fry, feed on attached<br />
yolk sac material, and continue to grow and develop (Kingsbury 1994). In late winter or spring,<br />
the fry swim up out of the gravel and migrate downstream into salt water. The emergence and<br />
outward migration of fry is heaviest during hours of darkness and usually lasts for several weeks<br />
before all the fry have emerged (Kingsbury 1994).<br />
Following entry into salt water, juvenile pink salmon move along the beaches in dense schools<br />
near the surface, feeding on plankton, larval fishes, and occasional insects (Steelquist 1992,<br />
33
<strong>Seafood</strong> <strong>Watch</strong>® Wild Pacific Salmon Report October 8, 2010<br />
Larsen et al. 2004a). Predation is heavy on the very small, newly emerged pink salmon fry, but<br />
growth is rapid. By fall, at an age of about 1 year, juvenile pink salmon are 4 to 6 inches long<br />
and are moving into ocean feeding grounds in the Gulf of Alaska, the Aleutian Islands, and the<br />
Puget Sound areas (Kingsbury 1994, Hard et al. 1996). High seas tag-and-recapture experiments<br />
have revealed that pink salmon originating from specific coastal areas have characteristic<br />
distributions at sea which are overlapping, non-random, and nearly identical from year to year<br />
(Kingsbury 1994). The ranges of Alaska pink salmon at sea and pink salmon from Asia, British<br />
Columbia, and Washington overlap each other (Kingsbury 1994). Once at sea, pink salmon in<br />
the Gulf of Alaska prey on a wide diversity of organisms (e.g., squids and zooplankton), and<br />
show a high degree of plasticity in their diets, readily changing between types of prey in<br />
response to their availability (Kaeriyama et al. 2004).<br />
Pink salmon almost exclusively mature in two years, which means that odd-year and even-year<br />
populations are essentially unrelated. Frequently in a particular stream or region the odd-year or<br />
even-year cycle will predominate, although in some streams both odd- and even-year pink<br />
salmon are about equally abundant. Occasionally cycle dominance will shift, and the previously<br />
weak cycle will become most abundant (Kingsbury 1994). At present, pink salmon in the Pacific<br />
Northwest are most abundant during odd-numbered years.<br />
In terms of homing, it is interesting to note that pink salmon may have a higher degree of<br />
straying than other species, and occasionally use streams as far as 640 km from their natal waters<br />
(Froese and Pauly 2004). The high incidence of straying helps to explain why pink salmon have<br />
fewer distinct ESUs than other Pacific salmon.<br />
Habitat<br />
As with sockeye and chum salmon, most pink salmon habitat is found in Alaska and has been<br />
relatively unperturbed. Historic spawning populations in California have already been<br />
eliminated, and remaining spawning habitat in the Pacific Northwest has been compromised to<br />
the extent that it no longer fully supports robust populations (Figure 1.7); of the 15 populations<br />
of pink salmon in Washington only 6 are classified as healthy. Because pink salmon typically<br />
spawn within a few miles of the coast, they have been less affected by the development of<br />
hydropower projects and upstream water diversion than have other salmonids.<br />
34
<strong>Seafood</strong> <strong>Watch</strong>® Wild Pacific Salmon Report October 8, 2010<br />
Figure 1.7. North American pink salmon range (Brownell 1999). 12<br />
Synthesis<br />
Salmon have relatively resilient life-history traits, including short life spans and high fecundity.<br />
These traits would typically result in a very low estimate of inherent vulnerability. However,<br />
salmon’s resilience belies a significant vulnerability based on their dependence on freshwater<br />
environments. Freshwater spawning habitats throughout the contiguous U.S. have been severely<br />
degraded by a large number of factors including the presence of dams, habitat alteration,<br />
introduced species, and pollution. In many cases, these losses have crippled the capacity of<br />
salmon runs to sustain even moderate fishing pressure. When these losses are combined with a<br />
limited range (river-specific ESUs) and a mixed-stock fishery, the vulnerability of salmon stocks<br />
to fishing in Oregon (north of Cape Falcon) and Washington must be considered moderate. In<br />
contrast, the relatively pristine rivers and streams of Alaska have allowed stocks there to remain<br />
resilient to heavy fishing pressure.<br />
12 Northern and western Alaskan drainages were not mapped by Brownell (1999), but presumably would be ranked<br />
as low or no risk.<br />
35
<strong>Seafood</strong> <strong>Watch</strong>® Wild Pacific Salmon Report October 8, 2010<br />
Intrinsic rate of increase (‘r’)<br />
‣ High (> 0.16)<br />
‣ Medium (0.05 - 0.16)<br />
‣ Low (< 0.05)<br />
‣ Unavailable/Unknown<br />
Age at 1 st maturity<br />
‣ Low (< 5 years)<br />
‣ Medium (5 - 10 years)<br />
‣ High (> 10 years)<br />
‣ Unavailable/Unknown<br />
Von Bertalanffy growth coefficient (‘k’)<br />
‣ High (> 0.16)<br />
‣ Medium (0.05 - 0.15)<br />
‣ Low (< 0.05)<br />
‣ Unavailable/Unknown<br />
Maximum age<br />
‣ Low (< 11 years)<br />
‣ Medium (11 - 30 years)<br />
‣ High (> 30 years)<br />
‣ Unavailable/Unknown<br />
Reproductive potential (fecundity)<br />
‣ High (> 100 inds./year)<br />
‣ Moderate (10 – 100 inds./year)<br />
‣ Low (< 10 inds./year)<br />
‣ Unavailable/Unknown<br />
Primary Inherent Vulnerability Factors to Evaluate<br />
Secondary Factors to evaluate<br />
Species range<br />
‣ Broad (e.g., species exists in multiple ocean basins, has multiple intermixing stocks or is<br />
highly migratory)<br />
‣ Limited (e.g., species exists in one ocean basin)<br />
‣ Narrow (e.g., endemism or numerous evolutionarily significant units or restricted to<br />
one coastline)<br />
36
<strong>Seafood</strong> <strong>Watch</strong>® Wild Pacific Salmon Report October 8, 2010<br />
Special Behaviors or Requirements: Existence of special behaviors that increase ease or<br />
population consequences of capture (e.g., migratory bottlenecks, spawning aggregations, site<br />
fidelity, unusual attraction to gear, sequential hermaphrodites, segregation by sex, etc., OR<br />
specific and limited habitat requirements within the species’ range)<br />
‣ No known behaviors or requirements OR behaviors that decrease vulnerability<br />
(e.g., widely dispersed during spawning)<br />
‣ Some (i.e., 1 - 2) behaviors or requirements<br />
‣ Many (i.e., > 2) behaviors or requirements<br />
Quality of Habitat: Degradation from non-fishery impacts<br />
Chinook, Coho, Sockeye, Chum, and Pink Salmon in AK<br />
‣ Habitat is robust<br />
‣ Habitat has been moderately altered by non-fishery impacts<br />
Chinook, Coho, Sockeye, Chum, and Pink Salmon in OR (north of Cape Falcon) and WA<br />
‣ Habitat has been substantially compromised from non-fishery impacts (e.g., dams,<br />
pollution, or coastal development) and thus has reduced capacity to support this<br />
species<br />
Evaluation Guidelines<br />
1) Primary Factors<br />
a) If ‘r’ is known, use it as the basis for the rank of the Primary Factors.<br />
b) If ‘r’ is unknown, then the most conservative rank from the remaining Primary Factors is<br />
the basis for the rank (in order of importance, as listed).<br />
2) Secondary Factors<br />
a) If the majority (2 out of 3) of the Secondary Factors rank as Red, reclassify the species<br />
into the next lower rank (e.g., Green becomes Yellow, Yellow becomes Red). No other<br />
combination of Secondary Factors can modify the rank from the Primary Factors.<br />
b) If the rank of the Primary Factors is Red AND the majority of Secondary Factors are also<br />
Red, inherent vulnerability represents a Critical Conservation Concern and the species<br />
receives a rank of “Critical” for this criterion and an overall seafood recommendation of<br />
“Avoid” regardless of the other criteria.<br />
Pacific Salmon in AK<br />
‣ Low (Inherently Resilient)<br />
Conservation Concern: Inherent Vulnerability<br />
Pacific Salmon in OR (north of Cape Falcon) and WA<br />
‣ Moderate (Inherently Neutral)<br />
37
<strong>Seafood</strong> <strong>Watch</strong>® Wild Pacific Salmon Report October 8, 2010<br />
Criterion 2: Status of Wild Stocks<br />
Guiding Principle: Sustainable wild-caught seafood species have stock structure and abundance<br />
sufficient to maintain long-term fishery productivity.<br />
This criterion examines the stock structure and abundance of targeted salmon fisheries on the<br />
coasts of Alaska, Washington and Oregon (north of Cape Falcon). Healthy stocks are those<br />
believed capable of supporting long-term fishery production. The primary factors evaluated in<br />
this criterion are long- and short-term trends in escapement. 13 Where escapement data are not<br />
present, long-term trends in fishery landings can provide a proxy for abundance, though landings<br />
are influenced by variable fishing effort and regulations.<br />
This criterion (and the following criterion on Bycatch) relies heavily on management<br />
“escapement goals.” It needs to be recognized that these escapement goals, and associated<br />
maximum sustainable yields (MSYs), are not necessarily accurate. Standard fisheries curvefitting<br />
techniques are notoriously poor for salmonids and management efforts that rely on curvefitting<br />
contain substantial uncertainty. In other words, managers do not always know what an<br />
appropriate MSY or escapement goal is with a great degree of certainty.<br />
It is also important to note that declines in salmon abundance in many areas predate the fifty<br />
years of landings data in the NMFS database; the absence of historical data creates the danger of<br />
a shifting baseline. Conversely, there is a difficulty in separating current fishing impacts from<br />
historical overfishing. Because the data uncertainties are so large, the report may appear to be<br />
conflating past and present fishing pressure.<br />
Because of dramatic differences between the health of many salmon stocks, assessments of<br />
salmon fisheries are necessarily divided by species and along geographic lines. The process of<br />
aggregating stock data into larger geographic units may result in recommendations that are overinclusive;<br />
however, the usefulness of the analysis for <strong>Seafood</strong> <strong>Watch</strong>® and ultimately for<br />
consumers requires aggregation and generalization. The regional distribution of salmon landings<br />
is presented here, followed by state-specific assessments of salmon stocks (Table 2.1). Because<br />
of the relatively unique role of artificial production in supporting salmon fisheries, this analysis<br />
is necessarily prefaced with a clarification of the role of hatchery salmon in assessing stock<br />
structure and abundance.<br />
Hatchery Salmon<br />
Unlike every other major marine fishery in the United States, West Coast salmon are heavily<br />
augmented by hatchery production. Salmon hatcheries exist for a variety of purposes, most<br />
notably the conservation, restoration, and/or augmentation of salmon runs. In the United States,<br />
several hundred public and private hatcheries collectively release nearly two billion salmon<br />
annually (NPAFC 2004). The presence of these fish can significantly complicate commercial<br />
fishery assessments, as neither the positive nor the negative effects of hatcheries are generally<br />
considered in the fishing mortality calculus used in most fisheries analyses.<br />
13 Ocean escapement is defined as the number of fish surviving ocean fisheries and returning to the freshwater<br />
environment to spawn.<br />
38
<strong>Seafood</strong> <strong>Watch</strong>® Wild Pacific Salmon Report October 8, 2010<br />
Table 2.1. Summary abundance of targeted wild West Coast salmon species, by state.<br />
State Species Abundance 14 Trends (Escapement or<br />
Landings<br />
Variable. Most Oregon stocks<br />
Oregon Chinook<br />
appear to be meeting escapement<br />
Highly depleted from historic<br />
goals, but Oregon fishery harvests<br />
levels.<br />
declining Sacramento River fall<br />
runs.<br />
Chinook<br />
Highly depleted from historic<br />
Variable.<br />
Washington<br />
Alaska<br />
Chum<br />
Pink<br />
Sockeye<br />
Chinook<br />
Chum<br />
Coho<br />
Pink<br />
Sockeye<br />
levels.<br />
Variable: Puget Sound stocks at<br />
record abundance; Coastal stocks<br />
unknown.<br />
Variable: 6 stocks healthy, 6 stocks<br />
depleted. Targeted stocks healthy.<br />
Variable: 2 stocks healthy, 4 stocks<br />
depleted. Targeted stocks healthy.<br />
Excellent: Escapement within<br />
management targets.<br />
Escapement at or above<br />
management targets.<br />
Escapement strong for all<br />
monitored rivers.<br />
Historic highs due to<br />
augmentation; wild escapement<br />
meeting management targets.<br />
Excellent.<br />
Short-term increases in escapement<br />
and run-size in Puget Sound.<br />
Short-term increases in escapement.<br />
Variable: Targeted runs have<br />
increasing short-term trends.<br />
Landings steady. Average<br />
escapement.<br />
Long-term increases in landings.<br />
Average escapement.<br />
Long-term increases in escapement<br />
and landings.<br />
Long-term increases in escapement<br />
and landings due largely to hatchery<br />
supplementation.<br />
Long-term increases in escapement,<br />
landings since mid-70s.<br />
There is an ongoing debate in the management and legal community as to whether artificially<br />
propagated salmon ought to be included when considering the health of an ESU. While there are<br />
valid economic and sometimes environmental reasons to encourage hatcheries, this review<br />
attempts to focus on the health and abundance of only wild fish for the following reasons.<br />
First, when hatchery fish are included in stock assessments, many ESUs that are otherwise<br />
failing, such as several in the Columbia River Basin, appear to be in reasonable health. As such,<br />
high levels of hatchery releases can mask declines in wild populations. Because salmon fisheries<br />
are generally mixed-stock fisheries, targeting hatchery fish can increase the harvest rates of wild<br />
fish. Myers, Levin et al. (2004) comment: “Including hatchery fish in an ESU confounds risk of<br />
extinction in the wild with ease of captive propagation and ignores important biological<br />
differences between wild and hatchery fish.”<br />
Second, by competing with wild salmon for food and other resources, empirical evidence<br />
indicates that hatchery releases reduce marine survival rates of wild salmon, particularly in years<br />
of poor ocean conditions. As a consequence, a high abundance of hatchery fish that might<br />
otherwise indicate a healthy ESU has the potential to negatively affect survival rates and the<br />
14 See subsequent discussion for citations.<br />
39
<strong>Seafood</strong> <strong>Watch</strong>® Wild Pacific Salmon Report October 8, 2010<br />
long-term viability of wild fish. These competitive interactions are explored in greater detail in<br />
the criterion on Habitat Effects.<br />
Third, in addition to habitat effects, hatchery fish have the potential to erode the long-term health<br />
of wild salmon ESUs by homogenizing their gene pool. Because they are exposed to a different<br />
set of environmental factors, hatchery broodstocks are inevitably domesticated, 15 with<br />
adaptations to the hatchery environment generally reducing performance in the wild (Myers et al.<br />
2004). One scientist (Waples 1991) posited that the primary concern with hatchery salmonids is<br />
that “a variety of locally adapted stocks will be replaced with a smaller number of relatively<br />
homogeneous ones. This process of consolidation tends to limit the evolutionary potential of the<br />
species as a whole…. Hybridization of different gene pools can theoretically have two important<br />
genetic consequences: loss of interpopulational genetic diversity and outbreeding depression.”<br />
The disruption of adaptive gene complexes in endangered populations of wild salmon is of<br />
particular concern. Empirical evidence bears this concern out. As of the late-1990s, at least eight<br />
studies had documented genetic differences between wild and hatchery-raised Pacific salmon<br />
affecting traits that could reduce the wild fitness of hatchery fish (Reisenbichler and Rubin<br />
1999). It has been repeatedly demonstrated that fish from hatcheries typically have lower success<br />
and survival rates in the wild, as do wild-hatchery hybrids. In addition to genetic differences,<br />
hatchery fish may exhibit unusual reproductive behaviors. For example, one study observed that<br />
a disproportionately large share of hatchery-reared Chinook salmon males in the Yakima River<br />
(37-49%) are precocious, some of which may “residualize” in the upper Yakima River Basin<br />
(Larsen et al. 2004a). The authors surmise that “an unnaturally high incidence of precocious<br />
male maturation may result in the loss of returning anadromous adults, the skewing of<br />
female:male sex ratios, and ecological and genetic impacts on wild populations and other native<br />
species” (Larsen et al. 2004a).<br />
In terms of process, genetic introgression occurs when hatchery salmon breed with wild fish.<br />
This can occur either when hatchery fish stray or are introduced into wild breeding areas. While<br />
some degree of straying is natural, hatchery fish appear to have higher straying rates in many<br />
cases than wild salmon (Myers et al. 2004). In Alaska, a particularly high incidence of straying<br />
has been noted with pink salmon in Prince William Sound and chum salmon in Southeast Alaska<br />
(Kelly 2001). In light of this straying and the potential genetic effects, one reviewer comments:<br />
“Alaska has been successful in augmenting salmon harvest with hatchery-produced fish, but<br />
whether or not salmon biodiversity has been adequately protected in the process is unanswered.<br />
Data necessary to evaluate interactions between hatchery and wild salmon populations have not,<br />
in most cases, been collected” (Kelly 2001). While Alaskan wild escapement generally remains<br />
high, the state has been favored by beneficial environmental conditions. If conditions worsen, the<br />
detrimental effects of hatcheries may become more pronounced.<br />
15 While hatchery salmon may originate from broodstock captured in the wild and representative of the ESU gene<br />
pool, some degree of selection inevitably occurs within the hatchery environment. In addition, behavioral<br />
deficiencies may emerge from neurological problems. Recent research on artificially propagated Chinook salmon<br />
has identified lower ratios of brain size to body mass in both the olfactory bulb and the telencephalon (Kihsligner et<br />
al. 2003). These neurological problems (while presumably not hereditary) introduce other selective pressures on the<br />
hatchery fish.<br />
40
<strong>Seafood</strong> <strong>Watch</strong>® Wild Pacific Salmon Report October 8, 2010<br />
This is not to say that there is no role at all for hatchery fish. Clearly, hatcheries can have<br />
important conservation uses, such as preventing genetic drift where wild numbers have dwindled<br />
below sustainable thresholds (Brannon et al. 2004). However, given the substantial differences<br />
between wild and hatchery fish, the range of interactions possible between them, and the<br />
uncertainties that remain, this review concentrates on trends in the health and abundance of wild<br />
fish. In many cases, such as long-term landings data, it is difficult to disaggregate hatchery and<br />
wild fish.<br />
Distribution of Landings<br />
Alaska dominates West Coast salmon fisheries. Over the past twenty years, Alaska has landed<br />
roughly ten times as much salmon as California, Oregon, and Washington combined (Figures 2.1<br />
and 2.2). Pink, sockeye, and chum salmon are the main species landed in the U.S., and are all<br />
harvested almost exclusively in Alaska. The large majority of coho are also primarily landed in<br />
Alaska. Only the relatively small quantity of Chinook salmon landings are distributed somewhat<br />
evenly across the four West Coast states (Figure 2.3).<br />
Alaska’s dominance in U.S. salmon fisheries was solidified in the late 1970s. The dramatic<br />
increase in landings that occurred then is believed to have been a result of a regime shift in ocean<br />
conditions that favored Alaska combined with the state’s conservation-oriented management and<br />
aggressive investment in hatcheries following a period of low returns in the mid-1970s.<br />
Hatcheries generated 23% of Alaska’s commercial harvest in 2002, with hatchery releases<br />
focusing on pink salmon (938 million) and chum salmon (451 million) (Farrington 2003).<br />
U.S. Commercial Salmon Landings<br />
500000<br />
450000<br />
400000<br />
350000<br />
300000<br />
250000<br />
200000<br />
Alaska<br />
Pacific Northwest<br />
150000<br />
100000<br />
50000<br />
0<br />
1950<br />
1954<br />
1958<br />
1962<br />
1966<br />
1970<br />
1974<br />
1978<br />
1982<br />
1986<br />
1990<br />
1994<br />
1998<br />
2002<br />
Year<br />
Figure 2.1. U.S. commercial salmon landings by region (1950-2002) (NMFS 2004b).<br />
41
<strong>Seafood</strong> <strong>Watch</strong>® Wild Pacific Salmon Report October 8, 2010<br />
U.S. Commercial Salmon Landings by Species<br />
500,000<br />
450,000<br />
400,000<br />
350,000<br />
300,000<br />
250,000<br />
200,000<br />
150,000<br />
100,000<br />
50,000<br />
0<br />
1950<br />
1953<br />
1956<br />
1959<br />
1962<br />
1965<br />
1968<br />
1971<br />
1974<br />
1977<br />
Year<br />
1980<br />
1983<br />
1986<br />
1989<br />
1992<br />
1995<br />
1998<br />
2001<br />
Figure 2.2. U.S. commercial salmon landings by species (1950-2002) (NMFS 2004b).<br />
Chinook<br />
Coho<br />
Chum<br />
Sockeye<br />
Pink<br />
Commercial Salmon Landings - Percent of Species by State<br />
(1950-2002)<br />
100%<br />
80%<br />
60%<br />
40%<br />
Chinook<br />
Coho<br />
Chum<br />
Sockeye<br />
Pink<br />
20%<br />
0%<br />
California Oregon Washington Alaska<br />
Figure 2.3. State share of commercial salmon landings, by species (NMFS 2004b).<br />
Stocks by Region: Alaska<br />
In numerical terms, Alaskan stocks appear very healthy, particularly relative to the pattern of<br />
declining yields observed in many fisheries. Even excluding landings of hatchery fish (which in<br />
recent years have been around one-third of landed salmon), Alaskan salmon landings over the<br />
past quarter century have been significantly larger than landings in any other time period, with<br />
data stretching back to 1880 (Figure 2.4). A brief survey of landings in Alaska by region or by<br />
42
<strong>Seafood</strong> <strong>Watch</strong>® Wild Pacific Salmon Report October 8, 2010<br />
species shows positive trends over the past fifty years. The main exceptions to this rule are<br />
western Alaska, where runs have been significantly lower over the past decade than in previous<br />
periods, and landings of Chinook salmon, which have shown a slight downward trend. In<br />
general, the fluctuations in Alaskan landings are believed to be mainly climate-driven (Adkinson<br />
and Finney 2003).<br />
Figure 2.4. Alaskan commercial salmon landings and value (Plotnick and Eggers 2004).<br />
Alaskan Pink Salmon<br />
The largest landings of any single salmonid species in Alaska are of pink salmon. Spurred by a<br />
combination of favorable climatic conditions and hatchery production, growth in pink salmon<br />
harvests accounts for much of Alaska’s overall increase in landings over the past quarter century.<br />
During the past fifty years, pink salmon landings have demonstrated a strong upward trend<br />
(Figure 2.5); this increase holds true for both northern and southern Southeast Alaska pink<br />
salmon stocks (Kelly 2001). The 2003 commercial harvest of pink salmon was over 500 million<br />
pounds, one of the highest landings ever (Plotnick and Eggers 2004). Given that the fish live a<br />
two-year life cycle, the long-term increasing harvests are a fair indicator of stock health.<br />
43
<strong>Seafood</strong> <strong>Watch</strong>® Wild Pacific Salmon Report October 8, 2010<br />
Alaskan Commercial Pink Salmon Landings (1950-20<br />
metric tons<br />
200,000.00<br />
180,000.00<br />
160,000.00<br />
140,000.00<br />
120,000.00<br />
100,000.00<br />
80,000.00<br />
60,000.00<br />
40,000.00<br />
20,000.00<br />
0.00<br />
1940 1950 1960 1970 1980 1990 2000 2010<br />
Alaska<br />
6 year moving average<br />
Figure 2.5. Commercial landings of Alaskan pink salmon (NMFS 2004b).<br />
Landings of pink salmon in Alaska primarily occur in Prince William Sound in Alaska’s Central<br />
Region (189 million pounds in 2003), Southeast Alaska (184 million pounds), and Alaska’s<br />
Westward Region (127 million pounds) (Plotnick and Eggers 2004). In all three regions, stocks<br />
appear to be numerically in remarkable health. The main concerns regarding stock health<br />
surround the unusually high percentage of hatchery fish in the pink salmon harvest.<br />
In Prince William Sound, the pink salmon harvest is largely a hatchery phenomenon. Nearly<br />
three million pink salmon spawned in the Sound in 2003, the second highest escapement since<br />
the mid-1960s, indicating that pink salmon are at least numerically healthy. Moreover, the<br />
combined wild-hatchery harvest of pink salmon was a record high in the Sound in 2003 (Plotnick<br />
and Eggers 2004). However, since 1986, returns of hatchery salmon have significantly<br />
outnumbered wild pink salmon in Prince William Sound (Figure 2.6); the ratio of hatchery to<br />
wild salmon in 2003 was 8:1. Kelly (2001) has highlighted this abundance of hatchery pink<br />
salmon as a potential threat to the integrity of the wild gene pool. The comprehensive salmon<br />
plan for Prince William Sound recommends that hatchery fish comprise less than 2% of longterm<br />
wild stock escapement—a recommendation that has been ignored. Straying of hatchery fish<br />
remains a major concern, and one for which insufficient data exist to measure the effects (Kelly<br />
2001).<br />
In Southeast Alaska, pink salmon also had a solid year in 2003. Escapement for all 45 monitored<br />
pink salmon stock groups in Southeast Alaska was at or above management targets (biological<br />
escapement goals), and the region collectively recorded the third highest escapement index since<br />
1960 (Plotnick and Eggers 2004). Escapement of pink salmon in Southeast Alaska has increased<br />
over 150% in the past two decades (Zadina et al. 2003). Similarly, in the Westward Region,<br />
Kodiak Island reported that wild pink salmon escapement in 2003 was over 5 million fish, well<br />
above the management target of 1-3 million fish, while North Peninsula pink salmon harvests<br />
exceeded the usual bounds (Plotnick and Eggers 2004).<br />
44
<strong>Seafood</strong> <strong>Watch</strong>® Wild Pacific Salmon Report October 8, 2010<br />
Overall, pink salmon landings in Alaska indicate the stock is in good health. Despite record<br />
landings, the main concern revolves around the long-term effects of hatchery supplementation,<br />
particularly in Prince William Sound. As Figure 2.6 indicates, returns of wild pink salmon in<br />
Prince William Sound have fallen over the past twenty years, while returns of hatchery pink<br />
salmon have increased. This disparity has led at least one set of analysts to conclude that Prince<br />
William Sound pink salmon hatcheries are replacing rather than augmenting wild pink salmon<br />
production in the region, with the likely causes of replacement being “a decline in wild<br />
escapement associated with harvesting hatchery stocks and biological impacts of the hatchery<br />
fish on wild fish” (Hilborn and Eggers 2000). A more recent summary of research has suggested<br />
that wild pink salmon decreases in the Sound have been primarily caused by biophysical<br />
variables (Heard 2003). The authors note that pink salmon hatcheries in the Prince William<br />
Sound create a net gain of pink salmon up to 25 million fish, though “under certain worst-case<br />
scenarios there might be up to a 4.5 million annual wild stock yield loss due to hatchery releases”<br />
(Heard 2003). In summary, hatchery operations in Prince William Sound appear to be depressing<br />
escapement of wild pink salmon, though the significance of this decrease (e.g., relative to direct<br />
fishery impacts on other stocks) remains unclear. Despite the decline, projected wild pink salmon<br />
escapement in Prince William Sound in 2004 is 4.6 million fish, above the sustainable<br />
escapement goal range of 1.3-2.8 million fish (Plotnick and Eggers 2004).<br />
Figure 2.6. Returns and survival of hatchery and wild pink salmon in Prince William<br />
Sound (Willette et al. 2001).<br />
45
<strong>Seafood</strong> <strong>Watch</strong>® Wild Pacific Salmon Report October 8, 2010<br />
Alaskan Sockeye Salmon<br />
After pink salmon, sockeye salmon is the largest contributor to Alaska’s salmon harvest. As with<br />
pink salmon, Alaskan commercial sockeye landings have followed a generally upward trend<br />
since 1950 (Figure 2.7). Productivity of Alaskan sockeye salmon stocks has generally increased<br />
over the past thirty years, particularly following 1973. Increases in productivity have not been<br />
uniform across the state. Rather, there has been variation between different runs, reflecting the<br />
diversity of mechanisms through which environmental conditions influence the productivity of<br />
individual stocks (Peterman et al. 2003). In particular, Hilborn, Quinn et al. (2003) document<br />
how the genetic diversity embedded in the hundreds of distinct populations of sockeye in the<br />
Bristol Bay area allowed the stock complex to successfully adapt to changing environmental<br />
conditions.<br />
Alaskan Commercial Sockeye Landings (1950-2002)<br />
metric tons<br />
180,000.00<br />
160,000.00<br />
140,000.00<br />
120,000.00<br />
100,000.00<br />
80,000.00<br />
60,000.00<br />
40,000.00<br />
20,000.00<br />
0.00<br />
1940 1950 1960 1970 1980 1990 2000 2010<br />
Alaska<br />
6 year moving average<br />
Figure 2.7. Commercial landings of Alaskan sockeye salmon (NMFS 2004b).<br />
The largest harvest of sockeye salmon in the U.S. occurs in the Bristol Bay area of southwestern<br />
Alaska where 10 million to more than 30 million sockeye are caught each year during a short,<br />
intensive fishery lasting only a few weeks. The Bristol Bay sockeye fishery has been described in<br />
the fisheries literature as a “classic example” of a sustainable fishery (Hilborn et al. 2003). In<br />
2003, fishermen in Bristol Bay landed 15 million fish, roughly half of the state’s total. These<br />
landings reflected the seventh smallest run of sockeye in Bristol Bay in the past twenty years.<br />
Harvests of 3-4 million fish each were also reported for Kodiak Island, Cook Inlet, and Prince<br />
William Sound. 16 Year 2003 runs in Prince William Sound were average, while Cook Inlet and<br />
Kodiak Island reported runs that generally exceeded escapement goals. The projection for 2004<br />
landings of sockeye salmon is up over 50% from 2003 (Plotnick and Eggers 2004).<br />
Overall, sockeye salmon appear to be managed around their maximum sustainable yield. In<br />
anecdotal support of this, reduced fishing pressure following the 1989 Exxon Valdez oil spill in<br />
16 In contrast, sockeye stocks just south of Alaska have fared poorly. The Canadian government has been petitioned<br />
to list sockeye salmon in British Columbia as an endangered species (McRae and Pearse 2004).<br />
46
<strong>Seafood</strong> <strong>Watch</strong>® Wild Pacific Salmon Report October 8, 2010<br />
Prince William Sound led to returns of sockeye salmon significantly larger than management<br />
goals as far as 800 km from the spill. These increased returns indicate that the main factor<br />
affecting sockeye salmon returns is the abundance of spawners in the parent year. However, due<br />
to habitat limitations, large spawner abundances can create overcrowding. In three of the four<br />
major populations, subsequent juvenile sockeye salmon growth was reduced as a result of the<br />
larger number of spawners during the fishery closures while oil was present in the spill area<br />
(Ruggerone and Rogers 2003).<br />
Alaskan Chum Salmon<br />
In 2003, chum was the third most harvested salmon in Alaska, with over 124 million pounds<br />
landed. Nearly two-thirds of the state harvest was landed in Southeast Alaska (79 million fish),<br />
followed in quantity by Prince William Sound (24 million fish) and the Kodiak area (8 million<br />
fish) (Plotnick and Eggers 2004). As with pink and sockeye salmon, commercial chum landings<br />
in Alaska have followed an upward trend over the past fifty years (Figure 2.8) and show no signs<br />
of having plateaued.<br />
Commercial Chum Salmon Landings (1950-2002)<br />
80,000.00<br />
70,000.00<br />
60,000.00<br />
metric tons<br />
50,000.00<br />
40,000.00<br />
30,000.00<br />
Alaska<br />
Washington<br />
6 year avg (WA)<br />
6 year avg (AK)<br />
20,000.00<br />
10,000.00<br />
0.00<br />
1940 1950 1960 1970 1980 1990 2000 2010<br />
Figure 2.8. Commercial landings of Alaskan chum salmon (NMFS 2004b).<br />
Chum landings in Southeast Alaska were up 50% in 2003 from the previous year, though<br />
escapement in the region was apparently “slightly below average” (Plotnick and Eggers 2004).<br />
Over the past 21 years, peak escapement in Southeast Alaska has been stable or increasing in 71<br />
of 82 monitored streams, and decreasing in 11 streams. The escapement goals in Southeast<br />
Alaska appear to be largely without scientific justification—as of two years ago, improvements<br />
in the measurement system were underway (Heinl et al. 2003). In Prince William Sound, 2003<br />
escapement was near or above biological escapement goals for monitored systems, while Kodiak<br />
reported escapement within management goals.<br />
As with pink and sockeye salmon, chum landings in Alaska are strongly influenced by hatchery<br />
production. Chum in both Southeast Alaska and Prince William Sound have been singled out as<br />
areas where straying hatchery fish may be interbreeding with wild fish—a cause for significant<br />
47
<strong>Seafood</strong> <strong>Watch</strong>® Wild Pacific Salmon Report October 8, 2010<br />
concern over the long-term (Kelly 2001). In Southeast Alaska alone, nearly 10 million hatchery<br />
chum were caught in common fisheries (Farrington 2004).<br />
Alaskan Coho Salmon<br />
Alaskan coho populations appear to be healthy when compared to a historic baseline. In contrast<br />
to the rest of the West Coast, landings of coho have increased steadily in Alaska over the past<br />
fifty years (Figure 2.9). In terms of escapement, Olsen, Miller et al. (2003) note: “Most Alaskan<br />
coho salmon populations are believed to be healthy. A 100 year review of fishery harvest data, as<br />
well as abundance estimates for some individual populations in Southeast and Southcentral<br />
Alaska, suggest the number of coho salmon in most regions of Alaska is stable or increasing.”<br />
Escapement trends for coho salmon in Alaska are primarily monitored for 34 streams in six stock<br />
groups. None of the 34 streams demonstrated declining trends in escapement between 1981 and<br />
1996 (Plotnick and Eggers 2004).<br />
The main region from which coho is harvested in Alaska is Southeast Alaska. Coho escapement<br />
in Southeast Alaska has been relatively stable since the mid-1980s, with marine survival the<br />
main determinant of escapement variability (Shaul et al. 2003). In 2003, coho escapement in<br />
Southeast Alaska was good to excellent in monitored streams. The total Alaska coho harvest was<br />
over 4 million fish, collectively weighing 31 million pounds. Regionally, nearly 60% of the<br />
harvest was landed in Southeast Alaska (2.5 million fish), followed by Alaska’s Central Region<br />
(0.7 million fish, mainly in Prince William Sound and Cook Inlet), and Alaska’s Westward<br />
Region (0.6 million fish, mainly in the Kodiak area and the South Peninsula). Exploitation rates<br />
have been reduced over the last several years due to poor market conditions (Shaul et al. 2003).<br />
From 1998 to 2002, an average of 22% of the coho harvested was of hatchery origin. Of the<br />
hatchery fish, 97% originated at Alaskan facilities (Shaul et al. 2003). The 2004 projected coho<br />
salmon harvest from Alaska is over five million fish, mainly from Southeast Alaska (Plotnick<br />
and Eggers 2004). Overall, coho runs appear healthy, with age distributions normal, and there is<br />
no reason to believe that stocks are depleted or being overexploited.<br />
48
<strong>Seafood</strong> <strong>Watch</strong>® Wild Pacific Salmon Report October 8, 2010<br />
Commercial Coho Salmon Landings (1950-2002)<br />
35,000.00<br />
30,000.00<br />
metric tons<br />
25,000.00<br />
20,000.00<br />
15,000.00<br />
10,000.00<br />
Alaska<br />
California<br />
Oregon<br />
Washington<br />
6 year avg (AK)<br />
6 year avg (WA)<br />
6 year avg (OR)<br />
5,000.00<br />
0.00<br />
1940 1950 1960 1970 1980 1990 2000 2010<br />
Figure 2.9. Commercial landings of Alaskan coho salmon (NMFS 2004b).<br />
Alaskan Chinook Salmon<br />
Chinook salmon make up the smallest portion of Alaska’s salmon harvest. In 2003, roughly 10<br />
million pounds of Chinook salmon were landed, comprising just over 1% of the state salmon<br />
harvest (Plotnick and Eggers 2004). In contrast to the other four salmon species, landings of<br />
Chinook salmon in Alaska have shown a downward trend over the past fifty years (Figure 2.10).<br />
Two-thirds of Alaska’s 2003 landings came from Southeast Alaska (418,000 fish), with the<br />
remainder split between a number of other regions including Prince William Sound (48,000<br />
fish), Bristol Bay (44,000 fish), and the Arctic-Yukon-Kuskokwim Region (57,000 fish)<br />
(Plotnick and Eggers 2004). The Southeast Alaska harvest of 418,000 fish was the largest on<br />
record since 1953. Chinook salmon are also remarkable in that they are the only salmon species<br />
in Alaska for which a significant quantity (roughly half) are landed with troll gear. Notably, the<br />
Southeast Alaska troll fishery recorded the 4 th highest landings of Chinook salmon since Alaskan<br />
statehood. Hatchery fish are estimated to have contributed just 7% to troll landings. Chinook<br />
escapement within Southeast Alaska fell between 2002 and 2003, but remained within<br />
management goals for all but two rivers. Prince William Sound Chinook landings were the 7 th<br />
largest on record in 2003, while escapement remained within management targets. Bristol Bay<br />
landings of Chinook salmon were lower than average in 2003, while escapement was just<br />
slightly above the target level (Plotnick and Eggers 2004).<br />
Overall, the trend in landings of Chinook salmon in Alaska appears to be relatively flat or<br />
slightly downward. It is possible that reduced fishing pressure following falling salmon prices<br />
over the past decade has contributed to this reduced harvest. In any case, recent record harvests<br />
and escapement levels within management targets generally indicate a healthy stock status.<br />
49
<strong>Seafood</strong> <strong>Watch</strong>® Wild Pacific Salmon Report October 8, 2010<br />
Commercial Chinook Landings (1950-2002)<br />
9,000.00<br />
8,000.00<br />
metric tons<br />
7,000.00<br />
6,000.00<br />
5,000.00<br />
4,000.00<br />
3,000.00<br />
2,000.00<br />
Alaska<br />
California<br />
Oregon<br />
Washington<br />
6 year avg (AK)<br />
6 year avg (WA)<br />
6 year avg (OR)<br />
6 year avg (CA)<br />
1,000.00<br />
0.00<br />
1940 1950 1960 1970 1980 1990 2000 2010<br />
Figure 2.10. Commercial landings of Alaskan Chinook salmon (NMFS 2004b).<br />
Stocks by Region: Contiguous U.S.<br />
In comparison to Alaska, the contiguous states are a small contributor to overall West Coast<br />
salmon landings. Alaskan salmon production generally dwarfs the combined landings of<br />
Washington, Oregon, and California. Within the Pacific Northwest, Washington is the largest<br />
salmon producer, generally followed by Oregon then California. Figure 2.11 shows the<br />
fluctuations in total salmon landings for each state over the past half-century.<br />
Pacific Northwest Commercial Salmon Landings (1950-2002)<br />
50000<br />
45000<br />
40000<br />
35000<br />
30000<br />
25000<br />
20000<br />
15000<br />
10000<br />
5000<br />
0<br />
1950<br />
1953<br />
1956<br />
1959<br />
1962<br />
1965<br />
1968<br />
1971<br />
1974<br />
1977<br />
Year<br />
1980<br />
1983<br />
1986<br />
1989<br />
1992<br />
1995<br />
1998<br />
2001<br />
Washington<br />
Oregon<br />
California<br />
Figure 2.11. Contiguous U.S. commercial salmon landings by state (NMFS 2004b).<br />
50
<strong>Seafood</strong> <strong>Watch</strong>® Wild Pacific Salmon Report October 8, 2010<br />
With respect to species, the Pacific Fishery Management Council-controlled ocean salmon<br />
fisheries mainly catch Chinook and coho salmon; pink salmon are caught in odd-numbered<br />
years, mainly off the coast of Washington (PFMC 2004a). In addition, chum, sockeye, and pink<br />
salmon are landed in Washington State in coastal fisheries managed by the state and by tribes,<br />
not under the PFMC management plan.<br />
As with Alaska, salmon fishing is a time-honored profession on the West Coast. The intensive<br />
commercial fishery for Pacific salmon began in 1864 with the introduction of canning<br />
technology (McEvoy 1986). Salmon yields in California, Oregon, and Washington peaked in the<br />
twenty years around 1900, and have since been in relatively continuous decline despite<br />
significant public investment in preventative measures (Lichatowich et al. 1999). Today, two<br />
wild Chinook stocks are listed as endangered species under the Federal Endangered Species Act,<br />
and 17 wild Chinook and two wild coho stocks are listed as threatened (Figure 2.12).<br />
Generally, the stock health for all salmon populations in the contiguous U.S. declines as one<br />
progresses either south or east, due to warming climates and longer freshwater migrations,<br />
respectively. Similarly, populations with longer residence times in freshwater have also seen<br />
greater declines. The greatest losses have been observed in Chinook, coho, and sockeye salmon,<br />
with pink and chum salmon faring better (Kope and Wainwright 1998). To better assess the<br />
health of salmon caught in the contiguous U.S., fisheries are examined on a state-by-state basis.<br />
51
<strong>Seafood</strong> <strong>Watch</strong>® Wild Pacific Salmon Report October 8, 2010<br />
Figure 2.12. Status of Chinook and coho stocks managed by the PFMC (PFMC 2004a).<br />
The PFMC divides the coastline into four main fishing areas: south of Horse Mountain, Horse<br />
Mountain north to Humbug Mountain, Humbug Mountain north to Cape Falcon, and Cape<br />
Falcon north to Cape Flattery (Figure 2.13). As previously mentioned, California and Oregon<br />
(south of Cape Falcon) salmon was a seasonal, fresh product this year and is no longer available<br />
until the 2011 fishing season. Therefore, this section of the report only evaluates the commercial<br />
52
<strong>Seafood</strong> <strong>Watch</strong>® Wild Pacific Salmon Report October 8, 2010<br />
salmon stocks off Washington and Oregon (north of Cape Falcon) (i.e., Cape Falcon to Cape<br />
Flattery).<br />
Figure 2.13. Map of Pacific Fishery Management Council management areas<br />
(PFMC 2004a).<br />
53
<strong>Seafood</strong> <strong>Watch</strong>® Wild Pacific Salmon Report October 8, 2010<br />
Washington and Oregon (north of Cape Falcon)<br />
Ocean salmon fisheries in Washington State and Oregon (north of Cape Falcon) fall within a<br />
single PFMC management area, extending from Cape Falcon north to the Canadian border<br />
(Figure 2.13). The PFMC reports that Columbia River stocks represent the majority of Chinook<br />
salmon caught in ocean fisheries in this area. In addition to Columbia River salmon, stocks from<br />
British Columbia, Puget Sound, Central and Northern Oregon, and California also contribute to<br />
ocean fishing off of Washington.<br />
Columbia River Basin Chinook<br />
Historic salmon runs in the Columbia River once numbered anywhere between 7 and 16 million<br />
anadromous fish annually (McClure et al. 2003, Robinson 2004). Today, the number of wild<br />
spawners has been sharply reduced. Eleven ESUs in the Columbia River Basin have been listed<br />
as threatened, and upper Columbia River spring-run Chinook are federally endangered. The<br />
majority of these stocks are unlikely to be viable. Even under the most optimistic assumptions<br />
(e.g., hatchery fish have zero reproduction), nine of eleven ESUs have declining population<br />
trends, and global warming is only anticipated to worsen conditions. Already, wild coho are<br />
extinct in the interior Columbia River basin, and Columbia River sockeye are maintained in a<br />
captive broodstock program. These problems are relatively widespread across the basin, with<br />
every accessible sub-basin in the Columbia River containing at least one threatened or<br />
endangered ESU (McClure et al. 2003).<br />
Clearly, numerous anadromous salmon runs in the Columbia River system are in distress. The<br />
effects of fisheries on these threatened and endangered stocks are addressed in the Bycatch<br />
criterion. However, Columbia River fall Chinook escapement has increased in recent years.<br />
There are five major stock groups of Columbia River Basin fall Chinook: lower river hatchery<br />
(LRH) tule stock and lower river wild (LRW) bright stock, both of which are part of the ESAlisted<br />
lower Columbia River Chinook ESU; Spring Creek Hatchery (SCH) tule stock; upriver<br />
bright (URB) stock, which includes the ESA-listed Snake River fall Chinook ESU; and mid-<br />
Columbia bright (MCB) hatchery stock. The 2010 LRH forecast abundance is 90,600, a slight<br />
increase from 88,800 in 2009. The 2010 SCH forecast abundance is 169,000, which is almost<br />
three times the 2009 forecast of 59,300 and is the highest forecast in 26 years. In 2009, all<br />
Columbia River fall stocks except LRW met their escapement objectives. The LRW escapement<br />
objective was 5,700 adult spawners in the North Fork Lewis River. The total return of the five<br />
stocks was 430,500 fall Chinook (Figure 2.14) (PFMC 2010c).<br />
54
<strong>Seafood</strong> <strong>Watch</strong>® Wild Pacific Salmon Report October 8, 2010<br />
Figure 2.14. Columbia River mouth adult returns of the five major fall Chinook stock<br />
groups, 1976-2009 (PFMC 2010c).<br />
In reality, fisheries are supported by a combination of stocks that remain in relative health and<br />
hatchery supplementation. Hatcheries, in particular, play a major role in supporting fisheries. It is<br />
important to note that the majority of returning spawners in the Columbia are hatchery-raised<br />
fish, with only 1 of every 5 fish of natural origin (see the Habitat Effects criterion) (Robinson<br />
2004, Stetkiewicz 2004). In terms of ocean fisheries off of Washington, the PFMC reports that<br />
the most important contributor are Columbia River fall tule 17 stocks, which generally mature at<br />
an earlier age than natural fall stocks and do not migrate as far north. Lower Columbia River tule<br />
stocks are primarily of hatchery origin, with wild tule stocks officially listed as endangered (see<br />
the Bycatch criterion).<br />
Puget Sound Chinook<br />
As mentioned, Puget Sound Chinook runs also contribute to marine fisheries off of Washington,<br />
along with Chinook from the Columbia River system, California, British Columbia, and the<br />
Oregon Coast. Naturally spawning spring and summer/fall Chinook originating in Puget Sound<br />
remain depressed. Runs in the Nooksack, Skagit, White, and Dungeness Rivers are of continuing<br />
concern. Preliminary data indicate that in 2009, hatchery escapement goals were met, but no<br />
17 ‘Tule’ refers to wetland areas in the lower river area.<br />
55
<strong>Seafood</strong> <strong>Watch</strong>® Wild Pacific Salmon Report October 8, 2010<br />
Puget Sound spring Chinook natural stocks met their escapement goal, while natural escapement<br />
goals were met in some areas but not others for Puget Sound summer/fall Chinook (PFMC<br />
2010c).<br />
Other Washington Salmon Fisheries<br />
Coho Salmon<br />
The region north of Cape Falcon (which includes all of Washington and a small section of<br />
Oregon) is the only area in the contiguous U.S. where coho salmon can be retained in<br />
commercial fisheries (hatchery-origin coho only). All fisheries that allow retention of coho are<br />
selective for hatchery fish marked with a healed adipose fin clip. In addition, there are provisions<br />
for “inseason action to allow retention of all legal sized coho in commercial and recreational<br />
fisheries north of Cape Falcon, with specific dates set for decision points” (Lohn 2004).<br />
Columbia River, Washington Coast, and Puget Sound are the primary areas of origin for coho<br />
caught in this region, with historic landings shown in Figure 2.15. Over the past half-century,<br />
landings of coho have fallen significantly, such that California and Oregon no longer permit<br />
coho to be commercially landed in their waters. Incidental mortality of wild coho in this fishery<br />
is reviewed in greater detail under the Bycatch criterion. In contrast, landings and the abundance<br />
of hatchery-origin coho is not an area of concern for this review. In Washington, three stocks of<br />
coho – Grays Harbor coho, Queets coho, and Western Strait of Juan de Fuca (SJF) coho – failed<br />
to meet conservation goals for three consecutive years. However, Grays Harbor and Queets coho<br />
are believed to have met their conservation objections in 2009. Western SJF coho remain<br />
depleted, but are not believed to be overfished (see “Criterion 5: Effectiveness of the<br />
Management Regime”).<br />
Pacific Northwest - Commercial Coho Salmon Landings<br />
(1950-2002)<br />
9,000.00<br />
8,000.00<br />
metric tons<br />
7,000.00<br />
6,000.00<br />
5,000.00<br />
4,000.00<br />
3,000.00<br />
2,000.00<br />
California<br />
Oregon<br />
Washington<br />
6 year avg (WA)<br />
6 year avg (OR)<br />
6 year avg (CA)<br />
1,000.00<br />
0.00<br />
1945 1955 1965 1975 1985 1995 2005<br />
Figure 2.15. Commercial coho landings in the contiguous U.S. (NMFS 2004b).<br />
56
<strong>Seafood</strong> <strong>Watch</strong>® Wild Pacific Salmon Report October 8, 2010<br />
Sockeye Salmon<br />
Outside of Alaska, sockeye salmon are only landed in small quantities in Washington State.<br />
Historic landings are shown in Figure 2.16 and have declined over the past fifty years.<br />
Washington Commercial Sockeye Landings (1950-2002)<br />
metric tons<br />
18,000.00<br />
16,000.00<br />
14,000.00<br />
12,000.00<br />
10,000.00<br />
8,000.00<br />
6,000.00<br />
4,000.00<br />
2,000.00<br />
0.00<br />
1945 1955 1965 1975 1985 1995 2005<br />
Figure 2.16. Commercial landings of sockeye salmon in Washington (NMFS 2004b).<br />
Somewhat less information is available for sockeye salmon than for Chinook or coho salmon.<br />
Because sockeye are not fished in the open ocean (they are caught in coastal waters with gillnets<br />
and seines), the species is not managed under the PFMC’s Salmon Fishery Management Plan.<br />
Instead, state managers shoulder the majority of management responsibility. According to the<br />
Washington State Department of Fish and Game, there are currently six populations of sockeye<br />
in Washington not listed under the Endangered Species Act. Two of the six populations are<br />
classified as healthy: Baker River and Lake Washington.<br />
Baker River is an artificially supported stock, in the sense that an artificial spawning beach was<br />
created in 1957 to offset the detrimental effects of a hydropower project. Though depleted from<br />
natural abundances of around 20,000 spawners per year, Baker River runs have been relatively<br />
high in recent years (Figure 2.17) (WDFW 2004c).<br />
57
<strong>Seafood</strong> <strong>Watch</strong>® Wild Pacific Salmon Report October 8, 2010<br />
Baker River Sockeye Salmon<br />
Trap Count<br />
25000<br />
20000<br />
Fish<br />
15000<br />
10000<br />
5000<br />
0<br />
1968 1978 1988 1998<br />
Year<br />
Figure 2.17. Escapement of sockeye salmon from Baker River (WDFW 2004c).<br />
Lake Washington is actually an introduced stock, initially stocked with Baker River fish between<br />
the two World Wars. It is unclear when anadromous sockeye last existed in Lake Washington,<br />
though the lake has long been full of kokanee. In any case, Lake Washington sockeye<br />
populations have fluctuated widely over the past decades, often falling in response to a series of<br />
floods associated with the Pacific Decadal Oscillation. Stocked trout may also have been a factor<br />
in their decline (see the Inherent Vulnerability criterion) (Ames 2004). The last four years have<br />
seen somewhat stronger runs, generally approaching the escapement goal of 350,000 fish (Figure<br />
2.18). The forecasted run for 2004 is 486,000 fish. Only in years when run size is predicted to be<br />
larger than escapement is a commercial fishery allowed (WDFW 2004c).<br />
58
<strong>Seafood</strong> <strong>Watch</strong>® Wild Pacific Salmon Report October 8, 2010<br />
Figure 2.18. Lake Washington sockeye run size and escapement (WDFW 2004c).<br />
The four remaining sockeye populations in Washington are classified by managers as “depleted”<br />
due to low escapement. These populations include Columbia River sockeye, which formerly<br />
supported runs as large as three million fish. Today, Columbia River sockeye populations remain<br />
severely depressed due to habitat loss and other factors. The Columbia does not support a<br />
directed commercial sockeye fishery (WDFW 2004c). In addition, Lake Ozette sockeye are<br />
listed as threatened and Snake River sockeye (in Idaho) are endangered under the ESA (see the<br />
Bycatch criterion).<br />
Pink Salmon<br />
As with sockeye salmon, small quantities of pink salmon are also landed in Washington, and<br />
occasionally in Oregon and California. Because pink salmon follow a two-year life cycle,<br />
landings of pink salmon follow a biannual cycle, with harvests mainly in odd-numbered years.<br />
Since 1950, landings of pink salmon have fluctuated, with an overall declining trend (Figure<br />
2.19). However, it is important to note that landings are not a strong indicator of escapement.<br />
The falling price of pink salmon (now around 10 cents per pound) has severely depressed effort<br />
levels in the commercial fishery (mainly purse seines). Additionally, pinks sometimes return<br />
with listed Chinook runs. When they co-occur, harvest restrictions on Chinook further reduce<br />
fishing pressure on pink salmon (Ames 2004).<br />
59
<strong>Seafood</strong> <strong>Watch</strong>® Wild Pacific Salmon Report October 8, 2010<br />
Pacific Northwest Commercial Pink Salmon<br />
Landings (1950-2002)<br />
metric tons<br />
18000<br />
16000<br />
14000<br />
12000<br />
10000<br />
8000<br />
6000<br />
4000<br />
2000<br />
0<br />
1950<br />
1953<br />
1956<br />
1959<br />
1962<br />
1965<br />
1968<br />
1971<br />
1974<br />
1977<br />
1980<br />
1983<br />
1986<br />
1989<br />
1992<br />
1995<br />
1998<br />
2001<br />
Figure 2.19. Commercial landings of pink salmon in the Pacific Northwest (NMFS 2004b).<br />
Puget Sound Pink Salmon<br />
Escapement<br />
Fish<br />
8,000,000<br />
7,000,000<br />
6,000,000<br />
5,000,000<br />
4,000,000<br />
3,000,000<br />
2,000,000<br />
1,000,000<br />
0<br />
Run Size<br />
Escapement<br />
1959<br />
1961<br />
1963<br />
1965<br />
1967<br />
1969<br />
1971<br />
1973<br />
1975<br />
1977<br />
1979<br />
1981<br />
Year<br />
1983<br />
1985<br />
1987<br />
1989<br />
1991<br />
1993<br />
1995<br />
1997<br />
1999<br />
2001<br />
Figure 2.20. Total pink salmon escapement in Puget Sound<br />
(Data acquired from WDFW 2004).<br />
In fact, escapement of pink salmon populations in Washington State was at a relatively high level<br />
in 2001 and 2003 (Ames 2004), with the estimated 2001 escapement the highest on record since<br />
1963 (Figure 2.20). There are fifteen stocks of pink salmon in Washington, all in Puget Sound.<br />
With respect to the population status of pink salmon populations in Washington State, the<br />
Washington Department of Fish and Game has ranked six pink salmon population as healthy,<br />
four as depleted, and two as critical, with the status of three other populations unknown. Many of<br />
the stocks have shown significant improvement (WDFW 2004b). For example, in recent years<br />
60
<strong>Seafood</strong> <strong>Watch</strong>® Wild Pacific Salmon Report October 8, 2010<br />
the Green River, which had not supported pinks since World War II, has recently supported runs<br />
up to a quarter million fish (Ames 2004). Typically, less than 2% of pink salmon in Puget Sound<br />
are of hatchery origin.<br />
Chum Salmon<br />
In the Pacific Northwest, chum salmon, like pink and sockeye salmon, are harvested mainly in<br />
Washington State. Today, chum salmon are the most abundant wild salmon species in<br />
Washington, and are predominantly landed with gillnets and purse seines. They are fished in<br />
coastal waters, under state management. Landings of chum salmon have fluctuated widely over<br />
the past fifty years, as run sizes are particularly dependent upon environmental conditions and<br />
are generally volatile (Ames 2004). The 2002 harvest was the largest on record in the past fifty<br />
years (Figure 2.21). However, it is important to recognize that this data set is limited.<br />
Historically, chum populations declined substantially prior to 1950. A more complete picture is<br />
provided in Figure 3.1 in the criterion on Bycatch.<br />
Pacific Northwest Chum Salmon Landings (1950-<br />
2002)<br />
metric tons<br />
10,000.00<br />
9,000.00<br />
8,000.00<br />
7,000.00<br />
6,000.00<br />
5,000.00<br />
4,000.00<br />
3,000.00<br />
2,000.00<br />
1,000.00<br />
0.00<br />
1950<br />
1953<br />
1956<br />
1959<br />
1962<br />
1965<br />
1968<br />
1971<br />
1974<br />
1977<br />
1980<br />
1983<br />
1986<br />
1989<br />
1992<br />
1995<br />
1998<br />
2001<br />
Washington<br />
Oregon<br />
Figure 2.21. Commercial landings of chum salmon in the Pacific Northwest (NMFS 2004b).<br />
According to the Washington Department of Fish and Wildlife, the health of chum stocks is also<br />
variable, largely by region. Washington State divides its chum runs into three main geographic<br />
areas: Puget Sound, Coastal, and Columbia River (Figure 2.22). Puget Sound stocks, which<br />
account for the majority of targeted fish, are at record abundances (with the exception of Hood<br />
Canal summer run stocks). Coastal stocks are less important to the commercial fishing industry,<br />
but also appear to be doing well. Chum populations in the Columbia River, however, are very<br />
depressed, and do not support a directed commercial fishery (see the Inherent Vulnerability and<br />
Bycatch criteria) (Ames 2004). Overall, at present thirty-six chum stocks are classified as<br />
healthy, nine are depressed, two are in critical condition (the Liliwaup Creek and<br />
Jimmycomelately Creek summer runs), eight are already extinct, and fourteen are in unknown<br />
condition (WDFW 2002a).<br />
61
<strong>Seafood</strong> <strong>Watch</strong>® Wild Pacific Salmon Report October 8, 2010<br />
Figure 2.22. Chum areas in Washington State (WDFW 2002a). 18<br />
Puget Sound Chum<br />
Both overall run size and escapement of wild chum in Puget Sound have been increasing since<br />
the mid-1970s (Figure 2.23). Chum in the Pacific Northwest are dominated by the fall run, which<br />
accounts for roughly 90% of the fish. The remainder is comprised of summer and winter runs.<br />
Fall- and winter-run stocks appear to be in excellent health. Of the fifty-five stocks of chum<br />
salmon identified in the Puget Sound area, thirty-eight are considered healthy, and thirteen of the<br />
smaller runs are of unknown condition. As part of an ESA review, the National Marine Fisheries<br />
Service (NMFS) published a coast-wide chum salmon status review in December 1997. This<br />
review found that the Puget Sound/Strait of Georgia ESU was “neither presently at risk of<br />
extinction nor likely to become endangered in the foreseeable future. Current abundance is at or<br />
near historic levels, with a total run size averaging more than 1 million fish annually in the past<br />
five years. The majority of populations within this ESU have stable or increasing population<br />
trends, and all populations with significant trends are increasing” (Johnson et al. 1997). With<br />
respect to hatchery fish, in the mid-1990s roughly 70% of the chum in Puget Sound was of wild<br />
origin, with 30% from hatchery operations.<br />
The exception to the general rule of healthy Puget Sound chum stocks is summer-run chum in<br />
Hood Canal and the Strait of Juan de Fuca. Of these stocks, one is classified by the State of<br />
Washington as depressed, two are considered critical, and a fourth is now extinct. These stocks<br />
are not targeted in commercial fisheries. As such, incidental landings are addressed in the<br />
criterion on Bycatch.<br />
18 This map, supplied by the management agency, is not intended to imply that chum are distributed far into the<br />
interior of Washington State. In reality, chum in the Columbia River do not extend much past the Bonneville Dam.<br />
62
<strong>Seafood</strong> <strong>Watch</strong>® Wild Pacific Salmon Report October 8, 2010<br />
Figure 2.23. Escapement of Puget Sound chum salmon (WDFW 2004a).<br />
Coastal Chum Salmon<br />
Available data suggest that chum in the Coastal region of Washington State are doing well. The<br />
majority of classified stocks (9 of 14) have been classified as healthy, with the status of the<br />
remainder unknown due to poor data on abundance (WDFW 2004a). The southern coast supports<br />
a higher abundance of chum; all stocks in Grays Harbor and Willapa Bay are classified as<br />
healthy. The unknown stocks are all small runs found in streams in the northern coast that<br />
contain a much lower abundance of salmon. The low abundance appears to be the natural<br />
distribution given that the rivers along the north coast lack wide bays and estuaries suitable for<br />
spawning (Ames 2004). The status of stocks along the north coast is generally classified as<br />
unknown (6 stocks), with one stock classified as healthy (WDFW 2004a). The hatchery program<br />
in coastal areas has been stopped, so the fish are predominantly of wild origin.<br />
Columbia River Chum<br />
Historic chum runs on the Columbia River are believed to have approached 1.4 million fish. By<br />
1951, the chum salmon run on the Washington side of the Columbia had been reduced to 25,000<br />
adults. The current run size is even further depleted, with numbers less than 3% of historic runs,<br />
and less than 12% of the 1951 run (WDFW 2004a). Just two population centers for chum salmon<br />
in the Columbia remain. Because neither supports a directed commercial fishery, Columbia<br />
River chum are further addressed in the criterion on Bycatch.<br />
63
<strong>Seafood</strong> <strong>Watch</strong>® Wild Pacific Salmon Report October 8, 2010<br />
Primary Stock Status Factors to Evaluate<br />
Management Status<br />
‣ Underutilized OR close to virgin biomass<br />
AK salmon, WA salmon, OR (north of Cape Falcon) salmon<br />
‣ Fully fished OR recovering from overfished OR unknown<br />
‣ Recruitment/growth overfished, overexploited, depleted, threatened or<br />
“endangered”<br />
Current population abundance relative to B MSY<br />
19<br />
AK salmon<br />
‣ At or above B MSY (> 100%)<br />
WA, OR (north of Cape Falcon) salmon<br />
‣ Below B MSY (50 – 100%) OR unknown (variable)<br />
‣ Substantially below B MSY (e.g., < 50%)<br />
Occurrence of overfishing (current level of fishing mortality relative to overfishing threshold)<br />
‣ Overfishing is not occurring (F CURR /F MSY < 1.0)<br />
‣ Overfishing is likely/probable OR fishing effort is increasing with poor<br />
understanding of stock status OR unknown<br />
‣ Overfishing occurring (F CURR /F MSY > 1.0)<br />
Overall degree of uncertainty in status of stock<br />
‣ Low (i.e., current stock assessment and other fishery-independent data are<br />
robust OR reliable long-term fishery-dependent data available)<br />
‣ Medium (i.e., only limited, fishery-dependent data on stock status<br />
are available)<br />
‣ High (i.e., little or no current fishery-dependent or independent information on stock<br />
status OR models/estimates broadly disputed or out-of-date)<br />
Long-term trend (relative to species’ generation time) in population abundance as measured by<br />
either fishery-independent (stock assessment) or fishery-dependent (standardized CPUE)<br />
measures<br />
AK coho, chum, pink, and sockeye salmon<br />
‣ Trend is up<br />
AK Chinook; OR (north of Cape Falcon), WA salmon<br />
‣ Trend is flat or variable (among areas, over time or among methods)<br />
OR unknown<br />
‣ Trend is down<br />
19 B MSY is the biomass associated with maximum sustainable yield. This standard fishery measure does not apply<br />
very well to anadromous and semelparous salmon. Escapement relative to escapement goals is assessed instead. This<br />
factor’s scoring was updated in 2010 based on the most recent available data on realized escapement (2009), rather<br />
than future projections.<br />
64
<strong>Seafood</strong> <strong>Watch</strong>® Wild Pacific Salmon Report October 8, 2010<br />
Short-term trend in population abundance as measured by either fishery-independent (stock<br />
assessment) or fishery-dependent (standardized CPUE) measures<br />
WA and OR (north of Cape Falcon) Chinook, chum, pink, and sockeye salmon; AK pink<br />
‣ Trend is up<br />
AK chum, coho, and Chinook<br />
‣ Trend is flat or variable (among areas, over time or among methods)<br />
OR unknown<br />
AK sockeye<br />
‣ Trend is down<br />
Current age, size, or sex distribution of the stock relative to natural condition<br />
‣ Distribution(s) is(are) functionally normal<br />
‣ Distribution(s) unknown<br />
‣ Distribution(s) is(are) skewed<br />
Evaluation Guidelines<br />
A “Healthy” Stock:<br />
1) Is underutilized (near virgin biomass); OR<br />
2) Has a biomass at or above B MSY AND overfishing is not occurring AND distribution<br />
parameters are functionally normal AND stock uncertainty is not high.<br />
A “Moderate” Stock:<br />
1) Has a biomass at 50-100% of B MSY AND overfishing is not occurring; OR<br />
2) Is recovering from overfishing AND short-term trend in abundance is up AND<br />
overfishing not occurring AND stock uncertainty is low; OR<br />
3) Has an Unknown status because the majority of primary factors are unknown.<br />
A “Poor” Stock:<br />
1) Is fully fished AND trend in abundance is down AND distribution parameters are<br />
skewed; OR<br />
2) Is overfished, overexploited, threatened, or depleted AND trends in abundance and CPUE<br />
are up; OR<br />
3) Overfishing is occurring AND stock is not currently overfished.<br />
A stock is considered a Critical Conservation Concern and the species is ranked “Avoid,”<br />
regardless of other criteria if it is:<br />
1) Overfished, overexploited, threatened, or depleted AND trend in abundance is flat or<br />
down; OR<br />
2) Overfished AND overfishing is occurring; OR<br />
3) Listed as a “threatened species” or similar proxy by national or international bodies.<br />
65
<strong>Seafood</strong> <strong>Watch</strong>® Wild Pacific Salmon Report October 8, 2010<br />
Pacific Salmon in AK<br />
‣ Low (Stock Healthy)<br />
Conservation Concern: Status of Wild Stocks<br />
Pacific Salmon in WA and OR (north of Cape Falcon)<br />
‣ Moderate (Stock Moderate or Unknown)<br />
Criterion 3: Nature and Extent of Bycatch<br />
Guiding Principle: A sustainable wild-caught species is captured using techniques that minimize<br />
the catch of unwanted and/or unmarketable species.<br />
The term “bycatch” refers to the landing and discarding of animals not specifically targeted by<br />
fishing vessels. Animals may be discarded for a variety of reasons, both economic and<br />
regulatory. Commonly discarded animals include those that are of an undesirable size, sex, or<br />
species. In addition to intentional discards, fishing typically involves some degree of unobserved<br />
animal mortality associated with fishing gear (e.g., animals passing through nets, breaking free<br />
of hooks or lines, and ghost fishing). This incidental or “collateral” mortality is also treated as<br />
bycatch in this review.<br />
Globally, bycatch has been identified as a major problem area in commercial fisheries. It was<br />
estimated in the early 1990s that marine discards sum to between 18 and 40 million tons of<br />
marine life per year worldwide, representing approximately one-third of wild fishery landings<br />
(Alverson et al. 1994). In addition to comprising a large share of marine productivity, bycatch<br />
has also led to the decline of numerous non-target animals including sharks, sea turtles, and<br />
seabirds such as albatrosses. The unintentional destruction of marine life represents one of the<br />
most significant but least-documented pathways that fisheries impact marine ecosystems.<br />
Very little specific information was found for this review with respect to the quantity and<br />
composition of discarded bycatch in salmon fisheries. In general, the gear types used in<br />
commercial and recreational salmon fisheries (trolls and gill-nets) are among the more selective<br />
types of fishing gear. As a result of this selectivity, overall levels of bycatch are generally quite<br />
low in salmon fisheries, relative to other marine fisheries. In addition, the discard mortality rates<br />
(percentage of discard animals that die) associated with hook-and-line and gill-nets are typically<br />
lower than the mortality rates linked with gears such as trawls and dredges. One reviewer noted<br />
that “all major fishing gear types involve some degree of injury to fish by internal and external<br />
wounding, crushing, scale loss, and hydrostatic effects, with the severity of injury dependant on<br />
gear type. Contact among fish in gear ranges from little in hook and line and gill-netting to<br />
moderate in traps and abundant in trawling and purse-seining with brailing” (Davis 2002).<br />
66
<strong>Seafood</strong> <strong>Watch</strong>® Wild Pacific Salmon Report October 8, 2010<br />
While the overall level of bycatch is low in salmon fisheries, the industry’s bycatch can include<br />
species with low or threatened populations. In particular, mid-water gillnets, which are not<br />
attached to the seafloor, have among the worst bycatch effects on seabirds, sharks, and marine<br />
mammals (Chuenpagdee et al. 2003). Because even bycatch at low levels can contribute to the<br />
demise of these at-risk species, it represents a significant concern. The remainder of the analysis<br />
in this criterion focuses on the accidental capture of threatened animals including seabirds,<br />
groundfish, and listed salmonids.<br />
Seabird and Marine Mammal Bycatch<br />
The majority of the U.S. wild salmon harvest in Alaska, Oregon (north of Cape Falcon), and<br />
Washington is landed using gillnets and purse seines. In Alaska, a variety of these nets are used<br />
throughout coastal waters, while trolling is only a small contributor to landings in Southeast<br />
Alaska.<br />
In the Pacific Northwest, gillnets are seasonally employed in a number of coastal areas including<br />
Willapa Bay, Puget Sound, Gray’s Harbor, and the lower Columbia River. According to NMFS<br />
landing statistics, in 1999 and 2000, over 80% of the Chinook salmon harvest in Washington<br />
State was taken using nets. Similarly, almost all of the sockeye, chum, and pink salmon landings<br />
are captured in gillnets and seines. In contrast, California’s landings come almost exclusively<br />
from trolling and just 20% of Oregon landings were taken in nets in 1999 and 2000.<br />
Seabird bycatch in the Pacific Northwest is most frequently associated with the use of gillnets<br />
targeting sockeye and pink salmon, particularly in Puget Sound. Gillnets are up to 1,500 feet<br />
long and can ensnare diving seabirds (Melvin et al. 1999). The long nets, typically set at dusk or<br />
dawn, are released to drift for a set period of time (e.g., “soak” times in OR and WA are typically<br />
limited to 45 minutes). Seabirds, unable to see gillnets, can become entangled and drown.<br />
In the mid-1990s, attention was focused on seabird bycatch in Puget Sound, because one of the<br />
affected birds, the marbled murrelet, is a listed species (Sanford 2004). The gillnet fishery for<br />
sockeye salmon bound for the Fraser River captured marbled murrelets in some areas, though the<br />
most commonly entangled seabirds were common murres (Uria aalge) and rhinoceros auklets<br />
(Ceroghinca monocerata). Melvin et al. (1999) estimated in 1999 that seabird bycatch in this<br />
fishery could be reduced up to 75% by pursuing a three-fold strategy of gear modifications,<br />
restrictions on time-of-day fishing, and abundance-based fishery openings. A combination of<br />
closed areas and gear modifications (making the top of gillnets more visible) was implemented in<br />
the late 1990s to reduce bycatch (Sanford 2004).<br />
In general, the populations of common murres and rhinoceros auklets appear to be relatively<br />
healthy. Murres are among the most numerous seabirds in the northern hemisphere, and<br />
populations have generally been on the rise over the past half-century (Gaston et al. 2003).<br />
Rhinoceros auklets are distributed along the northern half of the Pacific Rim. In North America,<br />
most of the population is found in British Columbia, with smaller numbers in Southeast Alaska,<br />
Washington, and Oregon (Gaston and Dechesne 1996).<br />
Purse seines and hook-and-line gear, in contrast, have a comparatively small rate of seabird<br />
entanglement (Milward 2004, Sanford 2004). Troll gear (hook-and-line gear) in PFMC-regulated<br />
67
<strong>Seafood</strong> <strong>Watch</strong>® Wild Pacific Salmon Report October 8, 2010<br />
waters use a maximum of four to six spreads per line and single point, single shank, barbless<br />
hooks. Trolls remain close to the boats and do not use real bait; as such, some observers have<br />
never seen a bird hooked (Milward 2004). Chum salmon fisheries in the Pacific Northwest also<br />
occur at a different time of the year when seabirds are not as concentrated.<br />
With respect to marine mammals, data from 1991 to 1993 indicate that drift gillnets in<br />
Washington and Oregon killed an estimated 200 harbor seals per year. Most of the mortalities<br />
were observed in the Columbia River, with lower levels reported from Grays Harbor and Willapa<br />
Bay. However, the extent of gillnet fishing effort was much higher in the early 1990s than it is<br />
today, and therefore is not particularly representative. At a population of around 20,000 seals,<br />
this level of mortality is unlikely to have significant negative effects. Moreover, populations of<br />
marine mammals in the Pacific Northwest have generally been on the rise, and are posing<br />
difficulties to endangered species, such as endangered fish attempting to pass through Ballard<br />
Locks (Sanford 2004).<br />
No information on bycatch or mortality of seabirds or marine mammals is available for Alaska,<br />
though fishery managers maintain that it is “very low” (Plotnick 2004).<br />
Non-Salmonid Fish Bycatch<br />
In addition to seabirds, various fish species are incidentally hooked in trolls and caught in gillnets.<br />
Of greatest concern on the West Coast are groundfish, which have undergone significant<br />
population declines over recent decades (BRT 2003). Several species of groundfish are caught<br />
incidentally in salmon fisheries, when trolls are set in deeper waters. Because Chinook salmon<br />
generally are found and fished at greater depths than coho, rockfish incidental catch is highest<br />
when targeting Chinook.<br />
Of the eight overfished groundfish species under the Pacific Fishery Management Council’s<br />
jurisdiction, three (darkblotched rockfish, Pacific Ocean perch, and cowcod) occur in habitat<br />
outside of salmon trolling areas and as such are unlikely to be taken incidentally or discarded. Of<br />
the remaining five, as of 2001 incidental catch in the salmon fishery was only a small fraction of<br />
estimated optimum yields (OYs) (Table 3.1). The largest effect of salmon trolling on groundfish<br />
appears to occur in the canary rockfish fishery. In 2004, troll gear targeting salmon landed an<br />
estimated 1.6 mt of canary rockfish, or 3.4% of the 47 mt optimum yield (PFMC 2004a). More<br />
generally, landings of overfished rockfish in salmon fisheries totaled less than 1% of rockfish<br />
optimum yields.<br />
68
<strong>Seafood</strong> <strong>Watch</strong>® Wild Pacific Salmon Report October 8, 2010<br />
Table 3.1. Landings of overfished groundfish in the PFMC commercial salmon fishery<br />
(PFMC 2004a).<br />
Species<br />
Lingcod Bocaccio Canary Widow Yelloweye<br />
All<br />
Groundfish<br />
Landings (mt) (2000) 0.31 0.20 1.53 0.09 0.16 15.62<br />
Landings (mt) (2001) 0.27 0.01 0.84 0.12 0.10 12.9<br />
OY (2004) 651.00 250.00 47.00 240.00 22.00 -<br />
Percent of OY (average) 0.04% 0.04% 2.52% 0.04% 0.59% < 1%<br />
In general, landings of overfished groundfish appear to be relatively infrequent, and exploitation<br />
rates are unlikely to be high enough to threaten the recovery of groundfish species, relative to<br />
directed commercial fisheries. The PFMC describes average annual groundfish catch in the<br />
salmon fishery as “very low,” such that adjustments and changes to the salmon fishery “do not<br />
substantially alter the projections for harvest-related mortality in the groundfish fishery<br />
(projections made as part of the development of the groundfish annual specifications)” (PFMC<br />
2004). Moreover, most groundfish bycatch are allowed to be landed rather than discarded. 20 As a<br />
consequence, the incidental landings are not officially considered “bycatch” per se. To avoid<br />
redundancy, groundfish landings in commercial salmon trolls ought to be addressed in reviews of<br />
rockfish.<br />
With respect to other fish species hooked in salmon fisheries, such as halibut, highly-migratory<br />
species, and coastal pelagic species, the PFMC notes that “co-occurrence rates for salmon and<br />
these other Council-managed species is low, as well as for non-Council-managed species…. At<br />
present, these other non-salmon stocks are not the subject of overfishing concerns” (PFMC<br />
2004a).<br />
In state waters, gillnets and purse seines in Washington generally have low levels of bycatch.<br />
The most frequently discarded species is reportedly dogfish (Ames 2004). One report of a gillnet<br />
fishery in Willapa River reported discards of anchovy, sardine, shad, crabs, and dogfish (Vander<br />
Haegen et al. 2002).<br />
Salmonid Bycatch<br />
In contrast to seabirds and groundfish, there is significant concern over bycatch and incidental<br />
landings of non-target salmonids. In West Coast salmon fisheries this concern centers on the<br />
capture of salmonids from threatened and endangered ESUs. As discussed in the first two<br />
criteria, many salmon ESUs are in exceedingly poor health. As a result, bycatch or incidental<br />
landings of salmon from these ESUs in the mixed-stock fishery can negatively affect the species’<br />
abundance, even if non-target fish comprise only a small portion of total landings.<br />
20 Certain restrictions apply. For example, in Alaska black rockfish bycatch cannot be sold in specific areas. More<br />
generally, harvest limits exist and groundfish under a minimize size or out of season must be discarded.<br />
69
<strong>Seafood</strong> <strong>Watch</strong>® Wild Pacific Salmon Report October 8, 2010<br />
For many of the ESUs (such as threatened coho and steelhead ESUs), non-retention regulations<br />
have been put in place and the fish are released when caught. For other non-target ESUs, such as<br />
endangered winter-run Chinook, it is difficult to differentiate between target and non-target<br />
stocks. As a consequence, fish from the non-target ESUs are likely to be retained and landed.<br />
Both the discards and incidental landings have the potential to impact listed stocks and can<br />
negatively affect the health of non-target populations (MacCall and Wainwright 2003). Because<br />
the West Coast salmon fishery is a mixed-stock fishery, and landings can unintentionally include<br />
stocks listed under the Endangered Species Act, the review characterizes all non-target salmon<br />
landings (whether discarded or retained) as bycatch. In contrast, the health and abundance of<br />
targeted salmon ESUs have been addressed in the Stock Status criterion.<br />
Data Availability<br />
Data for bycatch of listed salmon stocks is imprecise for a number of reasons. Many affected fish<br />
are not landed and there is no available and definitive means of differentiating between<br />
subspecies of fish that are landed. As a consequence, for many ESUs it remains unclear to what<br />
extent the recovery of listed stocks is hindered by fisheries exploitation. As discussed in the<br />
analysis under the Inherent Vulnerability criterion, ESA-listed Pacific salmon populations are<br />
depleted for numerous reasons, including, but not limited to, habitat loss, habitat degradation,<br />
unfavorable oceanic conditions, and historical overfishing (MacCall and Wainwright 2003).<br />
While the primary reason for these declines has typically been the degradation and loss of fresh<br />
water spawning, rearing, and migration habitats, the continued harvest of these species may be a<br />
contributing factor impeding the recovery of multiple West Coat salmon populations. The<br />
uncertainties involved are generally too large to quantify blame. As the National Marine<br />
Fisheries Service (NMFS 1998) notes: “No single factor is solely responsible for this decline,<br />
though every factor… has contributed to the decline in varying degrees. Given the complexity of<br />
this species' life history and the ecosystem in which it resides… it is impossible to accurately<br />
quantify the relative contribution of any one factor to the decline of a given Chinook salmon<br />
[stock].” With respect to bycatch in particular, the uncertainties surrounding non-target landings<br />
significantly complicate management efforts (Alverson et al. 1994).<br />
One of the major unknowns in managing bycatch is the discard mortality rate, or the percentage<br />
of bycatch released back into the ocean that die due to injuries, stress, or reduced survival skills<br />
as a result of the interaction. Discard mortality rates vary with several factors including the<br />
specific gear used and species landed, as well as “environmental conditions (light conditions,<br />
temperature, air exposure, anoxia, sea conditions, and pressure changes) and biological factors<br />
(fish size and species, behavior, and physiology)” (Davis 2002). Mortality can be immediate or<br />
delayed, occurring later due to subsequent predation, physiological stress, or disease. In addition,<br />
some fish, termed “dropoffs,” encounter fishing gear but escape prior to landing and<br />
subsequently die or are consumed by predators. Captured salmon are often physically exhausted,<br />
and can be damaged from fishing gear or simply stressed, which can weaken a fish’s immune<br />
system “either directly through the endocrine system or via energy shunting” (Farrell et al. 2000,<br />
Davis 2002).<br />
In light of the considerable uncertainties, a range of estimates exist for salmon discard mortality<br />
rates. Buchanan et al. (2002) comment that total discard mortality in traditional gill-nets is<br />
estimated to be 35-70% for coho salmon (Buchanan et al. 2002). An empirical study of a Willapa<br />
70
<strong>Seafood</strong> <strong>Watch</strong>® Wild Pacific Salmon Report October 8, 2010<br />
River gillnet fishery observed immediate mortality of 9.2% for coho and 12.8% for Chinook<br />
salmon; delayed mortality was not estimated (Vander Haegen et al. 2002). The NMFS Biological<br />
Review Team (BRT) employs estimates of hooking mortality rates of 13% for recreational<br />
fisheries and 24% for commercial fisheries, while tacking on an additional 5% for dropoffs. 21<br />
Recent studies of coho caught by hook and line under optimal handling conditions (and<br />
employing the use of on-board recovery tanks) have recorded salmon mortality rates of less than<br />
five percent (Farrell et al. 2001a, Farrell et al. 2001b).<br />
Given the considerable uncertainties involved, progressive fisheries management ought to seek a<br />
precautionary approach that minimizes the bycatch or incidental landings of ESA-listed species.<br />
The remainder of this section documents available evidence on the health and bycatch rates for<br />
each endangered or threatened salmon ESU on the West Coast. When not otherwise specified,<br />
this review has relied on the findings summarized by the most recent Biological Review Team<br />
status assessments (BRT 2003). Summaries are provided in Table 3.2 and Table 3.3, which list<br />
the current assessment of ESU health and management estimates of fishing-related mortality.<br />
In Alaska, the situation is improved by virtue of the fact that Alaskan salmon runs are in<br />
considerably better health than their counterparts in the contiguous United States (see the Stock<br />
Status criterion). Fisheries are less likely to incidentally harvest salmon of endangered or<br />
threatened runs simply because there are no listed salmon ESUs in Alaska, though some Chinook<br />
salmon from listed stocks in the Pacific Northwest are presumably landed in the Chinook troll<br />
fishery in Southeast Alaska, where Chinook migrate seasonally from as far south as California.<br />
According to a recent study of troll-caught salmon in Southeast Alaska, there are a number of<br />
major contributors to Chinook harvests in this region. These include mid- and north-Oregon<br />
stocks, Columbia River fall and summer stocks, Washington coastal Chinook, Chinook from<br />
British Columbia, and Chinook from rivers in Southeast Alaska (Templin and Steeb 2003).<br />
However, the harvest rate of listed stocks taken in Alaska is small in comparison to harvest in<br />
British Columbia, Washington, Oregon and California (Chaffee et al. 2007). For example,<br />
exploitation rates of ESA-listed Snake River fall Chinook in the southeast Alaska fishery are<br />
about 4.5%, exploitation rates of upper Willamette spring Chinook are about 5.1%, and<br />
exploitation rates of Puget Sound Chinook are approximately 0.4% (Chaffee et al. 2007). In<br />
contrast to the higher harvest rates in British Columbia and the lower states, these low levels of<br />
exploitation in the Southeast Alaska fishery pose only a moderate risk to endangered and<br />
threatened salmon. Fisheries in other parts of Alaska are not believed to take listed salmon.<br />
21 The recreational fisheries estimates are in line with the 12.2% mortality rate estimated in a recent experimental<br />
study of catch-and-release Willamette River Chinook (Lindsay et al. 2004).<br />
71
<strong>Seafood</strong> <strong>Watch</strong>® Wild Pacific Salmon Report October 8, 2010<br />
Table 3.2. Salmon species listed under the Endangered Species Act.<br />
(Sources: NMFS website 2004, California Department of Fish & Game, Oregon<br />
Department of Fish & Wildlife, and NMFS Biological Review Team (BRT), 2003).<br />
ESU<br />
Chinook<br />
Known<br />
Range<br />
Federal<br />
Listing<br />
State<br />
Listing<br />
Sacramento River Winter CA Endangered Endangered (CA)<br />
Central Valley Spring CA Threatened Threatened (CA)<br />
Central Valley Fall/Late Fall<br />
CA<br />
Species of<br />
Concern<br />
California Coastal CA Threatened<br />
Upper Klamath Trinity River CA Not Warranted<br />
Species of Special<br />
Concern (CA)<br />
BRT<br />
Conclusions<br />
“in danger of<br />
extinction”<br />
“likely to become<br />
endangered”<br />
“likely to become<br />
endangered”<br />
Southern OR & N. CA Coastal CA/OR Not Warranted<br />
Oregon Coast OR Not Warranted<br />
Upper Willamette River OR Threatened<br />
Deschutes River Summer/Fall OR Not Warranted<br />
Lower Columbia OR/WA Threatened<br />
Middle Columbia River Spring OR/WA Not Warranted<br />
Snake River Spring/Summer OR/WA Threatened Threatened (OR)<br />
Snake River Fall OR/WA Threatened Threatened (OR)<br />
Upper Columbia River<br />
Summer/Fall<br />
WA<br />
Not Warranted<br />
Upper Columbia River Spring WA Endangered<br />
Puget Sound WA Threatened<br />
Washington Coast WA Not Warranted<br />
“likely to become<br />
endangered”<br />
“likely to become<br />
endangered”<br />
“likely to become<br />
endangered”<br />
“likely to become<br />
endangered”<br />
“in danger of<br />
extinction”<br />
“likely to become<br />
endangered”<br />
72
<strong>Seafood</strong> <strong>Watch</strong>® Wild Pacific Salmon Report October 8, 2010<br />
Table 3.2 (Continued). Salmon species listed under the Endangered Species Act.<br />
(Sources: NMFS website 2004, California Department of Fish & Game, Oregon<br />
Department of Fish & Wildlife, and NMFS Biological Review Team (BRT), 2003).<br />
ESU<br />
Coho<br />
Freshwater<br />
Range<br />
Federal<br />
Listing<br />
State<br />
Listing<br />
BRT<br />
Conclusions<br />
“in danger of<br />
Central California Coast CA Endangered Endangered (CA)<br />
extinction”<br />
Southern Oregon/Northern<br />
“likely to become<br />
CA/OR Threatened Threatened (CA)<br />
California<br />
endangered”<br />
Interior Fraser BC Endangered N/A<br />
Oregon Coast OR Threatened<br />
Lower Columbia River/<br />
Southwest WA<br />
Puget Sound/Strait of Georgia<br />
OR Threatened Endangered (OR)<br />
WA<br />
Species of<br />
Concern<br />
Olympic Peninsula WA Not Warranted<br />
Chum<br />
Hood Canal Summer Run OR/WA Threatened<br />
Lower Columbia River OR/WA Threatened<br />
Sockeye<br />
Snake River ID Endangered<br />
Lake Ozette WA Threatened<br />
“likely to become<br />
endangered”<br />
“in danger of<br />
extinction”<br />
“likely to become<br />
endangered”<br />
“likely to become<br />
endangered”<br />
“in danger of<br />
extinction”<br />
“likely to become<br />
endangered”<br />
Cultus Lake BC Threatened N/A<br />
Sakinaw Lake BC Endangered N/A<br />
Steelhead<br />
CA/OR/WA<br />
Variable:<br />
Includes<br />
Endangered and<br />
Threatened<br />
Variable: Includes<br />
Endangered and<br />
Threatened<br />
Variable: 3 stocks<br />
“in danger of<br />
extinction,”<br />
7 stocks “likely to<br />
become endangered”<br />
73
<strong>Seafood</strong> <strong>Watch</strong>® Wild Pacific Salmon Report October 8, 2010<br />
Table 3.3. Harvest rates of Endangered and Threatened salmon ESUs (PFMC 2004c).<br />
ESU<br />
Sacramento River Winter Chinook<br />
Central Valley Spring Chinook<br />
California Coastal Chinook<br />
Upper Willamette River Chinook<br />
Lower Columbia Chinook<br />
Snake River Spring/Summer Chinook<br />
Snake River Fall Chinook<br />
Upper Columbia River Spring Chinook<br />
Puget Sound Chinook<br />
Central California Coast Coho<br />
Interior Fraser Coho<br />
Southern Oregon/Northern California<br />
Coho<br />
Oregon Coast Coho<br />
Lower Columbia River/Southwest WA<br />
Coho<br />
Hood Canal Summer Run Chum<br />
Lower Columbia River Chum<br />
Snake River Sockeye<br />
Lake Ozette Sockeye<br />
Cultus Lake Sockeye<br />
Sakinaw Lake Sockeye<br />
Steelhead (all)<br />
BRT<br />
Conclusions<br />
“in danger of<br />
extinction”<br />
“likely to become<br />
endangered”<br />
“likely to become<br />
endangered”<br />
“likely to become<br />
endangered”<br />
“likely to become<br />
endangered”<br />
“likely to become<br />
endangered”<br />
“likely to become<br />
endangered”<br />
“in danger of<br />
extinction”<br />
“likely to become<br />
endangered”<br />
“in danger of<br />
extinction”<br />
“in danger of<br />
extinction”<br />
“likely to become<br />
endangered”<br />
“likely to become<br />
endangered”<br />
“in danger of<br />
extinction”<br />
“likely to become<br />
endangered”<br />
“likely to become<br />
endangered”<br />
“in danger of<br />
extinction”<br />
“likely to become<br />
endangered”<br />
“in danger of<br />
extinction”<br />
“in danger of<br />
extinction”<br />
Variable: 3 stocks “in<br />
danger of extinction”<br />
Exploitation Rate<br />
40% in 2003, ~20% expected for 2004<br />
< 27% in 2001, based on Central Valley harvest index<br />
(CVI)<br />
Unknown; “Low”<br />
Unknown; 1980-99 mean 48%.<br />
~40% (1980-99 mean: 56% fall tule, 41% fall bright,<br />
84% spring)<br />
Unquantified: “Generally Low”; 1980-99 mean: 8%<br />
spring, 3% summer.<br />
20-40% (since 1990); 1980-99 mean 62%.<br />
Unknown. Previously 20-40% before management<br />
actions. 1980-99 mean: 9%<br />
44% 5-year average; 26-63% range<br />
3-12%<br />
6.5%<br />
3-8%<br />
7-12%<br />
~10%<br />
4% (1998-2002 mean: 1-13% range)<br />
< 10%<br />
Undocumented - Presumably low<br />
Undocumented - Presumably low<br />
Undocumented - Presumably low<br />
Undocumented - Presumably low<br />
Steelhead bycatch = “Rare event” in ocean fisheries;<br />
common in some freshwater fisheries. 1980-99 mean 12-<br />
36% by listed run in Columbia and Snake Rivers.<br />
74
<strong>Seafood</strong> <strong>Watch</strong>® Wild Pacific Salmon Report October 8, 2010<br />
Chinook Salmon Bycatch<br />
West Coast Chinook salmon includes nine Chinook ESUs which have been determined to be<br />
Endangered or Likely to Become Endangered by the current Biological Review Team (BRT)<br />
status review. Because of this listing status, each of the nine ESUs is considered a non-target<br />
species and treated as bycatch in this assessment. Non-target Chinook salmon are primarily<br />
landed in commercial Chinook fisheries.<br />
The Oregon and Washington ocean Chinook fisheries target a range of stocks including<br />
California Sacramento River fall and Klamath River fall Chinook, Oregon Coastal Chinook, and<br />
Columbia River tule Chinook stocks. These fisheries can affect listed Chinook salmon ESUs in<br />
California as well as several in Oregon and Washington.<br />
Alaska does not have any listed Chinook stocks. As such, Chinook salmon of Alaskan origin are<br />
not addressed under the Bycatch criterion. However, Alaskan fisheries, such as the Southeast<br />
Alaskan Chinook troll fishery, may contribute to landings of Chinook of some endangered runs.<br />
Sacramento River Winter Chinook<br />
Population Status: In Danger of Extinction<br />
Sacramento River winter-run Chinook are officially listed as an endangered species, and<br />
represent one of the most endangered of the salmon ESUs. Whereas summer- and fall-run<br />
Chinook populations are common in many areas, winter-run Chinook salmon are limited to the<br />
Sacramento River (Waples et al. 2004). Historic populations upwards of 200,000 fish declined<br />
four orders of magnitude to under 200 fish by the 1980s (Lindley and Mohr 2003). In the most<br />
recent years, Sacramento River winter Chinook spawner escapements have increased marginally.<br />
Escapements of endangered winter Chinook in 2003 were estimated at 6,200 adults, ten times the<br />
extremely low 600 adult escapements observed three years earlier, but well below the initial<br />
recovery goal of 10,000 female spawners per year and a lambda (growth rate) of 1.0 calculated<br />
over 13 years of data. As of 2003, the quasi-extinction risk was estimated at 28% for the run<br />
(BRT 2003).<br />
Bycatch Rates<br />
Historically “overfishing” and “unsustainable harvest rates” have contributed to the demise of<br />
the Sacramento River winter-run Chinook ESU (BRT 2003). As with most fisheries, data on the<br />
ocean harvest rate of the stock is not well known. In the case of winter Chinook, harvest rates are<br />
estimated using the Central Valley Chinook ocean harvest index (CVI), defined as the ratio of<br />
ocean catch south of Point Arena to the sum of this catch and the escapement of Chinook to<br />
Central Valley streams and hatcheries. The CVI varied between 0.55 and 0.80 from 1970 to<br />
1995, when management actions were instituted to protect winter run populations. In 2001, the<br />
CVI fell to 0.27, implying that marine exploitation of winter-run Chinook is less than 27%.<br />
Despite numerous measures to reduce fishing pressure, rudimentary coded tag return information<br />
in 2003 indicated that over 40% of the returning Sacramento River winter Chinook salmon<br />
spawner population was captured in ocean and in-river fisheries (BRT 2003). The increase was<br />
due to larger than anticipated in-river harvests. Recent emergency regulations are expected to<br />
reduce the incidental take of winter-run Chinook to approximately 20% in 2004.<br />
75
<strong>Seafood</strong> <strong>Watch</strong>® Wild Pacific Salmon Report October 8, 2010<br />
Upper Columbia Spring Chinook<br />
Population Status: In Danger of Extinction<br />
Upper Columbia spring Chinook salmon runs also remain in very poor health, and appear to be<br />
continuing to deteriorate. Columbia spring Chinook are particularly unusual, in that, unlike<br />
Chinook salmon in other regions, in the interior Columbia River Basin, spring-run Chinook<br />
populations are notably genetically divergent from summer- and fall-run populations. This<br />
difference represents an older evolutionary event (Waples et al. 2004). Unfortunately, long-term<br />
trends in spawning escapement are negative in all three of the main spawning areas (Wenatchee<br />
River, Entiat River, and Methow River) for spring-run Chinook. The BRT (BRT 2003) reports:<br />
“The Wenatchee River spawning escapements have declined an average of 5.6% per year, the<br />
Entiat River population at an average of 4.8%, and the Methow River population an average rate<br />
of 6.3% per year since 1958.” These declining population trends continued through 2001.<br />
Similarly, short-term trends in population size (1990-2001) were also negative for all three upper<br />
Columbia River spring Chinook populations, on average falling between 3% and 16%. Average<br />
spawning escapement from 1997 to 2001 fell to between 8% and 15% of target delisting levels.<br />
One study estimates that there is over a 50% chance Upper Columbia River spring Chinook will<br />
be extinct in fifty years, and greater than a 95% chance that the population will suffer a decline<br />
more than 90% (McClure et al. 2003).<br />
Bycatch Rates<br />
Uncertainty regarding Chinook populations and their ocean harvest rates make it difficult to<br />
assess the status of the stock. Exploitation rates of Upper Columbia River Chinook salmon<br />
spring-run in the lower-river commercial fishery are estimated to have been around 30-40%<br />
through the early 1970s, primarily from main-stem fisheries below McNary Dam and<br />
recreational fisheries. No current data are available, but this rate has been reduced substantially<br />
(BRT 2003). The PFMC estimates that Council-managed ocean fisheries harvest less than 2% of<br />
summer- and spring-run Columbia River Chinook (this does not include in-river exploitation or<br />
British Columbia and Alaskan ocean salmon fisheries).<br />
California Central Valley Spring Chinook<br />
Population Status: Likely to Become Endangered<br />
Only three populations of California Central Valley spring-run Chinook salmon with consistent<br />
spawning runs remain: Mill Creek, Deer Creek, and Butte Creek. Despite historically supporting<br />
runs in the range of 700,000 spawners, during the 1980s populations fell to a few hundred fish on<br />
average. Spring-run salmon have been eliminated from most of the Central Valley, including all<br />
San Joaquin River tributaries.<br />
Following changes in management and some habitat improvements in the early 1990s,<br />
populations in the three remaining runs started to rebound. Both long- and short-term growth<br />
rates in the population of these runs are positive, with maximum returns in the last five years of<br />
~6,000 fish.<br />
Bycatch Rates<br />
As with winter-run Chinook, bycatch rates of Central Valley spring-run Chinook are estimated<br />
through the Central Valley Chinook salmon ocean harvest index (CVI). The CVI ranged between<br />
0.55 and 0.80 from 1970 to 1995. In 2001, the CVI fell to 0.27, implying that spring Chinook<br />
76
<strong>Seafood</strong> <strong>Watch</strong>® Wild Pacific Salmon Report October 8, 2010<br />
exploitation rates are under 27%. This reduction is presumed to be partly responsible for the<br />
rebound in spring-run populations. No more specific estimates of spring-run exploitation rates<br />
are available.<br />
California Coastal Chinook<br />
Population Status: Likely to Become Endangered<br />
Data on the abundance and distribution of the California Coastal Chinook ESU are sparse. The<br />
stock was listed as threatened in previous reviews due to several concerns including low and<br />
declining abundance, as well as a reduced geographic range. In the mid-1960s, the already highly<br />
degraded habitat supported an estimated 70,000 spawners. Today, abundance in independent<br />
populations of California Coastal Chinook salmon appears depressed to just a few thousand fish<br />
in the few basins where they are monitored. In addition, many populations no longer exist. The<br />
BRT (2003) notes: “Reduction in geographic distribution, particularly for spring-run Chinook<br />
salmon and for basins in the southern portion of the range, continues to present substantial risk.”<br />
There has been a recent increase in returns to the Russian River, with between 1,300 and 5,500<br />
spawners over the past three years of data; however, the genetic composition of these runs is<br />
uncertain (i.e., they may be of hatchery origin, rather than wild fish), such that their relevance to<br />
the overall status of the ESU remains unclear.<br />
Bycatch Rates<br />
Incidental landings of California Coastal Chinook have not been explicitly estimated. In 2000,<br />
NMFS concluded that ocean salmon fishing in accordance with the Salmon Fishery Management<br />
Plan (FMP) was likely to jeopardize the continued existence of California Coastal Chinook.<br />
Harvest rates have been reduced and the PFMC considers it likely that “current restrictions on<br />
harvest of Klamath River fall Chinook maintain low ocean harvest of Chinook salmon from the<br />
California Coastal ESU” (BRT 2003). In other words, restrictions on the ocean fishery targeting<br />
Klamath River Chinook have reduced the exploitation of California Coastal Chinook.<br />
Upper Willamette Chinook<br />
Population Status: Likely to Become Endangered<br />
Little information is available for Upper Willamette Chinook runs, which are obviously in poor<br />
health. The BRT concisely notes: “Most natural spring Chinook populations are likely extirpated<br />
or nearly so. The only population considered potentially self-sustaining is the McKenzie.<br />
However, its abundance has been relatively low (low thousands) with a substantial number of<br />
these fish being of hatchery origin. The population has shown a substantial increase in the last<br />
couple of years, hypothesized to be a result of improved ocean survival” (BRT 2003).<br />
Bycatch Rates<br />
No estimates are provided by the PFMC for Upper Willamette Chinook. However, an<br />
independent analysis (McClure et al. 2003) found that “changes in the harvest levels could have<br />
relatively large effects on the population growth rates of the Upper Willamette River, Snake<br />
River fall, and Lower Columbia River Chinook ESUs. These three ESUs are subject to harvest<br />
both in the ocean and in-river, resulting in higher overall harvest rates than those seen in other<br />
ESUs.”<br />
77
<strong>Seafood</strong> <strong>Watch</strong>® Wild Pacific Salmon Report October 8, 2010<br />
Lower Columbia River Chinook<br />
Population Status: Likely to Become Endangered<br />
Lower Columbia River Chinook are threatened, with wild spawner abundances continuing to<br />
decline since 1998 and short and long-term population growth rates negative. Spring-run<br />
Chinook have largely been extirpated due to habitat loss from hydroelectric facilities. Fall runs<br />
have fared only marginally better, with populations diluted through large-scale hatchery releases<br />
as well as “relatively high harvest and extensive habitat degradation” (BRT 2003). Only one<br />
remaining run, the Lewis River late fall Chinook run, maintains a significant probability of being<br />
self-sustaining.<br />
Bycatch Rates<br />
An estimated 40% of Lower Columbia River adults in the runs that have not been extirpated are<br />
harvested. The BRT (2003) characterizes these rates as “relatively high.” Reductions in fishery<br />
exploitation could have significant positive effects on the growth rate of this ESU (McClure et al.<br />
2003).<br />
Snake River Spring/Summer Chinook<br />
Population Status: Likely to Become Endangered<br />
Historic abundance of spring- and summer-run Chinook in the Snake River may have totaled<br />
more than 1.5 million spawners per year. By the late 1960s returns were closer to 100,000, and<br />
have continued to decline. In recent years, less than 5,000 summer-run salmon have been<br />
recorded in the Snake River, and spring-run returns passing over Lower Granite Dam have<br />
generally remained well under 20,000 fish. As such, long-term population growth rates since the<br />
1960s are less than 1.0. While year 2001 spawner abundances were substantially higher than in<br />
past years (more than 17,000 naturally-produced spring Chinook), hatchery fish appear to have<br />
excessive influence on the stock, with an estimated 88% of hatchery origin (BRT 2003).<br />
Bycatch Rates<br />
No quantitative estimates of landings of Snake River spring/summer Chinook runs are available.<br />
The Biological Review Team simply asserts that “harvest impacts on Snake River spring<br />
Chinook are generally low. Ocean harvest rates are also low” (BRT 2003). Feist, Steel et al.<br />
(2003) comment that, for the Snake River spring/summer Chinook ESU, “there is an enormous<br />
urgency to reverse their population decline. Hatchery supplementation and harvest pressure<br />
reductions (currently estimated at ~8%…) apparently have not reversed population declines.”<br />
Snake River Fall Chinook<br />
Population Status: Likely to Become Endangered<br />
Snake River fall-run Chinook salmon have suffered major declines in abundance since as late as<br />
the 1970s. However, since the mid-1990s Snake River fall runs have improved, due in large<br />
measure to increased hatchery production. Long-term growth rates are masked in part by the<br />
presence of hatchery fish, but appear to be somewhere between 0.90 and 1.02 (declining or<br />
stable). Wild salmon returns were estimated at 2,600 fish in 2001, with a 5-year average of 870<br />
fish, well shy of the delisting abundance criteria for Snake River fall Chinook (an 8-year average<br />
of 2,500 natural spawners).<br />
78
<strong>Seafood</strong> <strong>Watch</strong>® Wild Pacific Salmon Report October 8, 2010<br />
Bycatch Rates<br />
Previous reviews of Snake River fall Chinook identified the “relatively high aggregate harvest<br />
impacts in ocean and in-river fisheries” as one of the main causes for concern in this ESU (BRT<br />
2003). Snake River fall Chinook are landed in a number of fisheries because of their pattern of<br />
ocean distribution and the timing of their spawning run up the Columbia River. Since 1990,<br />
landings of Snake River fall Chinook have eliminated between 20% and 40% of returning fish<br />
(BRT 2003). The current allowable total exploitation rate on Snake River fall fish is 50%.<br />
Statistical analysis indicates that reductions in the harvest level of Snake River Chinook could<br />
have relatively large positive effects on the population growth rates of the ESU (McClure et al.<br />
2003).<br />
Puget Sound Chinook<br />
Population Status: Likely to Become Endangered<br />
Historically, the Puget Sound area supported Chinook salmon runs of nearly 700,000 fish. By the<br />
early 1990s, the average run size had been reduced to 24,000 fish—less than 4% of its traditional<br />
breadth. Nine of the thirty-one known runs appear to have been completely eliminated, and at<br />
present populations in half of the remaining runs are declining, while populations in the<br />
remaining half are increasing. Over the past decade, salmon populations have fared less poorly<br />
and many have halted the declines in their numbers, though these recoveries may be attributable<br />
in part to hatchery fish. If hatchery fish spawn at the same rate as wild fish, then half of the runs<br />
have continued to decline over the past decade (BRT 2003).<br />
Bycatch Rates<br />
The BRT characterizes the exploitation of the Puget Sound stocks over the past two decades as<br />
“quite high,” with average exploitation on natural stocks in the 1980s between 65% and 85%,<br />
exceeding 90% for specific stocks. Over the most recent five years for which data is available,<br />
harvest rates on Puget Sound Chinook populations averaged 44% overall, but ranged between<br />
26% and 63% by population.<br />
Coho, Chum, and Sockeye Salmon, and Steelhead<br />
As with Chinook salmon, several other salmon stocks are in very poor shape. For example, of the<br />
six coho evolutionarily significant units (ESUs) identified for California, Oregon, and<br />
Washington, the Biological Review Team has listed two coho ESUs as endangered (Central<br />
California Coast coho and Lower Columbia River/Southwest Washington coho) and two coho<br />
ESUs as likely to become endangered (Southern Oregon/Northern California Coastal coho and<br />
Oregon Coast coho). Interior Fraser coho in British Columbia has been listed as endangered by<br />
Canadian authorities. Similarly, two chum stocks, two U.S. sockeye stocks, two Canadian<br />
sockeye stocks, and numerous steelhead stocks are listed as endangered.<br />
Bycatch represents a potential threat to fish in these ESUs, which can be caught in commercial<br />
and recreational salmon fisheries. Unlike Chinook salmon, directed commercial fisheries for<br />
these non-target fish have been closed for several years. However, wild fish are still caught<br />
accidentally in Chinook fisheries and recreational coho fisheries in the Pacific Northwest.<br />
The Pacific Fisheries Management Council (PFMC) has made several efforts to reduce coho and<br />
other salmon landings and discards. The 1999 Supplemental Biological Opinion and Incidental<br />
79
<strong>Seafood</strong> <strong>Watch</strong>® Wild Pacific Salmon Report October 8, 2010<br />
Take Statement for coho required the following: 1) no directed coho fishing in all commercial<br />
and recreational fisheries off California; 2) marine fishery impacts on threatened coho stocks<br />
must be no more than 13%; and 3) fishery impacts on Oregon Coastal stocks should not exceed<br />
levels permitted by the Salmon FMP, which was 15% in 2003.<br />
Despite the non-retention regulations, some discard mortality continues. Studies of adult coho<br />
salmon indicate that fish captured in various gear types (troll, gillnet, and seine) arrive on board<br />
“in a state of severe metabolic exhaustion,” with minimal physiological differences observed<br />
between salmon caught in different gear types (Farrell et al. 2000). Following a literature review,<br />
the PFMC adopted an estimate of the hooking mortality rates of 13% for recreational fisheries<br />
and 24% for commercial fisheries. On top of these rates, the PFMC assumed that dropoff<br />
mortalities occur, and estimated the number to be 5% of the number of fish landed (BRT 2003).<br />
As with Chinook, the following section documents existing information on the current<br />
population status of endangered and threatened ESUs for both various non-target salmonids<br />
Central California Coast Coho<br />
Population Status: In Danger of Extinction<br />
Best guesses indicate that spawning populations of Central California Coast (CCC) coho were in<br />
the range of 200,000 to 500,000 fish in the 1940s, well after substantial habitat damage had<br />
occurred. By the late 1980s, wild coho in this ESU are thought to have declined to less than<br />
7,000 fish. The California Department of Fish and Game reports that CCC coho are no longer<br />
present in 58% of the streams they historically inhabited, and that occupancy trends continued to<br />
decline between 1987 and 2000, though they increased in 2001. With state coho populations at<br />
just 6-15% of levels in the 1940s, the California Fish and Game Commission voted in August<br />
2004 to list coho south of Punta Gorda as endangered under the California Endangered Species<br />
Act, and coho north of Punta Gorda as threatened.<br />
Bycatch Rates<br />
Retention of coho is prohibited in both recreational and commercial troll fisheries in California<br />
and southern Oregon in an effort to reduce impacts. North of Humbug Mountain in Oregon,<br />
selective fishing is allowed for hatchery-marked coho. The recent status reviews note that despite<br />
non-retention regulations, some mortality may be associated with coho incidentally-caught in the<br />
Chinook fishery, or through poaching. The numbers incidentally taken and released are not well<br />
known. The BRT reports that “total estimated incidental and illegal harvest of coho salmon has<br />
not exceeded 1000 fish in any year since non-retention regulations were put in place” (BRT<br />
2003). Inferred exploitation rates of this stock, from 1998 to 2002, still range from 3-12%. These<br />
exploitation rates are below the threshold goal of 13% set by the PFMC.<br />
Interior Fraser Coho<br />
Population Status: In Danger of Extinction<br />
Interior Fraser coho are one of three Canadian salmon stocks listed as endangered. There are no<br />
estimates of the abundance of Interior Fraser coho salmon prior to the arrival of Europeans.<br />
Abundance in the 1920s and 1930s has been estimated at roughly 400,000 fish. In recent years,<br />
the total population of spawners has been reduced to around 24,000 fish, roughly 15% of which<br />
are of hatchery origin (Irvine 2002). In 1991, 1995, 1997, and 1998, productivity was so low that<br />
the ESU was unable to sustain itself even with no fisheries exploitation.<br />
80
<strong>Seafood</strong> <strong>Watch</strong>® Wild Pacific Salmon Report October 8, 2010<br />
Bycatch Rates<br />
Canadian fishery managers report that “coded wired tags from coho salmon that were spawned in<br />
the interior Fraser River have been recovered in fisheries from Alaska to Oregon. Most were<br />
gathered during troll and sport fisheries off the West Coast of Vancouver Island and in the Strait<br />
of Georgia” (Irvine 2002). Even recently, exploitation rates were historically very high. From<br />
1987 to 1996 the estimated annual exploitation rate for Interior Fraser coho salmon (U.S. and<br />
Canada) was 68%. Following management action the rate was reduced ten-fold to 6.5% from<br />
1998 to 2000 (Irvine 2002).<br />
Southern Oregon/Northern California Coho<br />
Population Status: Likely to Become Endangered<br />
Abundance data for the Southern Oregon/Northern California Coast (SONCC) coho population<br />
are sparse, particularly for the California share of the ESU. Generally, annual spawner<br />
populations are known to have declined from several hundred thousand fish in the 1940s, to an<br />
estimated 7,000 SONCC fish in California in the late 1980s. From the late 1980s to 2000, the<br />
estimated percentage of streams in the SONCC for which coho were detected ranged between<br />
36% and 61%. There was generally a decline in occupancy rates over the past decade, the<br />
significance of which is unclear.<br />
Bycatch Rates<br />
As with Central California Coast coho, retention of non-hatchery SONCC coho is prohibited.<br />
Any fishing mortality is presumably either incidental mortality or from poaching. No reliable<br />
numbers are available for the number of coho killed incidentally. The majority (93-97%) of<br />
ocean fishing mortality of SONCC coho appears to occur in Chinook-directed fisheries in<br />
California and Oregon, south of Humbug Mountain, rather than in hatchery coho-directed<br />
fisheries. The PFMC determines mortality by proxy via mortality on Rogue and Klamath River<br />
(RK) hatchery stocks. Current exploitation rates on these stocks are low; they are estimated to<br />
generally lie in the range of 3-8%, comfortably below the management target of
<strong>Seafood</strong> <strong>Watch</strong>® Wild Pacific Salmon Report October 8, 2010<br />
actual mortalities may be greater. It is difficult to assess the risk to these stocks resulting from<br />
harvest at these levels” (BRT 2003).<br />
Lower Columbia River Coho<br />
Population Status: In Danger of Extinction<br />
Lower Columbia River coho salmon are in extremely poor health, and remain in imminent<br />
danger of extinction. Over 90% of the historical populations in the Lower Columbia River have<br />
been effectively extirpated, with just two populations (the Clackamas and Sandy River)<br />
supporting runs. Both the Clackamas and Sandy River runs reflect “low abundance, declining<br />
trends and failure to respond after a dramatic reduction in harvest” (BRT 2003). In the<br />
Clackamas River, the native run is at a high risk of extinction, while the Sandy River coho<br />
population has also failed to recover. A slight rebound seen in 2000 and 2001 was not repeated in<br />
2002. In summary, BRT (2003) states: “Of the 21 putative populations, most were considered<br />
extirpated, or nearly so, during the low marine survival period of the 1990s (reviewed in NMFS<br />
2001a)…. Of the two populations where natural production can be evaluated, both have<br />
experienced recruitment failure over the last decade. Recent abundances of the two populations<br />
are relatively low (especially the Sandy River), placing them in a range where environmental,<br />
demographic and genetic stochacity (sic) can be significant risk factors.”<br />
Bycatch Rates<br />
In the last three seasons, the harvest rate for Clackamas River natural-origin coho is estimated to<br />
be approximately 10%. This exploitation rate is significantly below rates above 60% that were<br />
the rule prior to 1994. The BRT provided no analysis on the effects of the harvest rate on<br />
population stability.<br />
Hood Canal Summer Run Chum<br />
Population Status: Likely to Become Endangered<br />
The Hood Canal summer-run chum ESU is listed as threatened, and remains listed as likely to<br />
become endangered. Of the sixteen historic populations of summer-run chum in the Hood Canal<br />
ESU, half no longer exist. Abundance trends in the remaining eight are negative for all but two<br />
runs (the Quilcene and Union Rivers), with the median late indicating a decline of 6% per<br />
annum. Short term trends in abundance have been more positive, with seven of the eight<br />
remaining populations growing between 1990 and 2002.<br />
Bycatch Rates<br />
In the 1997 BRT review, one of the several threats identified to the continued existence of<br />
summer-run Hood Canal chum salmon was a high incidental harvest in salmon fisheries in Hood<br />
Canal and the Strait of Juan de Fuca. The mean exploitation rate from 1979 to 1997 was 36%.<br />
Following changes in fisheries management, the estimated exploitation rate has dropped<br />
substantially. From 1998 to 2002, the estimated fishery exploitation rate for Hood Canal<br />
summer-run chum varied from 1% to 13% by population, with a mean exploitation rate for<br />
remaining populations of 4%. The BRT does not provide an estimate for the effects of the<br />
remaining harvest on recovery prospects.<br />
82
<strong>Seafood</strong> <strong>Watch</strong>® Wild Pacific Salmon Report October 8, 2010<br />
Lower Columbia River Chum<br />
Population Status: Likely to Become Endangered<br />
The Lower Columbia River chum salmon ESU has also been decimated over the past century.<br />
Historical runs approaching one million fish per year have averaged just a few thousand fish over<br />
the past half century. Of the 16 known historical populations, only two remain (Grays River and<br />
the Lower Gorge). For the Grays River run, long-term trends in abundance have been negative<br />
since 1950 and over the short-term as well. Similarly, in the Lower Gorge, available data indicate<br />
that since 1950 there has been a downward trend in populations and low abundances up to 2000.<br />
Year 2002, however, witnessed a substantial increase in spawner abundance.<br />
Bycatch Rates<br />
As with other stocks, no information is available on estimated harvest rates for Lower Columbia<br />
River chum. Historical estimates of harvest rates over the past century (through 1994) are<br />
provided in Figure 3.1. They are estimated/presumed to have been at 80% in the earlier half of<br />
the century. In the 1960s, most chum salmon were caught incidentally in fisheries targeting<br />
hatchery coho salmon. Recent harvest rates have presumably remained below 10%. Incidental<br />
catch of chum salmon in the Lower Columbia River commercial fishery has been less than 100<br />
fish per year since 1993 (WDFW 2002a). No estimates of the effects of these harvest rates have<br />
been provided.<br />
Figure 3.1. Columbia River chum salmon returns (BRT 2003).<br />
83
<strong>Seafood</strong> <strong>Watch</strong>® Wild Pacific Salmon Report October 8, 2010<br />
Snake River and Ozette Lake Sockeye<br />
Population Status: Ozette Lake: Likely to Become Endangered<br />
Snake River: In Danger of Extinction<br />
Of the six or seven sockeye salmon ESUs on the West Coast, two have been listed under the U.S.<br />
Endangered Species Act (ESA). Neither the Snake River nor the Ozette Lake sockeye salmon<br />
ESUs are faring well. In the case of the Snake River, just sixteen naturally-produced adult fish<br />
have returned to spawn since 1991, and all sixteen were immediately placed into the captive<br />
spawner program. The BRT unanimously voted that the Snake River ESU is in danger of<br />
extinction.<br />
The Ozette Lake sockeye salmon ESU was listed as threatened in 1999. Historic run sizes of<br />
3,000-18,000 fish have been reduced to five-year averages of fewer than 1,000 fish in the early<br />
1990s and 2,270 fish most recently, with a substantial portion of these fish of hatchery origin.<br />
Bycatch Rates<br />
While past over-exploitation was a contributor to the decline of the Snake River and Ozette Lake<br />
ESUs, current ocean harvest has not been identified as a current factor in either ESU’s decline.<br />
No more information is available.<br />
Cultus Lake and Sakinaw Lake Sockeye<br />
Population Status: Cultus Lake: In Danger of Extinction<br />
Sakinaw Lake: In Danger of Extinction<br />
In addition to U.S. sockeye, British Columbia has two endangered populations of sockeye that<br />
may occasionally be landed by U.S. fisheries. Both the Cultus Lake and Sakinaw Lake<br />
populations are officially listed as endangered. Both lakes historically supported modest<br />
populations of sockeye salmon; though, today, they are severely depleted. The most recent<br />
estimates indicate that Cultus Lake sockeye populations have been reduced from a historical<br />
abundance of about 20,000 fish to roughly 500 fish in 2004 (CSRT 2004). The declines in<br />
Sakinaw Lake are even more severe. From 1947 to 1987, returns averaged 5,000 fish. In 2002,<br />
only 78 fish were counted entering the Sakinaw Lake. In 2003, only 3 fish entered, just one of<br />
which was observed spawning (SSRT 2004).<br />
Bycatch Rates<br />
Over-exploitation prior to 1995 was the primary cause of the population collapses in Cultus and<br />
Sakinaw lakes. Currently, some fish from the lakes may be incidentally landed. Cultus and<br />
Sakinaw Lake sockeye spend two years offshore in the Gulf of Alaska before returning to British<br />
Columbia (B.C.) to spawn. “Cultus sockeye are part of a convoy of maturing adults from several<br />
Fraser populations, all of which can be intercepted by mixed-stock fisheries along the coast of<br />
B.C. and in the Fraser River” (CSRT 2004). The ocean distribution of Sakinaw Lake sockeye is<br />
largely unknown. The Recovery Team report comments: “Mixed stock fisheries can<br />
unintentionally kill adult Sakinaw sockeye during their return migration. Little information is<br />
available on the migratory route or timing of Sakinaw sockeye so precautionary management of<br />
the mixed-stock remains controversial and challenging” (SSRT 2004). Overall, current<br />
84
<strong>Seafood</strong> <strong>Watch</strong>® Wild Pacific Salmon Report October 8, 2010<br />
exploitation rates of Cultus and Sakinaw Lake sockeye are low, with most exploitation appearing<br />
to come from coastal B.C. and in-river fisheries rather than from U.S. fishermen.<br />
Steelhead<br />
Population Status: 3 ESUs In Danger of Extinction<br />
7 ESUs Likely to Become Endangered<br />
Steelhead is the name commonly given to anadromous rainbow trout (Oncorhynchus mykiss).<br />
The distribution of this species extends from Alaska to Southern California on the eastern side of<br />
the Pacific. As with salmon, the most southerly populations of steelhead have been decimated by<br />
a number of factors over the past two centuries. The most recent BRT assessed ten steelhead<br />
ESUs, of which three were considered in danger of extinction and seven were declared likely to<br />
become endangered. As most of the rivers that support salmon also support steelhead, and there<br />
is also overlap in use of coastal waters, there is the potential for steelhead bycatch from directed<br />
salmon fisheries.<br />
Bycatch Rates<br />
Reportedly, for Northern California steelhead, “ocean harvest is a rare event, so effects on<br />
extinction risk are negligible” (BRT 2003). No numerical data have been provided by NMFS.<br />
However, bycatch rates from in-river harvest are not negligible. For example, the Columbia<br />
River summer Chinook fishery is limited by steelhead bycatch.<br />
Synthesis<br />
Due largely to the selective nature of the gear, discards in commercial salmon trolls and gill-nets,<br />
as well as in recreational salmon fisheries, appear to be at relatively low levels (i.e., < 10% of<br />
landings). The bycatch of sea-birds occurs in the fishery (more common to gill-netters than to<br />
trolls), and incidental takes of groundfish and other non-salmonids also occur, but all appear to<br />
be at relatively low levels (i.e., < 1% of groundfish optimal yields) and are not impacting<br />
populations of non-target species.<br />
Of considerably greater concern is the regular presence of listed salmon in the landings of the<br />
mixed-stock fishery. This includes both fish that are discarded, including coho, and those that are<br />
retained, such as several Chinook stocks. Data on the regularity of these landings and their<br />
implications for the recovery of listed stocks are sparse. The lack of actual data on harvest<br />
impacts and the diversity of other impacts on listed stocks make it difficult to assess the effects<br />
of ocean fishing on these stocks. Certainly fishing effort in the salmon fishery has been<br />
drastically reduced in the past 20 years. In addition, strong management actions have been put in<br />
place to address overfishing and bycatch. Yet many of the listed stocks continued to decline. As<br />
Table 3.3 indicates, where data are available current exploitation rates of listed stocks vary from<br />
a few percent up to forty percent. Almost all of the threatened and endangered fish undergo some<br />
fishing pressure, and in several cases there is strong evidence that this exploitation is<br />
constraining recovery or contributing to continuing declines.<br />
Geographically, the endangered and threatened salmon ESUs are located in California, Oregon,<br />
Washington, and British Columbia. Fisheries throughout the region incidentally catch these<br />
endangered and threatened ESUs, and as such, bycatch is considered a high conservation concern<br />
85
<strong>Seafood</strong> <strong>Watch</strong>® Wild Pacific Salmon Report October 8, 2010<br />
in Washington and Oregon (north of Cape Falcon). In Alaska, the general health of salmon<br />
populations has meant that incidental mortality of non-target salmon is addressed as landings<br />
rather than as bycatch. However, Alaskan fisheries may capture fish from listed stocks in the<br />
Pacific Northwest. It is likely that there are some regular landings of listed fish in the Alaskan<br />
Chinook salmon fishery in Southeast Alaska. For example, Snake River fall-run Chinook<br />
(threatened) are harvested in the Alaskan fishery. Because harvest rates of endangered and<br />
threatened salmon stocks in Alaska are low, and are not believed to constrain recovery or to<br />
contribute to declines in these stocks, bycatch of listed salmon in Alaska’s Chinook salmon<br />
fishery is considered a moderate conservation concern, while bycatch in Alaska’s other salmon<br />
fisheries is a low conservation concern.<br />
Primary Bycatch Factors to Evaluate<br />
Quantity of bycatch, including any species of “special concern” (i.e., those identified as<br />
“endangered,” “threatened,” or “protected” under state, federal or international law):<br />
Alaska<br />
‣ Quantity of bycatch is low (< 10% of targeted landings on a per number basis) AND<br />
does not regularly include species of special concern<br />
‣ Quantity of bycatch is moderate (10–100% of targeted landings, by number) AND<br />
doesn’t regularly include species of special concern OR unknown<br />
Oregon (north of Cape Falcon), Washington<br />
‣ Quantity of bycatch is high (> 100% of targeted landings by number) OR bycatch<br />
regularly include threatened, endangered, or protected species<br />
Population consequences of bycatch:<br />
Alaska (except Chinook)<br />
‣ Low: Evidence indicates quantity of bycatch has little or no impact on population<br />
levels<br />
Alaska (Chinook only)<br />
‣ Moderate: Conflicting evidence of population consequences of bycatch OR<br />
unknown<br />
Oregon (north of Cape Falcon), Washington<br />
‣ Severe: Evidence indicates quantity of bycatch is a contributing factor in driving<br />
one or more bycatch species toward extinction OR is a contributing factor in<br />
limiting the recovery of a species of “special concern”<br />
86
<strong>Seafood</strong> <strong>Watch</strong>® Wild Pacific Salmon Report October 8, 2010<br />
Trend in bycatch interaction rates (adjusting for changes in abundance of bycatch species) as a<br />
result of management measures (including fishing seasons, protected areas, and gear<br />
innovations):<br />
Oregon (north of Cape Falcon), Washington<br />
‣ Trend in bycatch interaction rates is down<br />
Alaska<br />
‣ Trend in bycatch interaction rates is flat OR unknown<br />
‣ Trend in bycatch interaction rates is up<br />
‣ Not applicable because bycatch is low<br />
Secondary Factor to Evaluate<br />
Evidence that the ecosystem has been or likely will be substantially altered (relative to natural<br />
variability) in response to the continued discard of the bycatch species:<br />
‣ Studies show no evidence of ecosystem impacts<br />
‣ Conflicting evidence of ecosystem impacts OR unknown<br />
‣ Studies show evidence of ecosystem impacts<br />
Evaluation Guidelines<br />
Bycatch is “Minimal” if:<br />
1) Quantity of bycatch is 100% of targeted landings OR<br />
2) Bycatch regularly includes species of “special concern” AND evidence indicates bycatch<br />
rate is a contributing factor toward extinction of such species or limiting their recovery<br />
AND trend in bycatch is down.<br />
Bycatch is considered a Critical Conservation Concern and the species is ranked “Avoid,”<br />
regardless of other criteria if:<br />
1) Bycatch regularly includes species of special concern AND evidence indicates bycatch<br />
rate is a factor contributing to extinction of such species or limiting their recovery AND<br />
trend in bycatch interaction rates is not down OR<br />
2) Quantity of bycatch is high AND studies show evidence of ecosystem impacts.<br />
87
<strong>Seafood</strong> <strong>Watch</strong>® Wild Pacific Salmon Report October 8, 2010<br />
Conservation Concern: Nature and Extent of Discarded Bycatch<br />
Pacific Salmon in AK (except Chinook)<br />
‣ Low (Bycatch Minimal)<br />
Chinook Salmon in AK<br />
‣ Moderate (Bycatch Moderate)<br />
Pacific Salmon in OR (north of Cape Falcon) and WA<br />
‣ High (Bycatch Severe)<br />
Criterion 4: Effect of Fishing Practices on Habitats and Ecosystems<br />
Guiding Principle: A sustainable wild-caught species maintains natural functional relationships<br />
among species in the ecosystem, conserves the diversity and productivity of the surrounding<br />
ecosystem, and does not cause irreversible ecosystem state changes.<br />
Direct Habitat Effects from Fishing Gear<br />
In addition to the direct effects of fishing gear on target and non-target animals, large-scale<br />
fishing is capable of generating a broader set of impacts on habitats and associated ecosystems.<br />
Most of the work on the habitat effects of fisheries has examined the physical alterations of<br />
benthic habitats resulting from contact with mobile gear and the removal of various biotic<br />
components of the ecosystem. Auster and Langton (1999) synthesized the results of more than<br />
90 gear impact studies: the vast majority documented some degree of habitat impact from mobile<br />
fishing gear, typically involving a reduction in habitat complexity, an alteration of community<br />
structure, and some change in ecosystem processes.<br />
The salmon fisheries discussed in this report predominantly employ three types of gear: seines,<br />
gillnets, and hook-and-line gear (Figure 4.1). Unlike bottom otter-trawls and dredges, seines,<br />
mid-water gillnets, and hook-and-line gear have minimal contact with the sea floor. 22 According<br />
to several recent reviews of the effects of fishing gear (Gordon et al. 1998, Johnson 2002,<br />
Morgan and Chuenpagdee 2003) hook-and-line gear (i.e., trolling) has little to no physical<br />
impact on the benthic environment. Similarly, seines and mid-water gillnets (which are not<br />
grounded) have little documented effect. According to a recent NMFS technical memorandum,<br />
however, few studies have looked at the direct effects of nets on habitat. In those studies that did<br />
examine the issue, the only identified effects involved the entanglement of nets in hard bottom<br />
areas, particularly in corals. A larger number of studies have examined the role of lost gillnets in<br />
“ghost fishing.” The technical review summarizes:<br />
Lost gillnets, in particular, often get caught on and damage or cover hard bottoms<br />
and reefs. However, these nets are quickly covered by encrusting epifauna, and<br />
22 Set gillnets are also used in some areas (e.g., Bristol Bay). They are also thought to have small to moderate habitat<br />
impacts.<br />
88
<strong>Seafood</strong> <strong>Watch</strong>® Wild Pacific Salmon Report October 8, 2010<br />
eventually blend into the background habitat (Carr et al. 1985, Cooper et al. 1988,<br />
Erzini et al. 1997, ICES 2000). Erzini et al. (1997) observed that lost gillnets<br />
became incorporated into the reef and provided a complex habitat that was<br />
attractive to many organisms. Carr and Milliken (1998) noted that in the Gulf of<br />
Maine, cod reacted to lost gillnets as if they were part of the seafloor. Thus, other<br />
than damage to coral reefs, effects on habitat by gillnets are thought to be minimal<br />
(ICES 1991, 1995, Stephan et al. 2000,(Johnson 2002)<br />
In summary, the evidence indicates that salmon fishing gear has no significant direct physical<br />
effect on marine or freshwater habitats. Mid-water gillnets, seines, and hook-and-line gear were<br />
all ranked among the least damaging gear types by a panel of experts (Chuenpagdee et al. 2003).<br />
Indirectly, however, there is substantial evidence to indicate that the commercial salmon fishery<br />
system does affect aquatic habitats. First, the removal of salmon stocks that have been overfished<br />
or otherwise depleted can affect productivity and disturbance in freshwater habitats. Second, the<br />
supplementation of salmon through hatchery programs significantly alters both the freshwater<br />
and marine habitats of wild salmon. 23<br />
Figure 4.1. Driftnet and troll gear types (www.goldseal.ca/).<br />
Habitat Effects of Salmon Removal<br />
As the Inherent Vulnerability criterion catalogued, salmon populations in numerous watersheds<br />
have undergone severe population declines over the past two centuries. These declines are due in<br />
part to historic, and in some cases present, fisheries exploitation. Studies indicate that the<br />
reduction in spawner populations can alter freshwater habitat in these watersheds through at least<br />
two pathways.<br />
23 The apparent contradiction between claiming that habitat effects emerge from both the addition and subtraction of<br />
salmon is recognized, but is largely superficial. To some extent, conservation-oriented hatcheries may offset the<br />
habitat effects of the removal of wild salmon (e.g., reductions in freshwater productivity and the physical<br />
disturbances associated with digging redds) but these supplementations have neither been universal nor necessarily<br />
balanced. However, the deleterious habitat effects of salmon supplementation involve the degradation of the<br />
ecological habitat of wild salmon (e.g., density-dependent mortality effects, competition for food and space,<br />
alterations to the gene pool). Whereas increases in the populations of wild salmon are positive outcomes for ESUs,<br />
increases in hatchery-origin salmon can be markedly detrimental.<br />
89
<strong>Seafood</strong> <strong>Watch</strong>® Wild Pacific Salmon Report October 8, 2010<br />
First, due to their anadromous and semelparous nature, salmon runs transfer significant quantities<br />
of marine nutrients (via carcasses) to freshwater ecosystems. The fundamental concern is that<br />
declines in spawning salmon stocks may represent an important loss of nutrient and energy<br />
inputs to many freshwater systems. In addition to returning salmon forming an important<br />
component of the seasonal food web, the nutrients in salmon carcasses can increase the<br />
productivity of some freshwater bodies. By reducing the number of returning spawners, fisheries<br />
concomitantly diminish the input of high-quality marine nutrients into lake systems. In<br />
oligotrophic systems, the decrease in nutrient inputs may suppress the overall productivity of the<br />
freshwater body (Finney et al. 2000). Empirical analysis indicates that salmon carcasses can<br />
influence the primary productivity of forested stream ecosystems (Johnston et al. 2004). The<br />
authors found that sockeye spawner abundance raised stream-water nutrient concentrations and<br />
chlorophyll a concentrations in the summer and fall when peak primary production occurred in<br />
the tested oligotrophic streams (Johnston et al. 2004).<br />
Experimentally, the presence of carcasses has been associated with faster growth rates (and<br />
presumably higher survival rates) of coho salmon and related salmonids such as cutthroat trout<br />
and Dolly Varden (Wipfli et al. 2003). Similarly, a second set of authors have speculated that<br />
observed density-dependent mortality suffered by juvenile Chinook in heavily depleted areas<br />
such as the Snake River Basin may be in part due to a shortage of nutrients previously delivered<br />
by salmon carcasses (Achord et al. 2003). The magnitude of these losses is uncertain, and clearly<br />
depends on the size of the run and the freshwater system, among other factors.<br />
Second, spawning salmon physically alter freshwater benthic habitats. Most notably, female<br />
Pacific salmon dig nests (known as redds) to deposit their eggs. Depending on the species, as<br />
well as size and location of the fish, a single redd may range between 1 m 2 and 17 m 2 in size and<br />
be up to 35 cm deep (Moore et al. 2004). Reductions in the size of spawning runs clearly reduces<br />
the density of redds, the significance of which—if any—has not been well documented.<br />
However, it has been noted that redd construction alters the substrate in spawning grounds and<br />
hastens sediment transport, with the added speculation that these actions may reduce the<br />
immediate abundance of benthic algae and invertebrates (Johnston et al. 2004).<br />
As noted in the Inherent Vulnerability criterion, declines in the abundance of West Coast salmon<br />
are not solely attributable to salmon fisheries. To the extent that the declines are attributable to<br />
other factors, fisheries ought not be held culpable for habitat alterations in freshwater systems.<br />
Habitat Effects of Salmon Supplementation<br />
Unlike most marine fisheries, the commercial salmon industry extensively benefits by using<br />
hatcheries to augment landings (see the Stock Status criterion). As these hatcheries represent part<br />
of the salmon system, the habitat effects of artificially propagated fish also need to be analyzed. 24<br />
The following section summarizes the extent of the current hatchery system and the effects of the<br />
hatchery system on habitats.<br />
24 This discussion is primarily concerned with those hatcheries whose primary purpose is fisheries enhancement.<br />
Hatcheries existing purely for conservation-related goals may still affect habitat, but unlikely to have a significant<br />
detrimental effect.<br />
90
<strong>Seafood</strong> <strong>Watch</strong>® Wild Pacific Salmon Report October 8, 2010<br />
Extent and Distribution of Salmon Hatcheries<br />
Since the 1860s, salmon hatcheries have been established in the western United States for fishery<br />
augmentation and later for mitigating habitat loss and degradation. Despite little evidence of their<br />
utility, half a billion artificially propagated salmon were released annually along the Pacific<br />
Coast in 1910 (Lichatowich et al. 1999). 25 In the recent past, the Pacific Rim nations released an<br />
estimated 5-6 billion hatchery-raised salmon (Noakes et al. 2000, Kelly 2001). Summary<br />
estimates compiled by Kelly indicate that:<br />
• Japan has among the most advanced hatchery programs in the world, releasing close to<br />
two billion salmon annually. The Japanese primarily cultivate chum salmon, with some<br />
pink and masu salmon (Oncorhynchus masou) as well.<br />
• The United States releases in the range of one and a half to two billion fish per annum,<br />
which includes mainly pink and chum salmon (in Alaska), with some Chinook, coho, and<br />
sockeye salmon, and steelhead (from California through Alaska).<br />
• As of the mid-1990s, Russia released a half billion salmon annually, roughly half chum<br />
and half pink salmon.<br />
• Canada propagated just over 400 million salmon in 1998; mainly chum and sockeye.<br />
• South Korea has a minor hatchery program for chum salmon, typically releasing fewer<br />
than 15 million fish per year.<br />
With respect to the domestic hatchery industry, around 80% of U.S. salmon hatchery production<br />
occurs in Alaska. The remainder is split between Washington, California, Oregon, and Idaho.<br />
Oregon (north of Cape Falcon) and Washington<br />
In 1995, an estimated 470 million hatchery salmon were produced in the contiguous U.S. Nearly<br />
two-thirds (159 million Chinook, 59 million chum, 57 million coho, 16 million sockeye, and 11<br />
million steelhead) were released in Washington (Kelly 2001). The remainder of salmon hatchery<br />
releases were mostly Chinook in Oregon (80 million fish), California (67 million fish), and Idaho<br />
(17 million fish). The statistics do not differentiate between hatchery propagation for<br />
conservation purposes and for fisheries augmentation.<br />
The predominance of hatchery-fish is most notable in the Columbia River Basin. At present, the<br />
majority of returning spawners in the Columbia are hatchery-raised fish, originating at the ~170<br />
hatcheries active in the basin. It is estimated that these hatcheries release about 200 million<br />
salmon and steelhead into the Columbia and Snake Rivers annually (Levin and Williams 2002).<br />
While only a third of the hatcheries report the number of fish that return, data from the mid-<br />
1990s indicates that hatchery fish accounted for four of every five salmon returning to the<br />
Columbia River (Robinson 2004, Stetkiewicz 2004). As of 1996, hatchery-reared fished in the<br />
Columbia River Basin comprised more than 95% of the coho, 26 80% of summer-run Chinook,<br />
70% of spring-run Chinook and steelhead, and 50% of fall-run Chinook (NRC 1996).<br />
25 Prior to the 1960s, a combination of disease and malnutrition meant that few juvenile salmon actually survived to<br />
recruitment (Lichatowich et al. 1999).<br />
26 With respect to coho salmon, 70 million coho were released from Pacific Northwest hatcheries in 1995 (Kelly<br />
2001). In GLOBEC trawl cruises off of Oregon in the summer of 2000, hatchery coho represented around half of the<br />
juvenile coho taken in the survey trawls (Brodeur et al. 2004).<br />
91
<strong>Seafood</strong> <strong>Watch</strong>® Wild Pacific Salmon Report October 8, 2010<br />
Alaska<br />
Following a period of low salmon harvests in the mid-1970s, Alaska instituted a fisheriesaugmentation<br />
oriented hatchery program that has grown to be among the world’s largest. The<br />
state contains twenty-nine private, two state, and two federal hatcheries, which released nearly<br />
1.5 billion salmon in 2002, resulting in 26 million fish harvested (Farrington 2003). 27 Hatcheries<br />
generated 23% of Alaska’s commercial harvest in 2002. By species, Alaskan hatchery salmon<br />
releases are roughly the inverse of those in the Pacific Northwest, with a large majority of pink<br />
(938 million), chum (451 million), and sockeye salmon (67 million), and only relatively small<br />
releases of coho (20 million) and Chinook salmon (8 million) (Farrington 2003).<br />
Geographically, Prince William Sound and Southeast Alaska are the primary regions in Alaska<br />
affected by hatchery programs (Farrington 2003). In 2002, half of Alaska’s hatchery salmon<br />
releases were in Prince William Sound and nearly 30% were in Southeast Alaska, with the<br />
remainder split between Cook Inlet (9%) and Kodiak Island and the Alaska Peninsula (12%)<br />
(Farrington 2003). Nearly a third of the releases (400 million pink salmon) originated with one<br />
non-profit aquaculture corporation, the Prince William Sound Aquaculture Corporation<br />
(PWSAC) (Kelly 2001).<br />
Effect of Hatcheries on Habitat<br />
A small portion of the existing literature on hatcheries focuses on the impacts of hatchery salmon<br />
on wild salmon populations. Considerable scientific evidence demonstrates that the presence of<br />
hatchery-raised salmon can degrade wild salmon habitat. Cultured fish change the habitat of wild<br />
fish by competing for food resources and space, and by enhancing predator populations (OPR<br />
2004). While the effects of hatcheries can be reduced through proper management, in many<br />
instances these effects are not adequately considered in the design of salmon hatchery programs<br />
(NRC 1996). Robert Lohn, regional administrator of NMFS, recently remarked: “The hatchery<br />
system is just not integrated with wild runs” (Robinson 2004). Lohn noted that on the West<br />
Coast, hatchery fish have an “adverse effect” on 13 or more of the 26 stocks of Pacific salmon<br />
protected under the Endangered Species Act (Robinson 2004). Similarly, a report by the<br />
University of Alaska-Anchorage exploring Alaskan salmon hatchery operations concluded that<br />
industrial-scale hatchery operations may be jeopardizing the long-term viability of Alaska’s wild<br />
salmon (Kelly 2001).<br />
While there are other pathways through which hatchery fish can affect wild fish, with respect to<br />
habitat, the addition of hatchery fish effectively alters the carrying capacity of freshwater and<br />
marine systems. Where they co-occur, cultured fish compete with wild salmon for food and<br />
space, effectively lowering the resources available to wild fish. Additionally, large numbers of<br />
hatchery releases can enhance predator populations, potentially increasing mortality effects on<br />
wild salmon (Kelly 2001, Myers et al. 2004). While it is possible to release hatchery salmon in<br />
tandem with changes in the carrying capacity and the population status of wild fish, Kelly (2001)<br />
observes that “hatchery fish are seldom released in numbers that are related to the carrying<br />
capacity of the receiving stream. The pre-smolt juveniles and any residuals will compete with<br />
their wild counterparts and lower the wild fish success by changing optimum habitat use of the<br />
wild fish.”<br />
27 The two state hatcheries mainly produce salmon targeted in sport fisheries, while the private operations harvest<br />
adult fish to recoup their costs (Kelly 2001).<br />
92
<strong>Seafood</strong> <strong>Watch</strong>® Wild Pacific Salmon Report October 8, 2010<br />
Wild salmon may react to this changing environment in a number of ways, some of which are<br />
detrimental. A recent study on interactions between wild and hatchery Chinook salmon parr<br />
found that the behavior of wild fish (e.g., aggressiveness and habitat preference) changed<br />
markedly when hatchery fish were present, depending on the size of the hatchery salmon. It is<br />
speculated that these behavioral shifts could increase exposure to predators and increase the<br />
energy expenditures of wild salmon (Peery and Bjorn 2004).<br />
More significantly, analysis by Levin, Zabel et al. (2001) statistically documents the detrimental<br />
competitive effects of hatchery salmon in the marine environment. Their work indicated that<br />
large numbers of hatchery-raised Chinook salmon decrease ocean survival rates of threatened<br />
wild Snake River spring Chinook. Marine mortality for salmon ranges 90-99%, with the highest<br />
levels of mortality occurring during the early phases when wild and hatchery-raised juveniles cooccur<br />
in coastal waters. The strong, negative relationship between the wild Chinook survival and<br />
the number of hatchery fish released extends for a quarter of a century, and is particularly<br />
evident during periods of poor ocean conditions. Levin, Zabel et al. (2001) state: “When<br />
hatchery releases are high and poor ocean conditions result in reduced productivity, competition<br />
for limited food resources may occur. The pattern we observed of reduced survival of wild fish<br />
during ENSO events that coincide with large hatchery releases is consistent with this<br />
hypothesis.”<br />
Levin and Williams (2002) have also demonstrated that the survival of Chinook salmon in the<br />
Snake River is negatively affected by hatchery releases of steelhead and salmon regardless of<br />
climatic conditions (Levin and Williams 2002). Again, hatchery releases are believed to generate<br />
density-dependent mortality on wild salmon.<br />
In Alaska, concern over alteration of the ecological landscape by hatcheries centers on Prince<br />
William Sound, where four hatcheries release a half billion pink salmon each spring.<br />
Competition for food in the near shore environments of the Sound is likely to be fierce, as<br />
hatchery pinks outnumber wild pink salmon by a factor of two (Willette 2001, Willette et al.<br />
2001). These competitive interactions may occur over a large geographic scale. For example,<br />
Alaskan sockeye salmon and Asian pink salmon populations interact in the Bering Sea. Sockeye<br />
salmon have lower survival rates during years when Asian pink salmon populations are higher,<br />
highlighting the potential habitat effects of hatchery releases for wild fish (Ruggerone et al.<br />
2003). However, this review found no empirical documentation of negative impacts of hatchery<br />
fish on wild Alaskan stocks, as the apparent health of Alaskan stocks belies such effects. Even<br />
critics of Alaskan hatcheries have noted that “with respect to fish-culture practices, Alaska’s<br />
hatcheries are among the best in North America. The main reasons for this are both fortuitous<br />
and purposeful. By concentrating on pink and chum salmon, Alaska’s ocean-ranching program<br />
has avoided many of the attenuated problems (e.g., domestication and ecological) with long-term<br />
rearing species like steelhead trout and coho salmon. Given the late date at which Alaska’s<br />
ocean-ranching program was established, the state was able to benefit from mistakes made<br />
elsewhere. The program started on better footing by having genetic oversight of operations<br />
through fish transport permits, hatchery siting, egg takes, broodstock development, etc.” (Kelly<br />
2001). Moreover, recent reductions in wild pink salmon runs in Prince William Sound appear to<br />
93
<strong>Seafood</strong> <strong>Watch</strong>® Wild Pacific Salmon Report October 8, 2010<br />
be primarily attributable to environmental factors, with the remaining escapement above<br />
management targets.<br />
Synthesis<br />
The fishing gears used in salmon fisheries have minimal direct effects on physical and biogenic<br />
habitats. As the pelagic environment is highly resilient to the use of hook-and-line gear, seines,<br />
and gillnets, there are no lasting effects to evaluate.<br />
Indirectly, salmon fisheries do alter habitats. First, the depletion of salmon runs appears to affect<br />
freshwater habitats both by reducing the transfer of marine nutrients, and by decreasing the<br />
physical disturbance created by spawning female salmon. The extent and implications of this<br />
phenomenon are neither well documented nor clearly attributable to current salmon fisheries<br />
(relative to habitat loss and other causes of salmon population declines), but represent an<br />
important area for further study. Some analysts have estimated reductions in nutrient inputs from<br />
salmon up to 90% (Gresh et al. 2000); however, the ramifications of this finding in light of other<br />
anthropogenic changes (i.e., eutrophication, increases in biogeochemical cycles, reductions in the<br />
biomass of large predators, etc.) are poorly understood.<br />
More significantly, the addition of artificially propagated salmon from the extensive West Coast<br />
hatchery complex affects the competitive landscape faced by wild salmon and other wildlife. In<br />
some situations, hatchery salmon may reduce the abundance of food available to wild fish, and<br />
may increase populations of predators. While the evidence has been limited to date, initial<br />
statistical work indicates that hatchery fish reduce survival rates of some runs of wild salmon—<br />
including endangered runs—particularly during periods where the ocean conditions are poor.<br />
The wild fisheries criteria as written do not adequately accommodate a review of the effects of<br />
hatcheries. To address this limitation, the indirect effects of both wild stock depletions and<br />
hatchery augmentation have been incorporated into the review under the ecosystem effects<br />
factors. The reduced productivity of oligotrophic freshwater systems where salmon have been<br />
depleted or extirpated in California, Oregon, and Washington indicate that the removal of the<br />
targeted species may have disrupted freshwater ecosystem dynamics. In addition, there is strong<br />
evidence to suggest that the augmentation of hatchery salmon throughout the contiguous West<br />
Coast has affected the habitat of wild salmonids via competitive effects. Therefore, fishery<br />
effects on the habitat and ecosystem are a moderate conservation concern in Oregon (north of<br />
Cape Falcon) and Washington. In Alaska, the effects of the augmentation program are a matter<br />
of important concern, but due to the apparent strength of wild runs, the effects remain unclear,<br />
and habitat and ecosystem impacts are considered a low conservation concern.<br />
Primary Habitat Factors to Evaluate<br />
Known (or inferred from other studies) effect of fishing gear on physical and biogenic habitats<br />
‣ Minimal damage (i.e., pelagic longline, midwater gillnet, midwater trawl, purse<br />
seine, hook and line, or spear/harpoon)<br />
‣ Moderate damage (i.e., bottom gillnet, bottom longline or some pots/traps)<br />
‣ Great damage (i.e., bottom trawl or dredge)<br />
94
<strong>Seafood</strong> <strong>Watch</strong>® Wild Pacific Salmon Report October 8, 2010<br />
For specific fishery being evaluated, resilience of physical and biogenic habitats to disturbance<br />
by fishing method<br />
‣ High (e.g., shallow, sandy habitats) OR benthic habitats not impacted<br />
‣ Moderate (e.g., mud bottoms or deep-water sandy habitats)<br />
‣ Low (e.g., corals, shallow or deep water rocky bottoms<br />
‣ Not applicable because gear damage is minimal<br />
If gear impacts are moderate or great, spatial scale of the impact<br />
‣ Small scale (e.g., small, artisanal fishery or sensitive habitats are strongly protected)<br />
‣ Moderate scale (e.g., modern fishery but of limited geographic scope)<br />
‣ Large scale (e.g., industrialized fishery over large areas)<br />
‣ Not applicable because gear damage is minimal<br />
Primary Ecosystem Factors to Evaluate<br />
Evidence that the fishery system has or will likely substantially disrupt the food web<br />
‣ The fishery and its ecosystem have been thoroughly studied, and studies show no<br />
evidence of substantial ecosystem impacts<br />
Alaska<br />
‣ Conflicting evidence of ecosystem impacts OR unknown<br />
Oregon (north of Cape Falcon) and Washington<br />
‣ Ecosystem impacts of the fishery system demonstrated<br />
Evidence that the fishing method has caused or is likely to cause substantial ecosystem state<br />
changes, including alternate stable states<br />
‣ The fishery and its ecosystem have been thoroughly studied, and studies show no<br />
evidence of substantial ecosystem impacts<br />
‣ Conflicting evidence of ecosystem impacts OR unknown<br />
‣ Ecosystem impacts from fishing method demonstrated<br />
Evaluation Guidelines<br />
The effect of fishing practices is “Benign” if:<br />
1) Damage from gear is minimal AND resilience to disturbance is high AND both<br />
Ecosystem Factors are not red.<br />
The effect of fishing practices is “Moderate” if:<br />
1) Gear effects are moderate AND resilience to disturbance is moderate or high AND both<br />
Ecosystem Factors are not red; OR<br />
2) Gear results in great damage AND resilience to disturbance is high OR impacts are small<br />
scale AND both Ecosystem Factors are not red.<br />
95
<strong>Seafood</strong> <strong>Watch</strong>® Wild Pacific Salmon Report October 8, 2010<br />
The effect of fishing practices is “Severe” if:<br />
1) Gear results in great damage AND the resilience of physical and biogenic habitats to<br />
disturbance is moderate or low; OR<br />
2) One or more Ecosystem Factors are red.<br />
Habitat effects are considered a Critical Conservation Concern and a species receives a<br />
recommendation of “Avoid,” regardless of other criteria if:<br />
1) Four or more of the Habitat and Ecosystem factors rank red.<br />
Conservation Concern: Effect of Fishing Practices on Habitats and Ecosystems<br />
Pacific Salmon in AK<br />
‣ Low (Fishing Effects Benign)<br />
Pacific Salmon in OR (north of Cape Falcon) and WA<br />
‣ Moderate (Fishing Effects Moderate)<br />
Criterion 5: Effectiveness of the Management Regime<br />
Guiding Principle: The management regime for a sustainable wild-caught species implements<br />
and enforces all local, national, and international laws and utilizes a precautionary approach to<br />
ensure the long-term productivity of the resource and integrity of the ecosystem.<br />
Management Structure<br />
The primary management bodies for the U.S. pacific salmon fisheries are the relevant state<br />
fisheries agencies: the Alaska Department of Fish and Game, the Washington Department of<br />
Fish and Wildlife, the Oregon Department of Fish and Wildlife, and the California Department<br />
of Fish and Game. Additionally, several Native American tribes have jurisdiction and fishing<br />
rights over salmon. Each state and tribal agency is responsible for managing salmon fisheries in<br />
their territorial waters, and for establishing fisheries regulations to manage concerns such as<br />
bycatch, habitat conservation, and hatchery supplementation. Additionally, state agencies bear<br />
the primary responsibility for monitoring and enforcement of regulations. State agencies<br />
typically collect a range of data including catch and fishing effort information, escapement,<br />
ocean conditions, and coded wire tag recoveries.<br />
Because salmon frequently move across state and national borders, two coordinating bodies with<br />
regulatory authority also exist. First, the U.S. is required to observe international agreements on<br />
salmon existing between the United States and Canada. In March 1985, the U.S. and Canada<br />
agreed to cooperate in the management of Pacific salmon stocks of mutual concern. The Pacific<br />
Salmon Commission (PSC) was created as a bilateral commission addressing salmon originating<br />
between Cape Suckling, Alaska and the Washington-Canada border. The Pacific Salmon<br />
96
<strong>Seafood</strong> <strong>Watch</strong>® Wild Pacific Salmon Report October 8, 2010<br />
Commission dictates allowable harvest levels and allocation for a number of fisheries such as inriver<br />
Fraser River sockeye and Chinook in Southeast Alaska. 28<br />
Second, the Pacific Fishery Management Council (PFMC) is responsible for managing ocean<br />
salmon fisheries off the coasts of California, Oregon, and Washington. The PFMC is one of eight<br />
regional fishery management councils established by the Magnuson-Stevens Fishery<br />
Conservation and Management Act for the purpose of managing offshore fisheries. The PFMC<br />
releases an annual Salmon Fishery Management Plan (FMP) for Chinook and coho salmon in<br />
California and the Pacific Northwest, which sets goals for spawner escapement in the major<br />
stocks and allocates planned harvests between commercial, recreational, and tribal fisheries. The<br />
FMP establishes conservation objectives to achieve optimum yield, prevent overfishing, and<br />
assure the rebuilding of salmon stocks whose abundance has been depressed to an overfished<br />
level. The stated harvest-related objective of the Pacific Salmon FMP is to “establish ocean<br />
exploitation rates for commercial and recreational salmon fisheries that are consistent with<br />
requirements for stock conservation objectives, specified ESA consultation standards, or Council<br />
adopted rebuilding plans” (Lohn 2004).<br />
In addition to the PSC and PFMC, the U.S. Endangered Species Act (ESA) places any<br />
management actions that affect endangered stocks under federal jurisdiction. Since 1990, West<br />
Coast salmon fisheries have been modified to accommodate requirements of listed salmon<br />
species under the ESA. The ESA requires agencies whose actions may jeopardize listed salmon<br />
to consult with NOAA Fisheries (formerly the National Marine Fisheries Service), which<br />
conducts internal consultations with respect to the effects of ocean harvest on listed salmon. The<br />
consultation standards and recovery plans are put in place to stabilize the listed populations until<br />
freshwater habitats can be restored.<br />
NMFS provides guidance to the PFMC on protective measures for species listed under the ESA.<br />
The ESA is triggered when a species’ survival is in doubt and a “status review” is done by<br />
NMFS to determine if the species is threatened or endangered. If the status review indicates that<br />
the species’ survival is imperiled, NMFS must publish a proposal to protect the species. Under<br />
section 7 of the ESA, federal agencies must consult with NMFS on any action that is likely to<br />
adversely affect a threatened or endangered species. In doing this, NMFS must issue a<br />
“biological opinion” that explains how the federal action affects the species and lays out what<br />
actions should be taken to protect the species. Section 4(d) of the ESA applies to state, tribal, and<br />
local jurisdiction or individuals and prohibits the “take” of an endangered species without ESA<br />
authorization. This section requires NMFS to issue regulation to provide for protection of the<br />
species. If the action that is being reviewed does not interfere with the long-term survival and<br />
recovery of the species, the action can be authorized under section 4(d) of the ESA.<br />
Oregon (north of Cape Falcon) and Washington<br />
Since 1977, the Pacific Fisheries Management Council (PFMC) has managed salmon fisheries<br />
off the coast of California, Oregon, and Washington. The ocean salmon fisheries in the U.S.<br />
Exclusive Economic Zone (EEZ), 3-200 miles offshore, are managed under a fishery<br />
28 At present, the U.S. is allocated 16.5% of the total allowable catch of Frasier River sockeye, and Canada the<br />
remaining 83.5%, which in turn is split between recreational, aboriginal, and various commercial sectors ((McRae<br />
and Pearse 2004)).<br />
97
<strong>Seafood</strong> <strong>Watch</strong>® Wild Pacific Salmon Report October 8, 2010<br />
management plan entitled the Pacific Coast Salmon Plan (Salmon FMP). This plan was<br />
developed in accordance with the Magnuson-Stevens Fishery Conservation and Management<br />
Act, which authorized the creation of the PFMC and the subsequent development and<br />
implementation of these plans.<br />
The PFMC consists of representatives from the states of California, Oregon, Washington, and<br />
Idaho, and is organizationally structured with Council members that include a Chairman, a Vice<br />
Chairman, a Council staff, and various committees and advisory bodies. There are a total of<br />
nineteen Council members in the PFMC, fourteen of whom are eligible to vote on matters<br />
brought before the Council. The Council staff is responsible for the administration and execution<br />
of Council operations. Advisory bodies are composed of individuals knowledgeable about West<br />
Coast fisheries matters and serve the purpose of providing expert advice to the Council on<br />
matters related to the Council purpose.<br />
With respect to salmon, the PFMC essentially controls the process for Chinook and coho salmon<br />
fisheries in California and the Pacific Northwest. To inform Council decisions, the Salmon<br />
Technical Team exists to analyze fisheries and abundance data and make recommendations<br />
about the impacts of proposed regulations. Additionally, the Salmon Advisory Subpanel is<br />
comprised of seventeen individuals representing commercial and recreational fisheries as well as<br />
a single public representative and a single conservation representative.<br />
Abundance<br />
Every year, the Council with the help of the Salmon Technical Team, Salmon Advisory Panel,<br />
NMFS, and the stage agencies develops a stock abundance analysis for ocean salmon fisheries.<br />
This includes an analysis of fishery-dependent and independent data.<br />
According to the PMFC, most target salmon stocks are managed such that escapement generally<br />
exceeds the Maximum Sustainable Yield (MSY) level or conservation objective. Because of the<br />
mixed-harvest nature of the fishery, “the Salmon FMP is structured such that in setting annual<br />
management measures, most stocks exceed their conservation objectives, while one or a few<br />
stocks constrain harvest because they approach their conservation objectives, without exceeding<br />
them. In theory then, most stocks experience escapement above the average MSY level (or other<br />
criteria) set as their conservation objective, while only the constraining stocks experience<br />
optimal escapement levels. ” (PFMC 2004a).<br />
However, according to <strong>Seafood</strong> <strong>Watch</strong>®, management has not maintained stock productivity<br />
over time in Washington and Oregon (north of Cape Falcon). Four stocks on the U.S. west coast<br />
have failed to meet the Salmon FMP escapement goals for three or more consecutive years and<br />
are subject to a conservation concern, including three in Washington – Grays Harbor coho,<br />
Queets coho, and Western Strait of Juan de Fuca (SJF) coho. The Council reviewed new<br />
information for Grays Harbor coho, which shows that the stock fell below the conservation goal<br />
from 2006‐2008, but exceeded the goal in 2009. As such, the Council considered the stock<br />
rebuilt to the conservation goal in 2009 and has taken no further action (PFMC 2010a). From<br />
2006-2008, the Queets River coho stock failed to meet its spawning escapement objective of<br />
5,800-14,500 fish; however, new information suggests that Queets coho achieved their<br />
conservation objective in 2009. The Salmon Technical Team (STT) concluded that from 2006-<br />
98
<strong>Seafood</strong> <strong>Watch</strong>® Wild Pacific Salmon Report October 8, 2010<br />
2008, overfishing of Queets coho occurred and that Queets coho were overfished, but did not<br />
believe that the stock abundance levels in those three years was significantly depressed and<br />
would represent a concern for producing maximum sustainable yield on a continuing basis.<br />
Pending a review of the preseason and terminal abundance methodologies, the STT believes the<br />
rebuilding feature of the FMP is sufficient, and development of a separate rebuilding plan is not<br />
necessary at this time (PFMC 2010d). The Western SJF coho stock failed to meet its<br />
conservation objective from 2005-2008. The cause of this failure is depressed adult ocean<br />
abundance due to poor marine survival, which may have been intensified by the limited capacity<br />
of the habitat to produce smolts. Even if exploitation rates had been reduced to zero, the Western<br />
SJF stock would still have failed to meet its conservation objective from 2005-2008. Therefore,<br />
the STT concluded that overfishing on the Western SJF coho stock did not occur, and that the<br />
stock is depressed, but not overfished (PFMC 2010e).<br />
Apart from the PFMC and NMFS, the Washington Department of Fish and Wildlife (WDFW)<br />
plays a significant role in salmon fishery management in the Pacific Northwest. The WDFW<br />
remains the primary body managing chum, sockeye, and pink salmon, which are generally not<br />
landed outside of Washington State waters. According to state managers:<br />
The annual process of setting scientifically sound fishing seasons begins each year with a<br />
pre-season forecast of the abundance of various individual fish stocks. These forecasts<br />
are based on estimates of the number of juvenile wild salmon produced in a river system,<br />
surveys of adult fish spawning in the wild, counts of fish returning to hatcheries, and<br />
samples from fisheries in ‘terminal’ areas…. The forecast is added to a base of<br />
information on the historic run-size strength and fishery impacts for the various fish<br />
populations…. After the biological information and data gleaned from coded wire tags is<br />
agreed to by the co-managers, they are assembled into a computer model that offers a<br />
snapshot of an upcoming season's fishery under various regulation options. The results<br />
from these computer simulations are then compared to conservation goals, obligations<br />
under U.S-Canada treaties, allocations for tribes and protection requirements for some<br />
wild fish population under the Endangered Species Act. (WDFW 2002b)<br />
In general, abundance of salmon in Oregon (north of Cape Falcon) and Washington has declined<br />
for a number of reasons typically outside of management’s direct control, such as habitat<br />
degradation, poor ocean conditions, and climate variability (Lindley et al. 2009).<br />
Bycatch<br />
In 1997, due to the ESA status of many salmon runs in California, Oregon and Washington,<br />
Amendment 12 of the Pacific Salmon FMP implemented procedures for governing retention of<br />
salmon bycatch in trawl nets and management objectives for ESA listed salmon species (PFMC<br />
2003). The primary constraints under the Salmon FMP at present vary by region. South of Point<br />
Arena, California, exploitation of endangered Sacramento River winter Chinook is the limiting<br />
factor. Targeted Klamath River fall Chinook salmon are limiting south of Cape Falcon, Oregon.<br />
North of Cape Falcon, incidental landings of threatened Snake River fall Chinook are the<br />
constraining factor. Additionally, management goals for wild coho salmon limit fisheries across<br />
the entire West Coast (Lohn 2004). The effectiveness of the non-retention restrictions is unclear.<br />
In some cases, bycatch has been reduced and in other cases, bycatch rates are still high. None of<br />
99
<strong>Seafood</strong> <strong>Watch</strong>® Wild Pacific Salmon Report October 8, 2010<br />
the salmonid species that were listed under the ESA in 2004 have been delisted. “Criterion 3:<br />
Nature and Extent of Discarded Bycatch” outlines several ESUs that are harvested at levels that<br />
may be retarding their recovery.<br />
Habitat<br />
There are no significant physical effects of salmon fishing gear on aquatic habitat. As discussed<br />
in the Habitat Effects criterion, the main indirect effect of the salmon fishery system is that<br />
hatchery fish can degrade habitat for wild fish. Management’s treatment of hatchery-origin<br />
salmon has been a major point of debate recently; specifically, NMFS’ new hatchery policy<br />
requires wild and hatchery salmon to both be included in ESU listings despite the<br />
recommendations of a scientific advisory panel (Myers et al. 2004). The opinion of Myers, Levin<br />
et al. (2004), authors of a recent article in Science, was unequivocal about the harms of this<br />
policy: “To avoid the dysgenic effects of domestication, even conservation hatcheries should be<br />
strictly temporary and should not prevent protection of wild populations under the Endangered<br />
Species Act…. The danger of including hatchery fish as part of any ESU is that it opens the legal<br />
door to the possibility of maintaining a stock solely through hatcheries. However, hatcheries<br />
generally reduce current fitness and inhibit future adaptation of natural populations” (Myers et al.<br />
2004).<br />
This perspective is countered in part by a recent article in Fisheries, which contends that in many<br />
cases artificially propagated fish ought to be allowed to reproduce in the wild (Brannon et al.<br />
2004). However, even the defense of hatcheries concludes that substantial reforms in the current<br />
system are warranted. Brannon, Amend et al. (2004) note that Pacific salmon hatcheries “have<br />
had negative impacts on wild conspecifics because management decisions and hatchery<br />
operations were unrelated to the biological needs of either the introduced or the recipient<br />
populations. Reforms, therefore, are necessary in the management of fisheries that will address<br />
the biological needs of anadromous salmonid populations, and reforms are necessary in hatchery<br />
programs that will assure hatchery fish are compatible genetically and behaviorally with the<br />
recipient population.”<br />
Enforcement<br />
The fishery is enforced through the local management authorities (states, tribes) and the use of<br />
fish tickets, logbooks, catch cards, and similar management measures (PFMC 2003).<br />
Alaska<br />
Alaskan salmon fisheries are overseen by the Alaska Department of Fish and Game (ADFG),<br />
which regulates harvest and all salmon rehabilitation and enhancement projects. Unlike the<br />
PFMC to the south, the North Pacific Fishery Management Council (NPFMC) does not play an<br />
active role in salmon fisheries. Similarly, Alaskan salmon fisheries are not regulated by PFMC<br />
decisions, nor has NMFS played a large role in Alaskan salmon management to date. However,<br />
the Pacific Salmon Commission (PSC) affects Alaskan salmon in Southeast Alaska, where it sets<br />
exploitation rates for Chinook salmon (Delaney 1994). Currently, the Southeast Alaska Chinook<br />
fishery is managed to achieve the annual harvest quota set by the PSC through a plan established<br />
by the Alaska Board of Fisheries.<br />
100
<strong>Seafood</strong> <strong>Watch</strong>® Wild Pacific Salmon Report October 8, 2010<br />
Overall, the task of salmon management in Alaska is enormous. The state estimates that there are<br />
over 15,000 streams and rivers throughout the state that support anadromous salmon. In<br />
Southeast Alaska alone there are over 5,000 streams with anadromous fish runs, roughly 60% of<br />
which are principal salmon streams. Moreover, coho, pink, and chum salmon co-exist in almost<br />
all of the streams (Kelly 2001). While the state monitors the most productive and important<br />
areas, it is clearly difficult to have complete coverage. For example, in Prince William Sound<br />
alone, the Department of Fish and Game currently monitors 150-200 out of the 800 streams for<br />
salmon escapement (Kelly 2001). According to ADFG: “State of Alaska management has been<br />
intensive, conducted on a real-time basis with regulations imposed inseason by local biologists<br />
who have a clear conservation mandate and authority to open or close fisheries as needed.<br />
Delegated emergency authority provides for immediate management decisions by area<br />
biologists. When runs are strong, managers liberalize harvest regulations to utilize surpluses.<br />
When runs are poor, managers close fisheries to provide for predetermined escapement needs<br />
which ensure long-term sustainable yields” (ADFG 2003).<br />
An obvious difficulty with salmon management is that the sizes of salmon runs naturally<br />
fluctuate, a factor that makes it difficult to accurately forecast the size of salmon returns. Salmon<br />
models are typically based on an empirical stock-recruitment relationship, modified by other<br />
factors such as environmental conditions. Assessments of previous models have shown that even<br />
the best examples have an average error of approximately 35%, and are likely to be off by a<br />
factor of two (Adkinson and Finney 2003). As a consequence, Alaskan salmon management<br />
currently relies on conservative preseason estimates and inseason management to adjust for these<br />
effects. Adkinson and Finney (2003) comment: “The health of Alaska’s salmon runs depends on<br />
maintaining its conservation oriented management goals. A widely-accepted goal of meeting<br />
escapement objectives coupled with intensive inseason management has helped to maintain the<br />
health of salmon stocks for decades, even through dramatic declines in abundance such as<br />
occurred in the early 1970s.”<br />
With respect to salmon management in Alaska, the state management body has an excellent track<br />
record. Alaskan salmon stocks have not always been healthy as they appear to be today. Prior to<br />
Alaska statehood in 1959, overfishing under federal management may have contributed to<br />
declines in salmon stocks. Since 1959 the state management agencies have pursued a path of<br />
conservation and careful planning that has largely protected the productivity of salmon<br />
populations, such that recent harvests were roughly five times the size of those in 1959 (ADFG<br />
2003). The current health of Alaskan salmon runs and habitat attests to the relative success of the<br />
state’s management regime. However, the state has also been aided by favorable environmental<br />
conditions. If conditions were to decline, the state may have to revisit its hatchery policies.<br />
Bycatch<br />
Little information is available about management of bycatch in Alaskan salmon fisheries. ADFG<br />
officers insist that if bycatch were a problem area, the management body would collect more<br />
detailed information (Plotnick 2004).<br />
Habitat<br />
Alaska currently has a number of protections regulating development of freshwater habitat.<br />
According to the Alaska Department of Fish and Game (ADFG 2003), the “Anadromous Fish<br />
101
<strong>Seafood</strong> <strong>Watch</strong>® Wild Pacific Salmon Report October 8, 2010<br />
Act (AS 16.05.870) requires approval for any in-stream construction activities in salmon<br />
streams.” Similarly, Alaska’s “Forest Practices Act” (41.17.010) requires the presence of buffer<br />
zones between actively logged areas and salmon streams. Additionally, the “Water Use<br />
Protection Act” (AS 46.15) protects stream flows needed for salmon and allows the ADFG<br />
Commissioner to purchase water rights for the purpose of protecting salmon runs (ADFG 2003).<br />
While over 100 dams exist in Alaska, the number remains small relative to the state’s size.<br />
As with salmon in the Pacific Northwest, the main concern with respect to habitat in Alaska is<br />
the presence of the extensive hatchery system—most notably the pink salmon hatchery complex<br />
in Prince William Sound. As noted in the Habitat Effects criterion, significant unknowns exist<br />
with respect to Alaskan salmon. While even critics of the Alaskan hatcheries have noted that<br />
they are better-managed and regulated than most hatchery systems, the sheer scale of the system<br />
may be causing detrimental effects on wild salmon habitat, particularly in Prince William Sound<br />
and Southeast Alaska (Kelly 2001). There is a lack of information and data necessary to evaluate<br />
the effects of the hatcheries on wild salmon.<br />
There have also been some recent changes in management in Alaska. The ADFG’s Habitat<br />
Division and all of its functions have been transferred to Alaska’s Department of Natural<br />
Resources (ADNR), the state’s resource development agency. The Habitat Division had primary<br />
responsibility for permit issuance and other measures to protect anadromous fish streams.<br />
Additionally, Bristol Bay has been opened to oil and gas exploration (a move which will not<br />
necessarily harm salmon runs). These changes may or may not signal a broader political<br />
willingness to put salmon habitats at risk in Alaska.<br />
Synthesis<br />
Managers of U.S. West Coast salmon fisheries assess stocks on a timely basis, typically issuing<br />
preseason abundance forecasts and updating regulations as the season progresses. Managers<br />
regularly assess fisheries-dependent data, such as landings, and fisheries-independent data, such<br />
as run size, ocean conditions, and fish age, to determine stock status and fishing levels.<br />
Management does not have a track record of setting catch quotas over what its scientific advisors<br />
have recommended. Managers require specific gear types and employ closed areas to reduce<br />
wasteful discards, and actively craft fishing seasons and regulations to reduce harmful impacts<br />
on endangered or struggling stocks. However, the effectiveness of the bycatch reduction<br />
measures is not clear, as bycatch of some species has decreased, while bycatch of other species<br />
remains high, including bycatch of some ESA-listed salmonids. Alaska salmon regulations also<br />
limit gear sizes (including mesh size as well as boat and gear length) and limit the time during<br />
which gear can be in the water. Management has not prevented the long-term declines of many<br />
salmonids in Washington and Oregon (north of Cape Falcon).<br />
102
<strong>Seafood</strong> <strong>Watch</strong>® Wild Pacific Salmon Report October 8, 2010<br />
Primary Management Factors to Evaluate<br />
Stock Status: Management process utilizes an independent scientific stock assessment that seeks<br />
knowledge related to the status of the stock<br />
‣ Stock assessment complete and robust<br />
‣ Stock assessment is planned or underway but is incomplete OR stock assessment<br />
is complete but out-of-date or otherwise uncertain<br />
‣ No stock assessment available now and none is planned in the near future<br />
Scientific Monitoring: Management process regularly involves the collection and analysis of data<br />
with respect to the short and long-term abundance of the stock<br />
‣ Regular assessment of fishery-dependent AND independent data<br />
‣ Regular collection of fishery-dependent data only<br />
‣ No regular collection or analysis of data<br />
Scientific Advice: Management has a well-known track record of consistently setting catch<br />
quotas beyond those recommended by its scientific advisors and other external scientists<br />
‣ No<br />
‣ Yes<br />
‣ Not enough information available to evaluate OR not applicable because little or<br />
no scientific information is collected<br />
Bycatch: Management implements an effective bycatch reduction plan<br />
‣ Bycatch plan in place and reaching conservation goals (deemed effective)<br />
Oregon (north of Cape Falcon) and Washington<br />
‣ Bycatch plan in place but effectiveness is not yet demonstrated or under debate<br />
‣ No bycatch plan implemented or bycatch plan implemented but not meeting its<br />
conservation goals (deemed ineffective)<br />
Alaska<br />
‣ Not applicable because bycatch is “low”<br />
Fishing practices: Management addresses the effect of the fishery system on<br />
habitats and ecosystems<br />
‣ Mitigative measures in place and deemed effective<br />
‣ Mitigative measures in place but effectiveness not yet demonstrated or<br />
under debate<br />
‣ No mitigative measures in place or measures in place but ineffective<br />
‣ Not applicable because fishing method is moderate or benign<br />
Enforcement: Management and appropriate government bodies enforce fishery regulations<br />
103
<strong>Seafood</strong> <strong>Watch</strong>® Wild Pacific Salmon Report October 8, 2010<br />
‣ Regulations regularly enforced by independent bodies, including logbook reports,<br />
observer coverage, dockside monitoring, and similar measures<br />
‣ Regulations enforced by fishing industry or by voluntary/honor system<br />
‣ Regulations not regularly and consistently enforced<br />
Management Track Record: Conservation measures enacted by management have resulted in the<br />
long-term maintenance of stock abundance and ecosystem integrity<br />
Alaska<br />
‣ Management has maintained stock productivity and limited ecosystem change<br />
OR has fully recovered the stock from an overfished condition<br />
‣ Stock productivity has varied but management has responded quickly OR stock has not<br />
varied but management has not been in place long enough to evaluate its effectiveness<br />
Oregon (north of Cape Falcon) and Washington<br />
‣ Measures have not maintained stock productivity OR were implemented only after<br />
significant declines and stock has not yet fully recovered<br />
Evaluation Guidelines<br />
Management is deemed to be “Highly Effective” if four or more management factors are green<br />
AND the remaining factors are not red.<br />
Management is deemed to be “Moderately Effective” if:<br />
1) Management factors “average” to yellow OR<br />
2) Management factors include one or two red factors<br />
Management is deemed to be “Ineffective” if three individual management factors are red,<br />
especially those for Stock Status and Bycatch.<br />
Management is considered a Critical Conservation Concern and a species given a<br />
recommendation of “Avoid,” regardless of other criteria if:<br />
1) There is no management in place OR<br />
2) The majority of the management factors rank red.<br />
Conservation Concern: Effectiveness of Management<br />
Pacific Salmon in AK<br />
‣ Low (Management Highly Effective)<br />
Pacific Salmon in OR (north of Cape Falcon) and CA<br />
‣ Moderate (Management Moderately Effective)<br />
104
<strong>Seafood</strong> <strong>Watch</strong>® Wild Pacific Salmon Report October 8, 2010<br />
IV. Overall Evaluation and <strong>Seafood</strong> Recommendation<br />
In Alaska, the salmon stocks are inherently resilient to fishing pressure and have healthy<br />
abundance levels, and the salmon fisheries have a low to moderate bycatch concerns, low habitat<br />
impacts, and highly effective management. Therefore, Alaskan salmon receives an overall<br />
<strong>Seafood</strong> <strong>Watch</strong>® ranking of Best Choice. In Washington and Oregon (north of Cape Falcon),<br />
the salmon stocks are moderately vulnerable to fishing pressure and have moderate abundance<br />
levels, and the fishery has high bycatch concerns, moderate habitat effects, and moderately<br />
effective management. This results in Washington and Oregon (north of Cape Falcon) salmon<br />
receiving an overall <strong>Seafood</strong> <strong>Watch</strong>® ranking of Good Alternative.<br />
Table of Sustainability Ranks<br />
Conservation Concern<br />
Sustainability Criteria Low Moderate High Critical<br />
Inherently Vulnerability √ (AK)<br />
√ (WA, OR –<br />
north of Cape<br />
Falcon)<br />
Status of Wild Stocks √ (AK)<br />
√ (WA, OR –<br />
north of Cape<br />
Falcon)<br />
Nature of Bycatch<br />
Habitat Effects<br />
Management Effectiveness<br />
√ (AK<br />
except<br />
Chinook)<br />
√ (AK)<br />
√ (AK)<br />
√ (AK Chinook)<br />
√ (WA, OR --<br />
north of Cape<br />
Falcon)<br />
√ (WA, OR --<br />
north of Cape<br />
Falcon)<br />
Evaluation Guidelines<br />
√ (WA, OR –<br />
north of Cape<br />
Falcon)<br />
A species is given the overall recommendation of “Best Choice” if it has a total of three or more<br />
green criteria AND the remaining criteria are not red.<br />
A species is given the overall recommendation of “Good Alternative” if:<br />
1) Criteria “average” to yellow OR<br />
2) There are four green criteria and one red criteria OR<br />
3) Stock Status and Management criteria are both ranked yellow and remaining criteria are<br />
not ranked red.<br />
A species is given the overall recommendation of “Avoid” if:<br />
1) It has a total of two or more red criteria OR<br />
2) It has one or more criteria of Critical Conservation Concern.<br />
105
<strong>Seafood</strong> <strong>Watch</strong>® Wild Pacific Salmon Report October 8, 2010<br />
Overall <strong>Seafood</strong> Recommendation:<br />
Alaska:<br />
Best Choice Good Alternative Avoid<br />
Washington and Oregon (north of Cape Falcon):<br />
Best Choice Good Alternative Avoid<br />
Acknowledgements<br />
Scientific review does not constitute an endorsement of <strong>Seafood</strong> <strong>Watch</strong>® on the part of the<br />
reviewing scientists. The <strong>Seafood</strong> <strong>Watch</strong>® staff is solely responsible for the conclusions reached<br />
in this report.<br />
The <strong>Seafood</strong> <strong>Watch</strong>® Program would like to specially thank Dr. Edward Backus of Ecotrust, Dr.<br />
Dennis Kelso of the University of California at Santa Cruz, and Dr. Mary McClure of the<br />
National Marine Fisheries Service for each providing extremely thorough and diligent reviews of<br />
this document.<br />
<strong>Seafood</strong> <strong>Watch</strong>® would also like to thank the several individuals contacted during the course of<br />
the review including Jim Ames (WDFW), Doug Milward (WDFW), Mike Plotnick (ADFW),<br />
and Bruce Sanford (WDFW). Acknowledgements are also due to Rob Mazurek and Natasha<br />
Benjamin who wrote language for earlier drafts incorporated into this document.<br />
Supplemental Information<br />
Consumption advice on the <strong>Seafood</strong> <strong>Watch</strong>© pocket guides is provided by Environmental<br />
Defense Fund. Environmental Defense Fund applies the same risk-based methodology as the<br />
U.S. Environmental Protection Agency (EPA) to data from government studies and papers<br />
published in scientific journals. The Environmental Defense Fund has a consumption advisory<br />
for Washington salmon for PCBs contamination. Consumption of salmon from Washington<br />
should be limited to one meal per month for men and women of childbearing age, 1/2 meal per<br />
month for children between the ages of 0-12. More detailed information about the Environmental<br />
Defense advisory can be found at http://www.edf.org/seafoodhealth.<br />
106
<strong>Seafood</strong> <strong>Watch</strong>® Wild Pacific Salmon Report October 8, 2010<br />
V. References<br />
References<br />
Achord, S., P. Levin, and R. Zabel. 2003. Density-dependent mortality in Pacific salmon: the<br />
ghost of impacts past? Ecology Letters 6:335–342.<br />
ADFG. 1994. Sockeye salmon. Alaska Department of Fish and Game. Accessed 2004.<br />
http://www.adfg.state.ak.us/pubs/notebook/fish/sockeye.php.<br />
ADFG. 2003. Alaska’s Salmon Management: Story of Success.<br />
http://www.adfg.state.ak.us/special/salmonmngmnt.pdf.<br />
Adkinson, M. D., and B. P. Finney. 2003. The long-term outlook for salmon returns to Alaska.<br />
Alaska Fishery Research Bulletin 10:83-94.<br />
Alaska. 2000. Press Release: Alaska Honors National Dam Safety Day, May 31. in. State of<br />
Alaska, Department of Military and Veterans Affairs, Division of Emergency Services<br />
http://www.ak-prepared.com/pr24.htm.<br />
Alverson, D. L., M. H. Freeberg, S. A. Murawski, and J. G. Pope. 1994. A global assessment of<br />
fisheries bycatch and discards. Fishery Technical Paper No. 339.(FAO) United Nations<br />
Food and Agriculture Organization<br />
Ames, J. 2004. Washington Department of Fish and Wildlife; pink, sockeye, and chum manager.<br />
August 19<br />
Anderson, M. 1993. The living landscape. Volume 2; Pacific salmon and federal lands. The<br />
Wilderness Society, Bolle Center for Forest Ecosystem Management, Washington, D.C.<br />
Boesch, D. F., R. H. Burroughs, J. E. Baker, R. P. Mason, C. L. Rowe, and R. L. Siefert. 2001.<br />
Marine Pollution in the United States. Pew Oceans Commission, Arlington, VA.<br />
Boltwood, M. 2002. Old and in the Way: An Evaluation of Alaska’s Dams and Anadromous<br />
Fish. Masters Thesis. University of Montana in Missoula, Missoula, MT.<br />
Brannon, E. L., D. F. Amend, M. A. Cronin, J. E. Lannan, S. LaPatra, W. J. McNeil, R. E.<br />
Noble, C. E. Smith, A. J. Talbot, G. A. Wedemeyer, and H. Westers. 2004. The<br />
controversy about salmon hatcheries. Fisheries 29:12-31.<br />
Brownell, D. 1999. The Six Species of Salmon Nation: A Portfolio of Maps. Pages 92 in E. Wolf<br />
and S. Zuckerman, editors. Salmon Nation: Fish, People, and Our Common Home.<br />
Ecotrust, Portland, Oregon.<br />
BRT. 2003. Updated Status of Federally Listed ESUs of West Coast Salmon and Steelhead.<br />
West Coast Salmon Biological Review Team; Northwest Fisheries Science Center and<br />
Southwest Fisheries Science Center, NMFS, Seattle, WA and Santa Cruz, CA.<br />
Buchanan, S., A. P. Farrell, J. Fraser, P. Gallaugher, R. Joy, and R. Routledge. 2002. Reducing<br />
gill-net mortality of incidentally caught coho salmon. North American Journal of<br />
Fisheries Management 22:1270-1275.<br />
Buklis, L. 1994. Chum salmon. Alaska Department of Fish and Game. Accessed 2004.<br />
http://www.adfg.state.ak.us/pubs/notebook/fish/chum.php.<br />
Carls, M. G., S. D. Rice, G. D. Marty, and D. K. Naydan. 2004. Pink Salmon Spawning Habitat<br />
Is Recovering a Decade after the Exxon Valdez Oil Spill. Transactions of the American<br />
Fisheries Society 133:834-844.<br />
CDFG. 2003. Trout descriptions: Brook Trout.<br />
http://www.dfg.ca.gov/fishing/html/WildAndHeritageTrout/trout/BrookTrout.htm.<br />
Chaffee, C., G. Ruggerone, R. Beamesderfer, and L. Botsford. 2007. The Commercial Alaska<br />
Salmon Fisheries Managed by the Alaska Department of Fish and Game: A 5-Year Re-<br />
107
<strong>Seafood</strong> <strong>Watch</strong>® Wild Pacific Salmon Report October 8, 2010<br />
Assessment Based on the Marine Stewardship Council Program. Marine Stewardship<br />
Council. http://www.msc.org/track-a-fishery/certified/pacific/alaska-salmon/assessmentdownloads-2/Final_Cert_Report_Oct07.pdf.<br />
Chuenpagdee, R., L. E. Morgan, S. M. Maxwell, E. A. Norse, and D. Pauly. 2003. Shifting<br />
gears: assessing collateral impacts of fishing methods in US waters. Frontiers in Ecology<br />
1:517-524.<br />
CSRT. 2004. National recovery strategy for sockeye salmon (Oncorhynchus nerka), Cultus Lake<br />
population, in British Columbia. Cultus Sockeye Recovery Team, Ottawa, Ontario.<br />
Dauble, D. D., T. P. Hanrahan, D. R. Geist, and M. J. Parsley. 2003. Impacts of the Columbia<br />
River hydroelectric system on main-stem habitats of fall chinook salmon. North<br />
American Journal of Fisheries Management 23:641-659.<br />
Davis, M. W. 2002. Key principles for understanding fish bycatch discard mortality. Canadian<br />
Journal of Fisheries and Aquatic Sciences 59:1834-1843.<br />
Delaney, K. 1994. Chinook salmon. Alaska Department of Fish and Game. Accessed 2004.<br />
http://www.adfg.state.ak.us/pubs/notebook/fish/chinook.php.<br />
DFO. 2001. Salmon – Pacific Region: Biology and Environment. Canada, Department of<br />
Fisheries and Oceans. http://www-ops2.pac.dfompo.gc.ca/xnet/content/salmon/biology/biology.htm.<br />
DFO. 2003. National factsheet – Coho salmon. Canada, Department of Fisheries and Oceans.<br />
Accessed 2003. http://www.dfo-mpo.gc.ca/canwaters-eauxcan/infocentre/guidelinesconseils/factsheets-feuillets/national/cohosalmon_e.asp.<br />
EIA. 2002. State Electricity Generation Statistics.<br />
http://www.eia.doe.gov/cneaf/electricity/epa/generation_state.xls.<br />
Einum, S., I. Fleming, I. Cote, and J. D. Reynolds. 2003. Population stability in salmon species:<br />
effects of population size and female reproductive allocation. Journal of Animal Ecology<br />
72:811-821.<br />
Elliott, S. 1994. Coho salmon. Alaska Department of Fish and Game. Accessed 2004.<br />
http://www.adfg.state.ak.us/pubs/notebook/fish/coho.php.<br />
Farrell, A., P. Gallaugher, C. Clarke, N. DeLury, H. Kreiberg, W. Parkhouse, and R. Routledge.<br />
2000. Physiological status of coho salmon (Oncorhynchus kisutch) captured in<br />
commercial nonretention fisheries. Canadian Journal of Fisheries and Aquatic Sciences<br />
57:1668-1678.<br />
Farrell, A., P. Gallaugher, J. Fraser, D. Pike, P. Bowering, A. K. M. Hadwin, W. Parkhouse, and<br />
R. Routledge. 2001a. Successful recovery of the physiological status of coho salmon on<br />
board a commercial gillnet vessel by means of a newly designed revival box. Canadian<br />
Journal of Fisheries and Aquatic Sciences 58:1932-1946.<br />
Farrell, A., P. Gallaugher, and R. Routledge. 2001b. Rapid recovery of exhausted adult coho<br />
salmon after commercial capture by troll fishing. Canadian Journal of Fisheries and<br />
Aquatic Sciences 58:2319-2324.<br />
Farrington, C. 2003. Alaska Salmon Enhancement Program 2002 Annual Report. Regional<br />
Information Report No. 5J03-05.Alaska Department of Fish and Game, Division of<br />
Commercial Fisheries<br />
Feyrer, F., and M. P. Healey. 2002. Structure, sampling gear and environmental associations, and<br />
historical changes in the fish assemblage of the southern Sacramento-San Joaquin Delta.<br />
California Fish and Game 88:126-138.<br />
108
<strong>Seafood</strong> <strong>Watch</strong>® Wild Pacific Salmon Report October 8, 2010<br />
Finney, B. P., I. Gregory-Eaves, M. S. V. Douglas, and J. P. Smol. 2002. Fisheries productivity<br />
in the northeastern Pacific Ocean over the past 2,200 years. Nature 416:729-733.<br />
Finney, B. P., I. Gregory-Eaves, J. Sweetman, M. S. V. Douglas, and J. P. Smol. 2000. Impacts<br />
of climatic change and fishing on pacific salmon abundance over the past 300 years.<br />
Science 290<br />
Francis, R. C., and S. R. Hare. 1994. Decadal-scale regime shifts in large marine ecosystems of<br />
the Northeast Pacific: a case for historical science. Fisheries Oceanography 3:279-291.<br />
Froese, R., and D. Pauly. 2004. FishBase. www.fishbase.org.<br />
Fuller, P. 2003. USGS Nonindigenous Aquatic Species Database. U.S. Geological Survey.<br />
Accessed 2004. http://nas.er.usgs.gov/queries/SpFactSheet.asp?speciesID=939.<br />
Gaston, A. J., and S. B. C. Dechesne. 1996. Rhinoceros Auklet (Cerorhinca monocerata). in A.<br />
Poole and F. Gill, editors. The Birds of North America, No. 212. The Academy of<br />
Natural Sciences, Philadelphia, PA, and The American Ornithologists' Union,<br />
Washington, D.C.<br />
Gaston, A. J., R. D. Elliot, J. W. Chardine, and J. M. Hipfner. 2003. Murres.<br />
http://www.hww.ca/hww2.asp?pid=1&id=57&cid=7.<br />
Gordon, D. C., P. Scwinghamer, T. W. Rowell, J. Prena, K. Gilkinson, W. P. Vass, and D. L.<br />
McKeown. 1998. Studies in Eastern Canada on the Impact of Mobile Fishing Gear on<br />
Benthic Habitat and Communities. in E. M. Dorsey and J. Pederson, editors. Effects of<br />
Fishing Gear on the Sea Floor of New England. Conservation Law Foundation, Boston,<br />
MA.<br />
Gresh, T., J. Lichatowich, and P. Schoonmaker. 2000. An estimation of historic and current<br />
levels of salmon production in the Northeast Pacific ecosystem: Evidence of a nutrient<br />
deficit in the freshwater systems of the Pacific Northwest. Fisheries 25<br />
Hard, J. J., W. S. Grant, F. W. Waknitz, L. T. Parker, and R. S. Waples. 1996. Status Review of<br />
Pink Salmon from Washington, Oregon, and California. NOAA Technical Memorandum<br />
NMFS-NWFSC-25.National Marine Fisheries Service<br />
Hare, S. R., N. J. Mantua, and R. C. Francis. 1999. Inverse production regimes: Alaska and West<br />
Coast salmon. Fisheries 24:6-14.<br />
Heard, W. 2003. Alaska salmon enhancement: A successful program for hatchery and wild<br />
stocks. in. NOAA/NMFS-Auke Bay Laboratory, Juneau, AK.<br />
Hilborn, R., and D. Eggers. 2000. A review of the hatchery programs for pink salmon<br />
in Prince William Sound and Kodiak Island, Alaska. Transactions of the American Fisheries<br />
Society 129:333-350.<br />
Hilborn, R., T. P. Quinn, D. E. Schindler, and D. E. Rogers. 2003. Biocomplexity and fisheries<br />
sustainability. Proceedings of the National Academy of Sciences 100:6564-6568.<br />
Irvine, J. R. 2002. COSEWIC status report on the coho salmon Oncorhynchus kisutch (interior<br />
Fraser population) in Canada. Committee on the Status of Endangered Wildlife in<br />
Canada, Ottawa.<br />
Johnson, K. A. 2002. A Review of National and International Literature on the Effects of Fishing<br />
on Benthic Habitats. NMFS-F/SPO-57.NOAA Technical Memorandum National Marine<br />
Fisheries Service<br />
Johnson, O., W. S. Grant, R. Kope, K. Neely, F. W. Waknitz, and R. S. Waples. 1997. Status<br />
review of chum salmon from Washington, Oregon, and California. NOAA Technical<br />
Memorandum NMFS-NWFSC-32.National Marine Fisheries Service (NOAA, U.S.<br />
Department of Commerce)<br />
109
<strong>Seafood</strong> <strong>Watch</strong>® Wild Pacific Salmon Report October 8, 2010<br />
Johnston, N. T., E. A. MacIsaac, P. J. Tschaplinski, and K. J. Hall. 2004. Effects of the<br />
abundance of spawning sockeye salmon (Oncorhynchus nerka) on nutrients and algal<br />
biomass in forested streams. Canadian Journal of Fisheries and Aquatic Sciences 61:384-<br />
403.<br />
Kaeriyama, M., M. Nakamura, R. Edpalina, J. R. Bower, H. Yamaguchi, R. V. Walker, and K.<br />
W. Myers. 2004. Change in feeding ecology and trophic dynamics of Pacific salmon<br />
(Oncorhynchus spp.) in the central Gulf of Alaska in relation to climate events. Fisheries<br />
Oceanography 12:197-207.<br />
Kelly, M. D. 2001. Evaluating Alaska’s Ocean-Ranching Salmon Hatcheries: Biologic and<br />
Management Issues. University of Alaska Anchorage, Environment and Natural<br />
Resources Institute (for Trout Unlimited)<br />
http://www.tu.org/pdf/newsstand/library/AKhatcheries.pdf.<br />
Kingsbury, A. 1994. Pink salmon. Alaska Department of Fish and Game. Accessed 2004.<br />
http://www.adfg.state.ak.us/pubs/notebook/fish/pink.php.<br />
Kope, R., and T. Wainwright. 1998. Trends in the status of Pacific salmon populations in<br />
Washington, Oregon, California, and Idaho. North Pacific Anadromous Fish Commission<br />
Bulletin 1:1-12.<br />
Larsen, D. A., B. R. Beckman, K. A. Cooper, D. Barrett, M. Johnston, P. Swanson, and W. W.<br />
Dickhoff. 2004a. Assessment of high rates of precocious male maturation in a spring<br />
Chinook salmon supplementation hatchery program. Transactions of the American<br />
Fisheries Society 133:98-120.<br />
Larsen, D. P., P. R. Kaufmann, T. M. Kincaid, and N. S. Urquhart. 2004b. Detecting persistent<br />
change in the habitat of salmon-bearing streams in the Pacific Northwest. Canadian<br />
Journal of Fisheries and Aquatic Sciences 61:283-291.<br />
Levin, P., S. Achord, B. E. Feist, and R. Zabel. 2002. Non-indigenous brook trout and the demise<br />
of Pacific salmon: a forgotten threat? Proceedings of the Royal Society of London B<br />
269:1663-1670.<br />
Levin, P., and N. Tolimieri. 2001. Differences in the impacts of dams on the dynamics of salmon<br />
populations. Animal Conservation 4:261-299.<br />
Levin, P., and J. G. Williams. 2002. Interspecific effects of artificially propagated fish: an<br />
additional conservation risk for salmon. Conservation Biology 16:1581-1587.<br />
Lichatowich, J., L. Mobrand, and L. Lestelle. 1999. Depletion and extinction of Pacific salmon<br />
(Oncorhynchus spp.): A different perspective. ICES Journal of Marine Science 56<br />
Lindley, S., and M. Mohr. 2003. Modeling the effect of striped bass (Morone saxatilis) on the<br />
population viability of Sacramento River winter-run Chinook salmon (Oncorhynchus<br />
tshawytscha). Fishery Bulletin 101:321-322.<br />
Lindley, S. T., C. B. Grimes, M. S. Mohr, W. Peterson, J. Stein, J. T. Anderson, L. W. Botsford,<br />
D. L. Bottom, C. A. Busack, T. K. Collier, J. Ferguson, J. C. Garza, A. M. Grover, D. G.<br />
Hankin, R. G. Kope, P. W. Lawson, A. Low, R. B. MacFarlane, K. Moore, M. Palmer-<br />
Zwahlen, F. B. Schwing, J. Smith, C.Tracy, R. Webb, B. K. Wells, and T. H. Williams.<br />
2009. What caused the Sacramento River fall Chinook stock collapse? Pre-publication<br />
report to the Pacific Fishery Management Council. March 18, 2009.<br />
http://swr.nmfs.noaa.gov/media/SalmonDeclineReport.pdf.<br />
Lohn, R. 2004. Finding of No Significant Impact, memo to Bill Hogarth, NMFS Director.<br />
National Marine Fisheries Service<br />
110
<strong>Seafood</strong> <strong>Watch</strong>® Wild Pacific Salmon Report October 8, 2010<br />
MacCall, A. D., and T. Wainwright. 2003. Assessing extinction risk for West Coast salmon.<br />
NOAA Technical Memorandum 56(198).National Marine Fisheries Service<br />
McClure, M. M., E. E. Holmes, B. L. Sanderson, and C. E. Jordan. 2003. A large-scale, multispecies<br />
status assessment: anadromous salmonids in the Columbia River basin.<br />
Ecological Applications 13:964-989.<br />
McEvoy, A. 1986. The Fisherman's Problem: Ecology and Law in the California Fisheries, 1850-<br />
1980. Cambridge University Press, Cambridge, England.<br />
McRae, D. M., and P. H. Pearse. 2004. Treaties and Transition: Towards a Sustainable Fishery<br />
on Canada’s Pacific Coast Joint Task Group on Post-Treaty Fisheries. Fisheries and<br />
Oceans Canada<br />
Melvin, E. F., J. K. Parrish, and L. L. Conquest. 1999. Novel tools to reduce seabird bycatch in<br />
coastal gillnet fisheries. Conservation Biology 13:1386-1397.<br />
Milward, D. 2004. Washington Department of Fish and Wildlife, Observer Coverage Manager.<br />
August 20, 2004<br />
Moore, J. W., D. E. Schindler, and M. D. Scheuerell. 2004. Disturbance of freshwater habitats by<br />
anadromous salmon in Alaska. Oecologia 139:198-308.<br />
Morgan, L. E., and R. Chuenpagdee. 2003. Shifting Gears: Addressing the Collateral Impacts of<br />
Fishing Methods in U.S. Waters. Pew Charitable Trusts, Arlington, VA.<br />
Mueter, F. J., R. M. Peterman, and B. J. Pyper. 2002. Opposite effects of ocean temperature on<br />
survival rates of 120 stocks of Pacific salmon (Oncorhynchus spp.) in northern and<br />
southern areas. Canadian Journal of Fisheries and Aquatic Sciences 59:456-463.<br />
Musick, J. A. 1999. Criteria to define extinction risk in marine fishes. Fisheries 24:6-13.<br />
Myers, J. M., R. Kope, G. Bryant, D. J. Teel, L. J. Lierheimer, T. Wainwright, W. S. Grant, F.<br />
W. Waknitz, K. Neely, S. Lindley, and R. S. Waples. 1998. Status review of chinook<br />
salmon from Washington, Idaho, Oregon, and California. NOAA Technical<br />
Memorandum NMFS-NWFSC-35.National Marine Fisheries Service, Seattle, WA.<br />
Myers, R. A., S. Levin, A., R. Lande, F. C. James, W. W. Murdoch, and R. T. Paine. 2004.<br />
Hatcheries and endangered salmon. Science 303:1980.<br />
NMFS. 1998. The Decline of Chinook Salmon: An Addendum to the 1996 West Coast Steelhead<br />
Factors for Decline Report. National Marine Fisheries Service<br />
NMFS. 1999. Fact sheet: West Coast coho salmon (Oncorhynchus kisutch). National Marine<br />
Fisheries Service. http://www.nwr.noaa.gov/1salmon/salmesa/pubs/99cohofs.htm.<br />
NMFS. 2001a. Salmon species description: Sockeye salmon. Office of Protected Resources:<br />
Northwest Regional Office.<br />
NMFS. 2001b. Salmon Species Descriptions: Chum Salmon. Office of Protected Resources:<br />
Northwest Regional Office.<br />
NMFS. 2004a. Endangered species act status of West Coast salmon and steelhead.<br />
NMFS. 2004b. National Marine Fisheries Service Commercial Marine Landings Database.<br />
National Marine Fisheries Service. Accessed 2004.<br />
http://www.st.nmfs.gov/st1/commercial/.<br />
NMFS. 2010a. ESA Salmon Listings. NMFS Northwest Regional Office.<br />
http://www.nwr.noaa.gov/ESA-Salmon-Listings/.<br />
NMFS. 2010b. National Marine Fisheries Service Commercial Marine Landings Database.<br />
National Marine Fisheries Service. Accessed 2010.<br />
http://www.st.nmfs.gov/st1/commercial/.<br />
111
<strong>Seafood</strong> <strong>Watch</strong>® Wild Pacific Salmon Report October 8, 2010<br />
Noakes, D. J., R. J. Beamish, R. Sweeting, and J. King. 2000. Changing the balance: Interactions<br />
between hatchery and wild Pacific coho salmon in the presence of regime shifts. North<br />
Pacific Anadromous Fish Commission Bulletin 2:155-163.<br />
Noss, R. F., E. T. LaRoe, and J. M. Scott. 1995. Endangered Ecosystem of the United States: A<br />
Preliminary Assessment of<br />
Loss and Degradation. U.S. Geological Survey, Washington, D.C.<br />
http://biology.usgs.gov/pubs/ecosys.htm.<br />
NRC. 1996. National Research Council - Upstream: salmon and society in the Pacific Northwest.<br />
National Academy Press, Washington, D.C.<br />
NWFSC. 1995. Status review of coho salmon. Technical Memo 24.National Marine Fisheries<br />
Service<br />
Olsen, J. B., S. J. Miller, W. J. Spearman, and J. K. Wenburg. 2003. Patterns of intra- and interpopulation<br />
genetic diversity in Alaskan coho salmon: Implications for conservation.<br />
Conservation Genetics 4:557-569.<br />
OPR. 2004. Major threats and impacts to Pacific salmonids. NOAA Fisheries, Office of<br />
Protected Resources. http://www.nmfs.noaa.gov/prot_res/PR3/Fish/salmon_impacts.htm.<br />
Peery, C. A., and T. C. Bjorn. 2004. Interactions between natural and hatchery Chinook salmon<br />
parr in a laboratory stream channel. Fisheries Research 66:311-324.<br />
Peterman, R. M., B. J. Pyper, and B. W. MacGregor. 2003. Use of the Kalman filter to<br />
reconstruct historical trends in productivity of Bristol Bay sockeye salmon<br />
(Oncorhynchus nerka). Canadian Journal of Fisheries and Aquatic Sciences 60<br />
PFMC. 2003. Pacific coast salmon plan: Fishery management plan for commercial and<br />
recreational salmon fisheries off the coasts of Washington, Oregon, and California as<br />
revised through Amendment 14. Pacific Fishery Management Council, Portland, OR.<br />
http://www.pcouncil.org/wp-content/uploads/fmpthrua14.pdf.<br />
PFMC. 2004a. Environmental Assessment for the Proposed 2004 Management Measures for the<br />
Ocean Salmon Fishery Managed Under the Pacific Coast Salmon Plan. Pacific Fishery<br />
Management Council, Portland, OR.<br />
http://www.pcouncil.org/salmon/salcurr/fnlsalea04.pdf.<br />
PFMC. 2004b. Information Sheet: Salmon. Pacific Fishery Management Council. Accessed<br />
2004. www.pcouncil.org/facts/salmon.pdf.<br />
PFMC. 2004c. Review of 2003 Ocean Salmon Fisheries. Pacific Fishery Management Council<br />
http://www.pcouncil.org/salmon/salsafe03/salsafe03.html.<br />
PFMC. 2010a. Decisions of the Pacific Fishery Management Council, March 6-11, 2010.<br />
http://www.pcouncil.org/wp-content/uploads/0310decisions.pdf.<br />
PFMC. 2010b. Pacific Fishery Management Council News Release. April 15, 2010.<br />
PFMC. 2010c. Review of 2009 Ocean Salmon Fisheries. Pacific Fishery Management Council,<br />
Portland, OR. http://www.pcouncil.org/wpcontent/uploads/Salmon_Review_2009_Final.pdf.<br />
PFMC. 2010d. Salmon Technical Team Report on Queets Coho Overfishing Assessment.<br />
http://www.pcouncil.org/wp-content/uploads/G3b_STT_RPT1_MARCH_2010_BB.pdf.<br />
PFMC. 2010e. Salmon Technical Team Report on Western Strait Juan de Fuca Coho<br />
Overfishing Assessment. http://www.pcouncil.org/wpcontent/uploads/G3b_STT_RPT2_MARCH_2010_BB.pdf.<br />
Plotnick, M. 2004. Alaska Department of Fish and Game, Fisheries Analyst. August 20, 2004<br />
112
<strong>Seafood</strong> <strong>Watch</strong>® Wild Pacific Salmon Report October 8, 2010<br />
Plotnick, M., and D. Eggers. 2004. Run Forecasts and Harvests Projections for 2004 Alaska<br />
Salmon Fisheries and Review of the 2003 Season. Regional Information Report No.<br />
5J04-01.Regional Information Reports Alaska Department of Fish and Game, Juneau,<br />
AK.<br />
Pringle, C. M., M. C. Freeman, and B. J. Freeman. 2000. Regional effects of hydrologic<br />
alterations on riverine macrobiota in the New World: tropical–temperate comparisons.<br />
Bioscience 50:807-823.<br />
Reisenbichler, R. R., and S. P. Rubin. 1999. Genetic changes from artificial propagation of<br />
Pacific salmon affect the productivity and viability of supplemented populations. ICES<br />
Journal of Marine Science 56:459-466.<br />
Robinson, E. 2004. Hatchery habitat hasn’t helped; Salmon raised in concrete troughs can’t<br />
compete. The Columbian, May 22, 2004.<br />
Ruggerone, G., and D. E. Rogers. 2003. Multi-year effects of high densities of sockeye salmon<br />
spawners on juvenile salmon growth and survival: a case study from the Exxon Valdez<br />
oil spill. Fisheries Research 63:379-392.<br />
Ruggerone, G., M. Zimmermann, K. W. Myers, J. L. Nielsen, and D. E. Rogers. 2003.<br />
Competition between Asian pink salmon (Oncorhynchus gorbuscha) and Alaskan<br />
sockeye salmon (O. nerka) in the North Pacific Ocean. Fisheries Oceanography 12:209-<br />
219.<br />
Sandahl, J. F., D. H. Baldwin, J. J. Jenkins, and N. L. Scholz. 2004. Odor-evoked field potentials<br />
as indicators of sublethal neurotoxicity in juvenile coho salmon (Oncorhynchus kisutch)<br />
exposed to copper, chlorpyrifos, or esfenvalerate. Canadian Journal of Fisheries and<br />
Aquatic Sciences 61:404-413.<br />
Sanford, B. 2004. Washington Department of Fish and Wildlife, chinook manager. August 19,<br />
2004<br />
Schmidt, A. E. 1994. Alaska Department of Fish and Game, Wildlife Notebook Series: Brook<br />
Trout. http://www.adfg.state.ak.us/pubs/notebook/fish/b%5Etrout.php.<br />
Shaul, L., S. McPherson, E. Jones, and K. Crabtree. 2003. Stock Status and Escapement Goals<br />
for Coho Salmon Stocks in Southeast Alaska. Special Publication No. 03-02.Alaska<br />
Department of Fish and Game - Southeast Region, Juneau, AK.<br />
Skalski, J. R., R. Townsend, J. Lady, A. E. Giorgi, J. R. Stevenson, and R. D. McDonald. 2002.<br />
Estimating route-specific passage and survival probabilities at a hydroelectric project<br />
from smolt radiotelemetry studies. Canadian Journal of Fisheries and Aquatic Sciences<br />
59:1385-1393.<br />
SSRT. 2004. National Recovery Strategy for Sockeye Salmon (Oncorhynchus nerka), Sakinaw<br />
Lake Population, in British Columbia (draft). Sakinaw Sockeye Recovery Team., Ottawa.<br />
Steelquist, R. 1992. Field Guide to the Pacific Salmon. Sasquatch Books, Seattle, WA.<br />
Stetkiewicz, C. 2004. U.S. rule change could weaken salmon protection. Environmental News<br />
Network, May 4, 2004. http://www.enn.com/news/2004-05-04/s_23423.asp.<br />
Stewart, I. J., T. P. Quinn, and P. Bentzen. 2003. Evidence for fine-scale natal homing among<br />
island beach spawning sockeye salmon, Oncorhynchus nerka. Environmental Biology of<br />
Fishes 67:77-85.<br />
Tolimieri, N., and P. Levin. 2004. Differences in responses of chinook salmon to climate shifts:<br />
implications for conservation. Environmental Biology of Fishes 70:155-167.<br />
USACOE. 2002. (NID) National Inventory of Dams. Pages U.S. Army Corps of Engineers<br />
Software in<br />
113
<strong>Seafood</strong> <strong>Watch</strong>® Wild Pacific Salmon Report October 8, 2010<br />
USGS. 2004. Nonindigenous Aquatic Species Database. U.S. Geological Survey. Accessed<br />
2004. http://nas.er.usgs.gov.<br />
Vander Haegen, G. E., K. W. Yi, J. F. Dixon, and C. E. Ashbrook. 2002. Commercial selective<br />
harvest of coho salmon and chinook salmon on the Willapa River using tangle nets and<br />
gill nets. Final report – IAC contract 01-1018N.Washington Department of Fish and<br />
Wildlife<br />
Waples, R. S. 1991. Genetic interactions between hatchery and wild salmonids: lessons from the<br />
Pacific Northwest. Canadian Journal of Fisheries and Aquatic Sciences 48:124-133.<br />
Waples, R. S. 2002. Effective size of fluctuating salmon populations. Genetics 161:783-791.<br />
Waples, R. S., D. J. Tell, J. M. Myers, and A. R. Marshall. 2004. Life-history divergence in<br />
Chinook salmon: Historic contingency and parallel evolution. Evolution 58:386-403.<br />
WDFW. 2002a. Chum salmon. Washington Department of Fish and Wildlife.<br />
http://wdfw.wa.gov/fish/chum/index.htm.<br />
WDFW. 2002b. Fact sheet: How fishing seasons are set. Washington Department of Fish and<br />
Wildlife. http://wdfw.wa.gov/factshts/harvest.htm.<br />
WDFW. 2004a. Chum salmon. Washington Department of Fish and Wildlife. Accessed 2004.<br />
http://wdfw.wa.gov/fish/chum/.<br />
WDFW. 2004b. Salmonscape. Pages Online GIS watershed mapping query tool. in. Washington<br />
Department of Fish and Wildlife http://wdfw.wa.gov/mapping/salmonscape/.<br />
WDFW. 2004c. Sockeye salmon. Washington Department of Fish and Wildlife. Accessed 2004.<br />
http://wdfw.wa.gov/fish/sockeye/.<br />
Willette, T. M. 2001. Foraging behaviour of juvenile pink salmon (Oncorhynchus gorbuscha)<br />
and size-dependent predation risk. Fisheries Oceanography 10:110-131.<br />
Willette, T. M., R. T. Cooney, V. Patrick, D. M. Mason, G. L. Thomas, and D. Scheel. 2001.<br />
Ecological processes influencing mortality of juvenile pink salmon (Oncorhynchus<br />
gorbuscha) in Prince William Sound, Alaska. Fisheries Oceanography 10:14-41.<br />
Wipfli, M. S., J. P. Hudson, J. P. Caouette, and D. T. Chaloner. 2003. Marine subsidies in<br />
freshwater ecosystems: Salmon carcasses increase the growth rates of stream-resident<br />
salmonids. Transactions of the American Fisheries Society 132:371-381.<br />
Yoshiyama, R. M., F. W. Fisher, and P. B. Moyle. 1998. Historical abundance and decline of<br />
chinook salmon in the Central Valley Region of California. North American Journal of<br />
Fisheries Management 18:487-521.<br />
Zadina, T. P., S. C. Heinl, A. J. McGregor, and H. J. Geiger. 2003. Pink Salmon Stock Status and<br />
Escapement Goals in Southeast Alaska and Yakutat. Regional Information Report No.<br />
1J03-06.Alaska Department of Fish and Game - Division of Commercial Fisheries.<br />
Southeast Region, Juneau, AK.<br />
114
<strong>Seafood</strong> <strong>Watch</strong>® Wild Pacific Salmon Report October 8, 2010<br />
Appendices<br />
Appendix I<br />
The PFMC decided to open limited salmon fisheries in CA and OR for the 2010 fishing season.<br />
Therefore, we updated the report to reflect the current status of the CA and OR fisheries. The<br />
PFMC manages west coast salmon fisheries at a finer scale than traditional state boundaries, so<br />
our recommendations reflect this finer scale. The Sacramento River fall Chinook stock<br />
represents the vast majority of the fish in California’s commercial landings and a large<br />
percentage of Oregon’s. According to the Oregon Department of Fish and Wildlife, between 70<br />
and 99 percent of Oregon fish are landed south of Cape Falcon. Recent history shows everdeclining<br />
returns of adult Chinook to the Sacramento River and high concerns remain regarding<br />
bycatch of threatened and endangered salmon species in the California and Oregon fisheries.<br />
This results in a <strong>Seafood</strong> <strong>Watch</strong>® recommendation of Avoid for wild-caught salmon from CA<br />
and OR, south of Cape Falcon. In contrast, salmon from the Columbia River make up most of the<br />
catch north of Cape Falcon, Oregon. The Columbia River salmon stock landed in these fisheries<br />
has generally met management goals in recent years and the stock is considered moderately<br />
healthy; therefore, salmon caught in the ocean fisheries north of Cape Falcon, Oregon (and in the<br />
Columbia River in-river fisheries) are considered a “Good Alternative,” as are the salmon<br />
fisheries of Washington State.<br />
Because salmon fisheries in California and Oregon (south of Cape Falcon) supply mainly fresh<br />
product that is only available during the fishing season (May through September), in October of<br />
2010, we revised the report to reflect only recommendations for Alaska, Washington and Oregon<br />
(north of Cape Falcon). The fishery in California and Oregon (south of Cape Falcon) will be reevaluated<br />
when 2011 fisheries regulations are determined and the 2011 season opens.<br />
115