ESI-LC-MS Matrix Effect Toolbox
ESI-LC-MS Matrix Effect Toolbox
ESI-LC-MS Matrix Effect Toolbox
You also want an ePaper? Increase the reach of your titles
YUMPU automatically turns print PDFs into web optimized ePapers that Google loves.
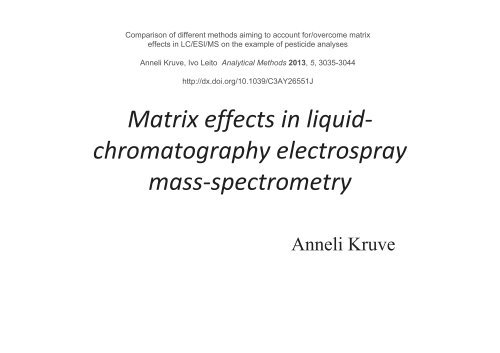
Comparison of different methods aiming to account for/overcome matrix<br />
effects in <strong>LC</strong>/<strong>ESI</strong>/<strong>MS</strong> on the example of pesticide analyses<br />
Anneli Kruve, Ivo Leito Analytical Methods 2013, 5, 3035-3044<br />
http://dx.doi.org/10.1039/C3AY26551J<br />
<br />
<br />
<br />
Anneli Kruve
Electrospray ionization<br />
• <strong>ESI</strong> is used to connect<br />
<strong>LC</strong> and <strong>MS</strong><br />
• <strong>LC</strong> effluent is sprayed<br />
into small droplets<br />
• Droplets devide into<br />
smaller droplets<br />
• From the surface of<br />
small droplets ions can<br />
reach gas phase<br />
Nebulizer gas N 2<br />
+<br />
+<br />
+<br />
HP<strong>LC</strong> effluent<br />
Nebulizer<br />
+<br />
+<br />
+ + + + + + + + +<br />
Voltage ~3500 V<br />
+<br />
<strong>MS</strong><br />
Drying gas N 2<br />
Waste<br />
2
Contents<br />
• <strong>Matrix</strong> effects in <strong>LC</strong>-<strong>ESI</strong>-<strong>MS</strong>, their<br />
presence and evaluation<br />
• Approaches for combating matrix effects<br />
– Extrapolative dilution<br />
– Sample preparation<br />
– Accounting for matrix effects<br />
– <strong>ESI</strong> optimization to reduce matrix effects<br />
• Conclusions<br />
3
<strong>Matrix</strong> effect<br />
• Ionization efficiency in <strong>ESI</strong> depends on:<br />
– Solvent composition<br />
– <strong>ESI</strong> parameters<br />
– Compounds<br />
co-eluting with<br />
analyte<br />
Are not present<br />
in standards but<br />
are present in<br />
samples<br />
Are kept constant<br />
during analyses<br />
Same amount of<br />
analyte gives<br />
different signal<br />
in sample and in<br />
standard<br />
<strong>Matrix</strong> effect<br />
4
How does matrix effect look like?<br />
Intens.<br />
x10 5<br />
Analyte in standard<br />
4<br />
3<br />
2<br />
Analyte in sample<br />
1<br />
0<br />
12.0 12.5 13.0 13.5 14.0 14.5 15.0 Time [min]<br />
5
Combating matrix effect<br />
• Reducing matrix effects<br />
– Sample preparation<br />
– Dilution of the sample<br />
– Instrumental parameters<br />
• Taking matrix effect into account<br />
– Correcting results<br />
– Uncertainty<br />
6
Evaluation of matrix effect<br />
• Is expressed as a ratio of analyte signal in sample and in<br />
standard: %ME<br />
PeakArea<br />
% ME =<br />
Sample<br />
⋅100%<br />
PeakArea S tandard<br />
CalibrationGraphSlope<br />
% ME =<br />
CalibrationGraphSlope<br />
Sample<br />
Standard<br />
⋅100%<br />
• %ME 100% - no matrix effect<br />
• %ME100% - ionization enhancement<br />
7
Glyphosate calibration graph in<br />
cereals<br />
Slopes vs Peak Areas<br />
1.60E+07<br />
1.40E+07<br />
Standard<br />
Wheat<br />
Rye<br />
In case of wheat calibration<br />
graph becomes nonlinear -<br />
%ME is not constant<br />
1.20E+07<br />
In case of strong supression<br />
1.00E+07<br />
calibratin graph is linear<br />
Peak area<br />
8.00E+06<br />
6.00E+06<br />
4.00E+06<br />
2.00E+06<br />
0.00E+00<br />
0.0 2.0 4.0 6.0 8.0 10.0 12.0 14.0 16.0<br />
c (mg/kg)<br />
8
<strong>Matrix</strong> effect’s dependence on<br />
analyte concentration<br />
Garlic sample<br />
Aldicarb<br />
Methomyl<br />
Thiabendazole<br />
0 1 2 3 4 5<br />
c, mg/kg<br />
160%<br />
140%<br />
120%<br />
100%<br />
80%<br />
60%<br />
40%<br />
20%<br />
0%<br />
% M E<br />
• %ME depends on the<br />
analyte concentration<br />
in the sample<br />
• Risk of<br />
underestimated results<br />
at lower<br />
concentrations<br />
• %ME can not be used<br />
for correction of the<br />
analysis results<br />
9
Sample dilution<br />
%ME<br />
120%<br />
100%<br />
80%<br />
60%<br />
40%<br />
20%<br />
0%<br />
0.00 0.20 0.40 0.60 0.80 1.00 1.20<br />
Dilution factor<br />
• The amount of<br />
co-eluting compounds<br />
is reduced<br />
• <strong>Matrix</strong> effect is<br />
reduced<br />
• <strong>Matrix</strong> effect may or<br />
may not be eliminated<br />
10
Calculated concentration (mg/kg)<br />
0.60<br />
6.00<br />
0.50<br />
0.45<br />
0.50<br />
A 5.00<br />
B<br />
0.40<br />
C<br />
0.40<br />
4.00<br />
0.35<br />
0.30<br />
0.30<br />
3.00<br />
0.25<br />
0.20<br />
0.20<br />
2.00<br />
0.15<br />
0.10<br />
0.10<br />
1.00<br />
0.05<br />
0.00<br />
0.00<br />
0.00<br />
0 0.2 0.4 0.6 0.8 1 1.2<br />
0 0.05 0.1 0.15 0.2 0.25 0.3<br />
0 0.2 0.4 0.6 0.8 1 1.2<br />
Calculated concentration (mg/kg)<br />
Dilution factor<br />
Dilution factor<br />
Dilution factor<br />
Calculated concentration (mg/kg)<br />
No matrix effect<br />
Dilution eliminates<br />
matrix effect<br />
Dilution does not<br />
eliminate matrix effect<br />
Analyte concentration is<br />
calculated as the average<br />
of all the measurements<br />
Analyte concentration is<br />
the average of 3 most<br />
diluted samples<br />
Analyte concentration is<br />
estimated as the<br />
intercept of the plot<br />
11
Validation<br />
• 5 fruits and vegetables, spiked with 5<br />
pesticides at 2 concentration levels<br />
– 11 observations of situation A<br />
– 6 observations of situation B<br />
– 33 observations of situation C<br />
• According to E n scores all of the calculated<br />
concentrations agreed with the spiked<br />
concentrations<br />
12
Sample preparation<br />
180%<br />
160%<br />
140%<br />
120%<br />
100%<br />
80%<br />
60%<br />
40%<br />
20%<br />
0%<br />
Luke QuEChERS <strong>MS</strong>PD<br />
14<br />
aldicarb sulphoxide<br />
aldicarb sulphone<br />
demeton-S-methyl sulphoxide<br />
carbendazim<br />
methomyl<br />
thiabendazole<br />
methiocarb sulphoxide<br />
methiocarb sulphone<br />
aldicarb<br />
imazalil<br />
phorate sulphoxide<br />
phorate sulphone<br />
methiocarb<br />
Luke and <strong>MS</strong>PD result in less matrix effect
Thiodicarb<br />
• In all samples<br />
ionization<br />
enhancement was<br />
observed<br />
• Enhancement occured<br />
with all sample<br />
preparation methods<br />
Valge klaar (Rakvere)<br />
Blank solvent<br />
700%<br />
600%<br />
500%<br />
400%<br />
300%<br />
200%<br />
100%<br />
0%<br />
15<br />
Valge klaar (Tartu)<br />
Tellissaare<br />
Melba (Rakvere)<br />
Antonovka (Tartu)<br />
Kuldrenett (Tartu)<br />
Kuldrenett (Rakvere)<br />
Talvenauding<br />
Suislepp<br />
Pikniku<br />
%ME
“Seeing” matrix effect<br />
UV absorbance, mAU<br />
18<br />
16<br />
14<br />
12<br />
10<br />
8<br />
6<br />
Interfring<br />
compound<br />
Minimum in aldicarb<br />
peak in case of<br />
QuEChERS extract<br />
6000000<br />
5000000<br />
4000000<br />
3000000<br />
2000000<br />
<strong>MS</strong> signal, cps<br />
• Next to aldicarb a<br />
peak elutes in the UVchromatogram<br />
• The shape of aldicarb<br />
peak is distorted<br />
4<br />
1000000<br />
2<br />
0<br />
12.3 12.8 13.3 13.8 14.3<br />
0<br />
Retention time, min<br />
16
Correlation between the UV peak<br />
and matrix effect<br />
U V pe a k a re a<br />
450000<br />
400000<br />
350000<br />
300000<br />
250000<br />
200000<br />
150000<br />
• Measurements are<br />
carried out at different<br />
analyte<br />
concentrations!<br />
100000<br />
50000<br />
0<br />
0% 10% 20% 30% 40% 50% 60% 70% 80% 90% 100%<br />
%ME<br />
17
Hypothesis<br />
• If for aldicarb a compound causing matrix<br />
effect can be seen in UV, then for other<br />
analytes such compounds may exist also<br />
– Scanned mass spectra<br />
• Background ions<br />
19
Background ions<br />
• Are always there<br />
– Solvent impurities<br />
– Plasticizers<br />
• Originate from the sample<br />
– Co-extracted compounds<br />
Intensity changes<br />
due to matrix effect<br />
May cause matrix<br />
effect<br />
20
Scanned Spectra<br />
Garlic samples<br />
Standards<br />
Onion samples<br />
• PCA was used to<br />
select background ions<br />
varying most from<br />
standards to samples<br />
21
Correction of analysis results<br />
Average error (mg/kg)<br />
Average error (mg/kg)<br />
0.60<br />
0.50<br />
0.40<br />
0.30<br />
0.20<br />
0.10<br />
0.00<br />
0.70<br />
0.60<br />
0.50<br />
0.40<br />
0.30<br />
0.20<br />
0.10<br />
0.00<br />
Methomyl<br />
Carbendazime<br />
Thiabendazole<br />
Aldicarb<br />
Imazalil<br />
Methiocarb<br />
Training set<br />
n=1 n=2 n=3 n=4 n=5 n=6<br />
Number of linear combinations<br />
Test set<br />
n=1 n=2 n=3 n=4 n=5 n=6<br />
Number of linear combinations<br />
Methomyl<br />
Carbendazime<br />
Thiabendazole<br />
Aldicarb<br />
Imazalil<br />
Methiocarb<br />
• Background ions<br />
intensities together<br />
with analyte peak area<br />
were used in PLS<br />
regression to calculate<br />
the analyte<br />
concentration<br />
22
Results<br />
Average error<br />
Garlic Onion Garlic Garlic Standard Standard Solvent (mg/kg)<br />
Methomyl Spiked 0.89 0.87 0.48 0.89 1.49 0.90 0.00<br />
PLS 0.74 1.02 0.56 0.90 1.46 0.88 -0.13 0.10<br />
Solvent calibration 0.74 1.01 0.38 0.74 1.42 0.87 -0.07 0.11<br />
Carbendazim Spiked 0.25 0.25 0.14 0.25 0.42 0.25 0.00<br />
PLS 0.17 0.23 0.15 0.20 0.44 0.34 -0.02 0.05<br />
Solvent calibration 0.14 0.21 0.07 0.12 0.38 0.28 -0.02 0.07<br />
Thiabendazole Spiked 1.14 1.11 0.61 1.14 1.91 1.14 0.00<br />
PLS 0.84 1.07 0.92 0.78 2.14 1.41 -0.14 0.25<br />
Solvent calibration 0.65 0.90 0.30 0.38 1.74 1.18 -0.09 0.38<br />
Aldicarb Spiked 0.92 0.90 0.50 0.92 1.54 0.92 0.00<br />
PLS 1.20 0.85 0.78 0.55 1.34 1.00 0.05 0.22<br />
Solvent calibration 0.25 0.58 0.06 0.22 1.37 0.97 -0.11 0.43<br />
Imazalil Spiked 1.13 1.11 0.61 1.13 1.89 1.13 0.00<br />
PLS 1.25 0.83 1.19 0.91 1.89 1.29 0.09 0.27<br />
Solvent calibration 0.32 0.60 0.19 0.38 1.78 1.12 -0.20 0.49<br />
Methiocarb Spiked 0.99 0.97 0.54 0.99 1.66 1.00 0.00<br />
PLS 0.88 1.09 0.86 0.60 1.31 0.95 -0.01 0.24<br />
Solvent calibration -0.10 0.28 -0.11 -0.10 1.47 1.01 -0.12 0.69<br />
23
<strong>Matrix</strong> effect as an uncertainty<br />
source<br />
• If low uncertainty is not needed in the analysis<br />
then matrix effect can be included as an<br />
uncertainty source<br />
• <strong>Matrix</strong> effect graph approach<br />
• <strong>Matrix</strong>-matched calibration<br />
25
<strong>Matrix</strong> effect graph<br />
• Each calibration solution is prepared in a different<br />
matrix<br />
– Same commodity group<br />
– Different commodity groups<br />
26
Single-matrix<br />
calibration<br />
A<br />
i<br />
ε<br />
r<br />
i<br />
= b0 + b1<br />
⋅Ci<br />
+ ε<br />
i<br />
=<br />
b<br />
0<br />
ε<br />
i<br />
+ b<br />
1<br />
⋅C<br />
i<br />
Same commoditygroup<br />
calibration<br />
realtive unsigned residuals<br />
1.200<br />
1.000<br />
0.800<br />
0.600<br />
0.400<br />
0.200<br />
<strong>Matrix</strong> effect graph for Methiocarb<br />
eggplant<br />
beans<br />
garlic<br />
apple<br />
lemon<br />
rye<br />
gooseberries<br />
0.000<br />
Different commoditygroup<br />
calibration<br />
u<br />
r<br />
R<strong>MS</strong><br />
=<br />
Sample)<br />
n<br />
∑<br />
j=<br />
1<br />
(<br />
r<br />
ε )<br />
j<br />
n − 2<br />
u( A = u ⋅ A<br />
r<br />
R<strong>MS</strong><br />
2<br />
Sample<br />
27
Validation<br />
• 15 samples were spiked with 4 pesticides and the<br />
results were calculated<br />
• According to E n scores all of the calculated<br />
concentrations but one agreed with the spiked<br />
r<br />
concentrations while using u R<strong>MS</strong><br />
calculated in the<br />
same commodity group<br />
• Using different commodity groups results in<br />
higher uncertainty – all results agreed with spiked<br />
concentrations<br />
28
Is matrix effect dependent on<br />
something else ... ?<br />
• According to common understanding ... NO<br />
• <strong>ESI</strong> parameters influence on matrix effect was<br />
studied<br />
– 3 different optimization stratagies were used<br />
– Intensity optima and matrix effect optima do not<br />
coincide<br />
• <strong>Matrix</strong> effect can be reduced with appropriate <strong>ESI</strong>/<strong>MS</strong><br />
parameters<br />
– <strong>ESI</strong>/<strong>MS</strong> parameters DO influnce the %ME<br />
30
Parameter optima for standards<br />
and samples<br />
31
Summary<br />
• <strong>Matrix</strong> effect depends on ...<br />
– ... analytes, matrices and concentrations<br />
– ... sample preparation<br />
• Extrapolative dilution<br />
• Result correction via background ions<br />
• Uncertainty calculation<br />
• <strong>ESI</strong>/<strong>MS</strong> parameter optimization<br />
33
Thank you!<br />
Ivo Koit Minu pere Riin Karin Karl Merit Triin Maris Anna Anna-Helena Olga Kaisa<br />
Lauri Geven Artur Rain Elin Jaan Allan Lauri Signe Ivari Eva-Ingrid Erik Ester Marju<br />
Siret Kaarel Asko Hanno Gert Ragne Vahur Kristo Kerli Tapio Risto


