Bio - Bio Project - European Soil Portal - Europa
Bio - Bio Project - European Soil Portal - Europa
Bio - Bio Project - European Soil Portal - Europa

Create successful ePaper yourself
Turn your PDF publications into a flip-book with our unique Google optimized e-Paper software.
and leaching. However, the results are still under<br />
analysis. The paper will present only the modelling<br />
results.<br />
2. Materials and methods<br />
2.1 Modelling Approach<br />
2.1.1 STATISTICAL MODEL<br />
The statistical modelling approach consists of a<br />
simplified conceptual model, considering two different<br />
pathways in nutrient transfer from sources to the<br />
catchment outlet. Diffuse sources (DS), include applied<br />
fertiliser (artificial and manure), atmospheric<br />
deposition, and scattered dwellings, are first reduced in<br />
the soil and then retained partially in the streams, while<br />
point sources (PS) which include discharges from<br />
sewers, waste water treatment plants, industries, and<br />
paved areas are only retained in the streams (Grizzetti et<br />
al., 2005).<br />
2.1.2 EPIC MODEL<br />
The EPIC (Erosion-Productivity Impact Calculator;<br />
Williams et al., 1995) is a field scale model, originally<br />
developed to simulate the long-term effects of soil<br />
erosion on soil productivity. A nutrient cycling and<br />
pesticide fate routines were added later on. The various<br />
developments of EPIC are given by Gassman et al.<br />
(2005).<br />
2.2 EU Database<br />
The data used in this study was derived from a<br />
harmonized database developed for EU15. Three major<br />
data sets are being used which include a soil map, a<br />
land-cover land use map, and a climatic database. Pan-<br />
<strong>European</strong> soil data collected for this research includes<br />
the <strong>European</strong> <strong>Soil</strong> Bureau Database (ESBD) v1.0, which<br />
provides an important source of information for the EC<br />
in the monitoring of soil quality, soil organic matter,<br />
degradation, contamination, and for assistance in the<br />
formation and evaluation of policies towards sustainable<br />
agriculture (ESB, 1998). Landover data are available<br />
from the Corine (Coordination of information on the<br />
environment) database. Meteorological data for the<br />
years 1990 to 2003 were obtained from the Monitoring<br />
Agriculture and Regional Information Systems (MARS)<br />
Unit of the JRC. The MARS meteorological database<br />
contains daily data spatially interpolated on a 50 km x<br />
50 km grid-cell.<br />
In addition, atmospheric N deposition data was derived<br />
from the Precipitation Chemistry Database of the Co-<br />
EUR 22245 EN (2006) <strong>Bio</strong>-<strong>Bio</strong> <strong>Project</strong><br />
27<br />
operative Programme for the Monitoring and Evaluation<br />
of the Long-Range Transmission of Air Pollutants in<br />
Europe (EMEP). Nitrogen and phosphorous input data<br />
for both mineral and manure fertiliser was taken at<br />
NUTS level 2 from the Capri (Common Agricultural<br />
Policy Regional Impact Analysis economic) model<br />
(Heckelei and Britz, 2000).<br />
3. Results<br />
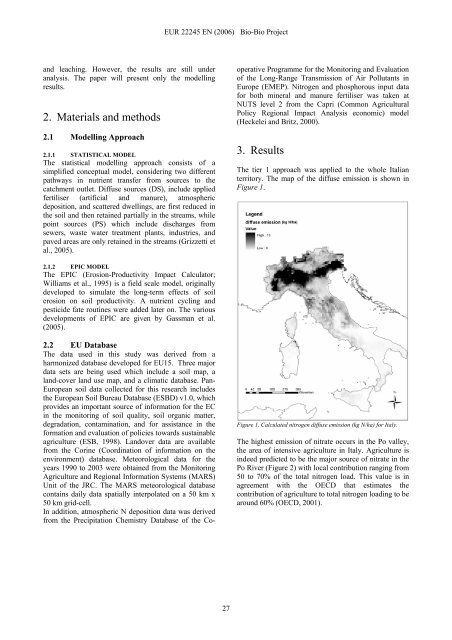
The tier 1 approach was applied to the whole Italian<br />
territory. The map of the diffuse emission is shown in<br />
Figure 1.<br />
Figure 1. Calculated nitrogen diffuse emission (kg N/ha) for Italy.<br />
The highest emission of nitrate occurs in the Po valley,<br />
the area of intensive agriculture in Italy. Agriculture is<br />
indeed predicted to be the major source of nitrate in the<br />
Po River (Figure 2) with local contribution ranging from<br />
50 to 70% of the total nitrogen load. This value is in<br />
agreement with the OECD that estimates the<br />
contribution of agriculture to total nitrogen loading to be<br />
around 60% (OECD, 2001).