Bio - Bio Project - European Soil Portal - Europa
Bio - Bio Project - European Soil Portal - Europa
Bio - Bio Project - European Soil Portal - Europa

You also want an ePaper? Increase the reach of your titles
YUMPU automatically turns print PDFs into web optimized ePapers that Google loves.
was derived from a French approach developed by<br />
INRA [2] . Every area was equally divided in 9 sub-units<br />
having 6.6 m side. Litter, roots, stones and other coarse<br />
material were removed before sampling. The different<br />
horizons have been sampled and the 9 sub samples of<br />
each horizon were mixed together in a homogeneous<br />
mean sample. Moreover, three different depths were<br />
sampled: 0-5 cm, 0-15 cm and 15-30 cm [3] .<br />
Figure 4 - Sampling scheme<br />
<strong>Soil</strong> samples collection has been performed<br />
contemporarily with the AM-1 sampling campaign of<br />
the Pavia <strong>Project</strong>, by specialized technicians of the <strong>Soil</strong><br />
& Waste Unit of JRC Ispra.<br />
Figure 5 - delimitation and subdivision of the sampled area<br />
Figure 6 and 7 - Sampling operations<br />
EUR 22245 EN (2006) <strong>Bio</strong>-<strong>Bio</strong> <strong>Project</strong><br />
39<br />
Each of the 9 soil samples (3 areas and 3 depths) was<br />
homogenized and then divided in 4 sub-samples. First<br />
aliquot was utilized for the determination of total<br />
mercury content, total and organic carbon, pH<br />
measurement and macro-elements determination. The<br />
second has been delivered to the technicians of the<br />
University Sacro Cuore in Piacenza for the heavy<br />
metals determination.<br />
Another part, after air drying, was delivered to the<br />
Experimental Institute of Plants Nutrition in Rome for<br />
microbiological analysis and evaluation of PCBs<br />
concentration (analysis performed by the Health<br />
Superior Institute in Rome). The fourth fraction of soil,<br />
frozen and preserved in dark glass bottles, was used for<br />
the determination of dioxins’ concentration.<br />
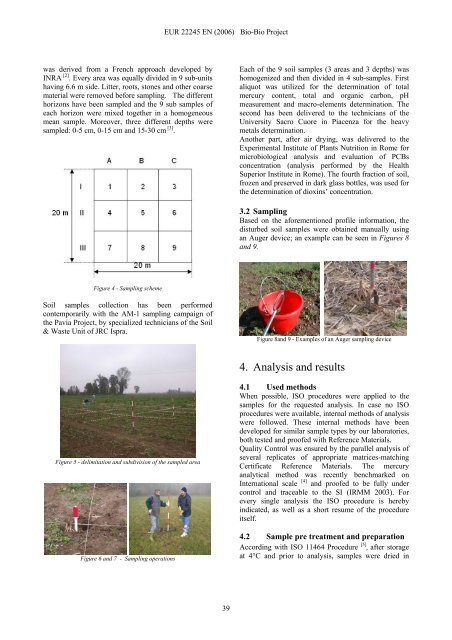
3.2 Sampling<br />
Based on the aforementioned profile information, the<br />
disturbed soil samples were obtained manually using<br />
an Auger device; an example can be seen in Figures 8<br />
and 9.<br />
Figure 8and 9 - Examples of an Auger sampling device<br />
4. Analysis and results<br />
4.1 Used methods<br />
When possible, ISO procedures were applied to the<br />
samples for the requested analysis. In case no ISO<br />
procedures were available, internal methods of analysis<br />
were followed. These internal methods have been<br />
developed for similar sample types by our laboratories,<br />
both tested and proofed with Reference Materials.<br />
Quality Control was ensured by the parallel analysis of<br />
several replicates of appropriate matrices-matching<br />
Certificate Reference Materials. The mercury<br />
analytical method was recently benchmarked on<br />
International scale [4] and proofed to be fully under<br />
control and traceable to the SI (IRMM 2003). For<br />
every single analysis the ISO procedure is hereby<br />
indicated, as well as a short resume of the procedure<br />
itself.<br />
4.2 Sample pre treatment and preparation<br />
According with ISO 11464 Procedure [5] , after storage<br />
at 4°C and prior to analysis, samples were dried in