VENEZUELA ENERGY IN FIGURES - Servicios IESA
VENEZUELA ENERGY IN FIGURES - Servicios IESA
VENEZUELA ENERGY IN FIGURES - Servicios IESA
- No tags were found...

Create successful ePaper yourself
Turn your PDF publications into a flip-book with our unique Google optimized e-Paper software.
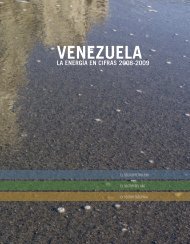
<strong>VENEZUELA</strong> <strong>ENERGY</strong> <strong>IN</strong> <strong>FIGURES</strong><br />
2012<br />
THE OIL AND GAS SECTOR<br />
1
Contents<br />
THE OIL SECTOR<br />
OIL <strong>FIGURES</strong> 2012 04<br />
<strong>IN</strong>STITUTIONAL FRAMEWORK 05<br />
OIL PRICES 14<br />
EXPLORATION AND PRODUCTION 16<br />
REF<strong>IN</strong><strong>IN</strong>G 29<br />
COMMERCIALIZATION 32<br />
FISCAL POLICY AND THE OIL SECTOR 34<br />
GAS SECTOR<br />
GAS <strong>FIGURES</strong> 2012 39<br />
<strong>IN</strong>STITUTIONAL FRAMEWORK 40<br />
MA<strong>IN</strong> ACTORS 42<br />
FISCAL FRAMEWORK 43<br />
EXPLORATION AND PRODUCTION 44<br />
PDVSA: RESERVES, PRODUCTION AND CONSUMPTION 45<br />
PROJECTIONS 2011-2035 – OIL SECTOR 53<br />
PROJECTIONS 2011-2035 – GAS SECTOR 55<br />
3
Conventional oil reserves<br />
(light and medium)<br />
38.9 billion barrels.<br />
THE <strong>IN</strong>STITUTIONAL LEGAL FRAMEWORK FOR ACCESS TO OIL<br />
AND GAS RESOURCES <strong>IN</strong> <strong>VENEZUELA</strong><br />
Legislative Body-Statute of the Venezuelan Oil Sector<br />
Constitution of the Bolivarian Republic of Venezuela, (CBRV, 1999)<br />
Mineral and hydrocarbon deposits of any nature that exist within national territory, beneath the territorial<br />
sea bed, within the exclusive economic zone and on the continental shelf, are property of the Republic,<br />
are of public domain, and therefore inalienable and imprescriptible. (Article 12)<br />
The governance and management of mines and hydrocarbons is reserved to the Federal Government.<br />
(Article 156, paragraph 16)<br />
The State reserves for itself all oil activities, for strategic reasons and national interest, through the pertinent<br />
organic law (the Organic Law of Hydrocarbons). (Article 302)<br />
For reasons of economic and political sovereignty and national strategy, the State shall retain all shares<br />
of Petróleos de Venezuela, S.A. (PDVSA). (Article 303)<br />
Hydrocarbons Organic Law (HOL, 2011) Gaceta Oficial 38.443 05/24/2006.<br />
This Decree-Law governs liquid hydrocarbons exploration, exploitation, refining, industrial development,<br />
freight, storage, commercial and conservation activities. The activities pertaining to gaseous hydrocarbons<br />
shall be governed by the Gaseous Hydrocarbons Organic Law<br />
The Venezuelan State ratifies its legal ownership of hydrocarbons reserves. (Article 3)<br />
The State reserves to itself primary activities (exploration and exploitation) and commercialization of crudes<br />
(Articles 9 & 10). However, these activities could be realized by joint ventures as long as the state owns more<br />
than 50 percent of the shares. Operating firms will be in charge of primary activities. (Article 22)<br />
This Law establishes the creation through Executive Decree of state-owned firms related to the activities<br />
previously listed. They may adopt the legal form judged to be most convenient. (Articles 27to 31)<br />
The workers of stated-owned oil corporations, with the exception of the members of their Boards of<br />
Directors, shall enjoy employment stability and may only be terminated for the causes expressly stated<br />
in the labor legislation (Article32)<br />
The ascribed public bureau will promote bidding processes for the selection of operating firms, in order<br />
to evaluate different offers. However, for Public Interest or special technical reasons, a direct selection<br />
of operating firms could be done through Council of Ministers. (Article 37)<br />
With the objective of adding value through the production of hydrocarbon specialties and derivatives,<br />
the refined oil industrialization effort concerns the activities of: separation, distillation, purification,<br />
conversion, mixing and transformation of crudes. (Article 49)<br />
5
THE <strong>IN</strong>STITUTIONAL LEGAL FRAMEWORK FOR ACCESS TO OIL<br />
AND GAS RESOURCES <strong>IN</strong> <strong>VENEZUELA</strong><br />
Fiscal framework<br />
The general taxation applicable to any operating company is determined by the provisions of the Law<br />
on Income Tax (In Spanish “LISLR”) and by the royalty and tax regime established in Chapter VI of the LOH.<br />
Additionally, according to Article 36 of the LOH, in those instruments that grant the right to perform activities,<br />
special advantages for the Republic may be established, such as the increase in royalties, contributions or other<br />
considerations provided for in the same law, employment and assignment of new and advanced technologies.<br />
Income Tax Law (Gaceta Oficial Nº 38628 02/16/2007)<br />
Is a proportional tax rate equivalent to 50 percent (Articles 11 & 53, paragraph b).<br />
State-owned firms dedicated to hydrocarbons production or related activities are exempted<br />
of income tax over the value generated by previous studies, technical knowledge, data, equations,<br />
recordings, movies or other assets of similar nature needed to accomplish contracts of national concern.<br />
Royalty (HOL, articles 44 to 47)<br />
This rate (30 percent) applies to conventional oil exploitation. The applicable rate for heavyweight<br />
oil could be lower than 30 percent depending on special characteristics of the project.<br />
Particularly, the royalty could be lowered if it is proven that exploitation is not profitable at the usual<br />
rate. The minimum rate for mature or heavy weight oil fields will be 20 percent. In case of Orinoco´s<br />
Belt mixed oils, the minimum rate will be 16 2/3%. The National Executive holds the prerogative<br />
to increase royalties back to 30 percent if the project proves to be profitable at that rate (Article 44).<br />
The National Executive could demand the royalty to be paid in money or in kind. If not specified, it would be<br />
assumed that the medium of payment will be money (Article 45).<br />
In case of money payment, the operating firm should pay the price established at field production<br />
and market or agreed value (Article 47).<br />
Superficial Tax (HOL, Article 48)<br />
Yearly payment of one hundred tax units per each square kilometer of the given and unexploited<br />
superficial area.<br />
This tax will grow yearly at a two percent (2 percent) rate over the first five years of the project and five<br />
percent (5 percent) thereon.<br />
9
Tax over own consumption (HOL, Article 48)<br />
Is equivalent to a rate of 10 percent for each cubic meter of hydrocarbons derivatives produced and<br />
consumed as fuel for operational activities. The consumer price of the product should be used for<br />
purposes of quantifying the amount owed.<br />
General Consumption Tax (HOL, Article 48)<br />
This tax applies to each liter of hydrocarbons derivative product sold in the domestic market, ranging from<br />
30 to 50 percent of the price. The effective rate is set in the annual Budget Law.<br />
Extraction Tax (HOL, Article 48)<br />
Payment equivalent to a third of the value of liquid hydrocarbons extracted at the operative area. It should<br />
be measured according to article 47 of the HOL.<br />
The payment should be made monthly by the operating firm, and if applicable, made at the same moment<br />
the royalty is paid under the special advantage condition. By “special advantage condition” the law means<br />
the right that the tax payer holds to deduct the amount of royalty from the Extraction Tax total.<br />
The tax payer holds the right to deduct any special advantage that might be paid annually from the<br />
Extraction Tax total, but only on periods subsequent to the payment of that yearly special advantage.<br />
In practice, this tax amounts to an additional royalty of 3.33 percent that PDVSA and Orinoco´s Belt projects<br />
should pay. This tax might not apply if the sum of royalty plus taxes and one percentage point of utilities<br />
destined to investments were larger than the total value of extracted hydrocarbons that year.<br />
Export Registry Tax (HOL, article 48)<br />
This tax applies to 0.1 percent of the exported hydrocarbons value.<br />
For this matter, the exporter should report to the Ministry of Popular Power for Oil and Mining the volume,<br />
API grade and sulfur content of the shipment.<br />
Special Tax Over Extraordinary Or Exorbitant Oil<br />
Conditional tax applied over the gap between international oil market prices and prices estimated by the<br />
Annual Budget Law.<br />
Market Prices<br />
At the $80 to $100 range, a tax rate of 80 percent will be applied to the difference between $80<br />
and the observed price.<br />
At the $100 to $110 range, a tax rate of 90 percent will be applied to the difference between $100<br />
and the observed price, in addition to the contributions described before.<br />
Prices over $110, a tax rate of 95 percent will be applied to the difference between $110 and the observed<br />
price, in addition to the contributions described before.<br />
A tax rate of 20 percent will be applied to the difference between the oil price established in the Annual<br />
Budget Law and $80.<br />
Royalties, extraction or registry taxes apply up to $80.<br />
Taxes collected this way are to be deposited in the National Development Fund (FONDEN).<br />
10
Analysis of the Law of Special<br />
Contribution over Extraordinary<br />
and Exorbitant Prices in the<br />
International Oil Market<br />
On February 20, 2013 the Parliament approved the Law Reform of Special Contribution, which reduces<br />
the tax burden on the oil sector and redirects resources to the budget, that under the current law are<br />
intended to National Development Fund (FONDEN). Under the new law, for prices above $80 and<br />
less than 100, the law provides the collection of an 80 percent tax rate on the difference between the<br />
observed price and $80. For prices equal to or greater than $100 and less than 110, the rate is 90 percent on the<br />
difference between the observed price and $100, and adds the rate of 80 percent of the difference between<br />
80 and 100 dollars ($16). For prices at or above $110 the rate applied will be of 95 percent on the difference<br />
between the observed price and $110 and is added the rate of 90 percent of the difference between 100 and 110<br />
dollars ($ 9) and the 80 percent of the difference between 80 and 100 dollars ($ 16). The additional aliquot of<br />
20 percent is now applied to the difference between the price provided in the annual budget law and $ 80.<br />
LAW OF SPECIAL CONTRIBUTION: ALIQUOTS AND OIL PRICES<br />
20% 80% 90% 95%<br />
Law 2011<br />
Reform 2013<br />
Between the budget<br />
price and $70<br />
Between the budget<br />
price and $80<br />
Between $70 and $90 Between $90 and $100 Over $100<br />
Between $80 and $100 Between $100 and $110 Over $110<br />
11
What impact will this reform have on the state’s<br />
share in the oil revenue and the operating companies’<br />
profits? How will the distribution of<br />
income between the budget and the FONDEN be<br />
affected? Taking the current estimated price in the<br />
budget (U.S. $ 55) and a cost index based on the price<br />
per barrel, we proceed to answer these questions..<br />
means least 1.7 billion dollars a year in contributions<br />
to the state (assuming each barrel exported sells for $<br />
100). The government hopes to offset the reduction<br />
in two ways: (1) with the recent devaluation of the<br />
bolívar will receive 46.5 percent more in bolivars for<br />
each barrel and (2) the increase in profits for manufacturers<br />
is expected to lead to increased production.<br />
Using prices of U.S. $ 100 per barrel, the new law implies<br />
a reduction of state involvement in the sector’s<br />
net income (government take) of 2.4 percentage<br />
points: 83.4 to 81 percent. At this price the contribution<br />
to the State becomes $ 62.28 per barrel, instead<br />
of 64.11 under the old law. Taking 2011 exports (the<br />
latest official figure available), reduced participation<br />
GOVERNMENT TAKE <strong>IN</strong> OIL REVENUE (PERCENTAGES)<br />
Effective Tax Rate (Net Income) = Percentage of net income that accrues to the State<br />
100<br />
2011 LAW<br />
PERCENTAGE<br />
90<br />
80<br />
2013 LAW<br />
Source: Authors’ calculations based on the<br />
Official Gazette of the Bolivarian Republic<br />
of Venezuela No. 40,114 dated February<br />
20, 2013<br />
70<br />
30 40 50 60 70 80 90 100 110 120 130 140 150 160 170 180<br />
PRICE US$/BBL<br />
The reduction of government take has its equivalent in increasing the utility of the producers. The utility,<br />
defined as net income over costs (including taxes), increased by two percentage points: 15 to 17 percent.<br />
Net income increased by $ 1.83 per barrel (from 12.78 to 14.61), again assuming a price of $ 100. With this<br />
increase in the operating companies’ profits, the government expects to alleviate the cash flow of Petróleos<br />
de Venezuela (PDVSA) and break the lethargy that characterizes current efforts to increase production.<br />
While certainly healthy for PDVSA and welcomed by the partner companies, the increase is unlikely<br />
to be considered satisfactory, if we take into account the country risk and political uncertainty. It is difficult<br />
to see a significant increase in production if this reform is not complemented with other changes in how oil<br />
policy is conducted.<br />
OPERAT<strong>IN</strong>G COMPANIES’ NET <strong>IN</strong>COME (PERCENTAGES)<br />
25<br />
20<br />
PERCENTAGE<br />
15<br />
10<br />
2011 LAW<br />
2013 LAW<br />
Source: Authors’ calculations based on the<br />
Official Gazette of the Bolivarian Republic<br />
of Venezuela No. 40,114 dated February<br />
20, 2013<br />
5<br />
12<br />
0<br />
30 40 50 60 70 80 90 100 110 120 130 140 150 160 170 180<br />
PRICE US$/BBL
An important aspect of the reform is the change in income distribution between the budget and the<br />
FONDEN. The revenues directed to the budget increases it in two ways: (1) increasing the ceiling for<br />
calculation of royalties from 70 to $ 80 results in an additional $ 3.3 per barrel that go to the budget and<br />
(2) by rolling the segments on which the tax applies at extraordinary prices and exorbitant increases the<br />
income tax (increase partially offset by the additional royalty). At $ 100 per barrel, the reform increases the<br />
amount directed to the budget by $ 5.17 per barrel: an increase of 14.3 percent compared to previous law.<br />
FONDEN, on the other hand, receives $ 7 less per barrel, which is equivalent to a reduction of 25<br />
percent. This means that a greater proportion of the contributions to the nation will go to the<br />
budget. This is one of the most important aspects of the reform, as the budget, with all its<br />
imperfections, it tends to be more transparent than the use of extra-budgetary funds. At a price of $ 100<br />
per barrel, the percentage of oil contributions that are diverted to FONDEN is reduced from 42<br />
to 32 percent.<br />
CONTRIBUTIONS TO THE NATIONAL DEVELOPMENT FUND (PERCENTAGES)<br />
Percentage deposited into Fonden<br />
80<br />
70<br />
60<br />
2011 LAW<br />
PERCENTAGE<br />
50<br />
40<br />
30<br />
2013 LAW<br />
Source: Authors’ calculations based on the<br />
Official Gazette of the Bolivarian Republic<br />
of Venezuela No. 40,114 dated February<br />
20, 2013<br />
20<br />
10<br />
0<br />
30 40 50 60 70 80 90 100 110 120 130 140 150 160 170 180<br />
PRICE US$/BBL<br />
The reform reduces the tax burden on mixed enterprises while the proportion of contributions directed<br />
to the budget increases. In this sense, the reform should be applauded. But the reform falls far short in<br />
other ways. First, while progressive at higher prices, the law remains regressive at low prices: with a significant<br />
price decrease, some projects become unviable. Second, taking into account the short-term increase<br />
in operating costs that often accompany significant price increases, the new rates are still excessive, especially<br />
considering Venezuela’s country risk and the current political uncertainty. Third, the reform defines<br />
extraordinary prices according to the price set annually in the budget law, so it does not address the<br />
uncertainty as to the actual tax rate. This necessarily limits the potentially positive impact on investment.<br />
The proposed reform goes in the right direction, but it falls short. If not accompanied by a policy change<br />
that generates the necessary certainty to partners to advance the large investments required, it is<br />
difficult to see how this law translates into better perspectives for the sector. Finally, although the proportion<br />
of resources going to FONDEN has decreased, it is still a significant percentage. Taking into account PDVSA’s<br />
social spending observed in recent years, more than half of the contributions to the nation continue to be<br />
managed on a discretionary basis by the Executive. This is contrary to the transparency and accountability<br />
that should characterize the use of oil resources.<br />
13
OIL PRICES<br />
MONTHLY PRICES OF THE <strong>VENEZUELA</strong>N OIL BASKET, 1999-2012<br />
(DOLLARS PER BARREL, CURRENT DOLLARS)<br />
140<br />
120<br />
100<br />
80<br />
60<br />
40<br />
20<br />
0<br />
JAN-99<br />
AUG-99<br />
MAR-00<br />
OCT-00<br />
MAY-01<br />
DEC-01<br />
JUL-02<br />
FEB-03<br />
SEP-03<br />
APR-04<br />
NOV-04<br />
JUN-05<br />
JAN-06<br />
AUG-06<br />
MAR-07<br />
OCT-07<br />
MAY-08<br />
DEC-08<br />
JUL-09<br />
FEB-10<br />
SEP-10<br />
APR-11<br />
NOV-11<br />
JUN-12<br />
JAN-13<br />
Fuente: Ministry of Popular Power for<br />
Oil and Mining.<br />
Note: Venezuela Oil Basket corresponds<br />
to the price of the crude Tía Juana.<br />
14
During 2012, the average price of the Venezuelan oil basket was $ 103.42, still above $ 100 per barrel during<br />
the first two quarters ($ 111.99 and $ 103.47 respectively), however, nearing $ 98 for the third and fourth quarter<br />
($ 98.97 and $ 98.32 respectively).<br />
AVERAGE VALUES OF OIL PRICES, 2007-2012<br />
Year WTI OPEC Basket Price Venezuelan Basket Price<br />
2007 72.24 69.08 64.74<br />
2008 99.90 94.45 86.49<br />
2009 61.82 61.06 57.08<br />
2010 79.52 77.45 71.97<br />
2011 95.12 107.47 101.06<br />
2012* 94.23 109.53 103.42<br />
Source: Ministry of Popular Power for Oil<br />
and Mining. 2012 * Preliminary figures.<br />
15
According to PDVSA<br />
Management Report 2012,<br />
proven oil reserves stood at 297.7<br />
billion barrels in 2012<br />
EXPLORATION AND PRODUCTION<br />
Reserves 2012<br />
In accordance with official figures, Venezuela’s oil reserves are the largest in America and<br />
worldwide. According to PDVSA Management Report 2012, proven oil reserves stood at 297.7 billion<br />
barrels in 2012, 123 million barrels higher than 2011 due to the addition of 13 new archaeological<br />
discoveries. This represents 54 percent of the oil reserves in the Americas and 18 percent of the world’s reserves.<br />
OIL RESERVES <strong>IN</strong> <strong>VENEZUELA</strong> ARE DISTRIBUTED AS FOLLOWS:<br />
BAS<strong>IN</strong><br />
RESERVES (MMB)<br />
Maracaibo-Falcón 19.986<br />
Barinas-Apure: 1.191<br />
Oriental 276.156 5<br />
Carúpano 402<br />
5<br />
258,809 MMB correspond to the<br />
reserves of the Orinoco Oil Belt, of which<br />
3,935 are heavy oil reserves and 254,874<br />
MMB are extra heavy crude.<br />
Source: BP Statistical Review of World<br />
Energy 2013 and Informe de Gestión<br />
Anual.<br />
Note 1: The World Total and America´s<br />
reserves figures correspond to BP<br />
Statistical Review of World Energy 2013.<br />
Note 2: PDVSA assumes a recovery<br />
factor of 20 percent as a minimum<br />
recovery value.<br />
1.800<br />
1.600<br />
1.400<br />
1.200<br />
1.000<br />
800<br />
600<br />
400<br />
200<br />
0<br />
1668.9<br />
OIL RESERVES, 2012<br />
(BILLION BARRELS)<br />
548<br />
WORLD NORTH & SOUTH AMERICA <strong>VENEZUELA</strong><br />
258 39<br />
Exploration costs, mainly geophysical<br />
expenses, increased by approximately 202<br />
percent from 163 million dollars in 2011<br />
to 492 million in 2012.<br />
16<br />
CONVENTIONAL CRUDES<br />
HEAVY & EXTRA-HEAVY CRUDES
EXPLORATION AND PRODUCTION<br />
PRODUCTION <strong>IN</strong> 2012 ACCORD<strong>IN</strong>G<br />
TO <strong>IN</strong>TERNATIONAL SOURCES<br />
According to the monthly report of May 2013<br />
of the Organization of Petroleum Exporting<br />
Countries (OPEC) Venezuela´s oil production in<br />
2012 was 2.360 million barrels per day, about 8<br />
percent lower than in 2008. This level of<br />
production, according to OPEC, takes into<br />
account the amount of conventional crude oil<br />
production and the production of extra-heavy crude<br />
from the Orinoco Belt, once upgraded. This figure<br />
does not include condensed liquids nor natural gas<br />
liquids. This explains in part the difference with other<br />
international sources such as BP and official sources,<br />
both of which consolidate all production in one figure.<br />
<strong>VENEZUELA</strong>N MONTHLY OIL PRODUCTION<br />
ACCORD<strong>IN</strong>G TO OPEC, DECEMBER<br />
2001-DECEMBER 2012<br />
According to BP Statistical Yearbook 2013,<br />
Venezuela’s oil production was 2.725 million<br />
barrels per day in 2012, the associated liquids include<br />
crude oil and natural gas. That level of production<br />
represents approximately 12 percent of the<br />
continent’s production and 3 percent of world<br />
production.<br />
Relative to the magnitudes reached towards the end<br />
of the last decade, there has been a downward trend<br />
in the last nine years. Production has fallen by about<br />
13 percent from its value in the year 1999 compared<br />
to 2012.<br />
<strong>VENEZUELA</strong>N MONTHLY OIL PRODUCTION ACCORD<strong>IN</strong>G TO OPEC, DECEMBER 2001-DECEMBER 2012<br />
3500<br />
3000<br />
THOUSANDS BARRELS DAILY<br />
2500<br />
2000<br />
1500<br />
1000<br />
500<br />
0<br />
3800<br />
3600<br />
3400<br />
3200<br />
3000<br />
2800<br />
2600<br />
2400<br />
2200<br />
2000<br />
1800<br />
1600<br />
1400<br />
1200<br />
1000<br />
800<br />
600<br />
400<br />
200<br />
0<br />
300<br />
250<br />
200<br />
150<br />
100<br />
50<br />
0<br />
1980<br />
1982<br />
1984<br />
1986<br />
1988<br />
1990<br />
1992<br />
1994<br />
1996<br />
JAN-01<br />
1998<br />
JUL-01<br />
PRODUCTION AND CRUDE OIL RESERVES <strong>IN</strong> <strong>VENEZUELA</strong>, 1980-2012<br />
2000<br />
JAN-02<br />
2002<br />
JUL-02<br />
Source: OPEC´s Monthly Oil Market<br />
Report, April 2013<br />
Note: This does not include production<br />
equivalent to liquid condensates and<br />
natural gas liquids.<br />
2004<br />
2006<br />
JAN-03<br />
2008<br />
2010<br />
2012<br />
JUL-03<br />
JAN-04<br />
JUL-04<br />
JAN-05<br />
JUL-05<br />
JAN-06<br />
JUL-06<br />
JAN-07<br />
JUL-07<br />
JAN-08<br />
JUL-08<br />
JAN-09<br />
JUL09<br />
JAN-10<br />
JUL-10<br />
JAN-11<br />
JUL-11<br />
JAN-12<br />
JUL-12<br />
JAN-13<br />
OIL PRODUCTION<br />
PRODUCTION (THOUSANDS BARRELS DAILY)<br />
RESERVES (BILLION OF BARRELLS)<br />
Source: BP Statistical Review<br />
of World Energy 2013.<br />
Note: Oil production includes crudes,<br />
shale oil, oil sands and natural gas liquids;<br />
excluding liquid fuels and energy sources<br />
like biomass or coal derivatives.<br />
RESERVES BILLIONS OF BARRELLS<br />
PRODUCTION THOUSANDS BD<br />
17
PDVSA: PRODUCTION, CONSUMPTION AND OIL RESERVES <strong>IN</strong> <strong>VENEZUELA</strong>, 1980-2012<br />
According to official figures, the production was 2.91 million barrels per day in 2012,<br />
representing a decrease of 2.7 percent from 2011, when production was 2.99 million barrels per day.<br />
With respect to consumption, PDVSA reported for 2012 a total of 681 thousand barrels per day.<br />
In 2011, PDVSA’s operating expenses were U.S. $ 14.555 million, an increase of 58 percent over 2012, when they<br />
were 23.014 million dollars. This increase relates primarily to the costs of Welfare, Labor and Benefit of workers.<br />
PDVSA PRODUCTION, DOMESTIC CONSUMPTION AND CONVENTIONAL OIL RESERVES <strong>IN</strong> <strong>VENEZUELA</strong>, 1980-2012<br />
THOUSANDS BARRELS DAILY<br />
3500<br />
3000<br />
2500<br />
2000<br />
1500<br />
1000<br />
300<br />
250<br />
200<br />
150<br />
100<br />
Source: PODE until 2008, Informe<br />
Operacional y Financiero de Pdvsa (2009),<br />
Informe de Gestión PDVSA 2010; Informe<br />
de Gestión PDVSA 2011 and Informe<br />
de Gestión PDVSA 2012.<br />
Note 1: Reserve level includes conventional<br />
and heavy-weight crudes certified until<br />
2007. They were estimated considering<br />
a 20 percent recovery rate.<br />
Note 2: Data includes natural gas<br />
condensates and heavy-weight crudes<br />
destined to Orimulsion.<br />
500<br />
50<br />
0<br />
1980<br />
1981<br />
1982<br />
1983<br />
1984<br />
1985<br />
1986<br />
1987<br />
1988<br />
1989<br />
1990<br />
1991<br />
1992<br />
1993<br />
1994<br />
1995<br />
1996<br />
1997<br />
1998<br />
1999<br />
2000<br />
2001<br />
2002<br />
2003<br />
2004<br />
2005<br />
2006<br />
2007<br />
2008<br />
2009<br />
2010<br />
2011<br />
2012<br />
0<br />
RESERVES MMMB PRODUCTION MBD CONSUMPTION MBD<br />
<strong>IN</strong>VESTMENT<br />
In 2012 investments in the oil industry increased<br />
by 47 percent relative to 2011, rising from 17.5<br />
billion dollars to 24.6. In 2012 the investments were<br />
concentrated in the area of oil exploration and<br />
production with an investment of approximately<br />
U.S. $ 12.48 billion. There was a decrease<br />
in investment in non-oil sectors of 51 percent,<br />
declining from 1.46 billion dollars to 0.715<br />
billion. However, investments in “Other” areas<br />
increased by 86 percent, resulting in the<br />
percentage share of total investments exceeding<br />
the sum of investments in refining, trading and<br />
supply, gas and food and consumer goods / non-oil<br />
subsidiaries.<br />
8<br />
3<br />
11<br />
27<br />
<strong>IN</strong>VESTMENT BY SECTOR <strong>IN</strong> 2012<br />
EXPLORATION AND PRODUCTION<br />
%<br />
REF<strong>IN</strong>N<strong>IN</strong>G, COMMERCIALIZ<strong>IN</strong>G AND SUPPLY<br />
GAS<br />
FOOD AND MASSIVE CONSUMPTION<br />
PRODUCTS/AFFILIATES UNRELATED TO OIL<br />
OTHERS<br />
51<br />
Source: Informe de Gestión<br />
PDVSA 2012.<br />
19
Another indicator that illustrates the approximate size of the investment in exploration and production<br />
of hydrocarbons is the number of active rigs. The number of rigs and the amount of production generally<br />
move in the same direction, when the number of rigs increases or decreases, production tends to increase<br />
or decrease accordingly, albeit more slowly.<br />
Between 2005 and 2008, activation and removal of this equipment was relatively volatile: the number of rigs<br />
in operation ranged from 63 to 84. By December 2009 the teams were reduced to 49, however, in the course<br />
of 2010 drilling activity recovered closing in December 2010 with 83 rigs in activity, decreasing again during<br />
the last quarter of 2011, closing the year with a figure of 69 teams throughout the month of December. Until<br />
November 2012 the number of active rigs ranged between 68 and 87, decreasing to 63 in December of that<br />
year.<br />
OPERATIVE OIL AND GAS RIGS, JANUARY 1995 - APRIL 2013 (UNITS)<br />
140<br />
120<br />
100<br />
80<br />
60<br />
GAS<br />
OIL<br />
TOTAL<br />
Source: Baker Hughes International<br />
Rig Count.<br />
40<br />
20<br />
0<br />
OPERATIVE RIGS AND OIL PRODUCTION DECEMBER 2001 – DECEMBER 2012<br />
3500<br />
3000<br />
2500<br />
2000<br />
1500<br />
1000<br />
500<br />
0<br />
100<br />
90<br />
80<br />
70<br />
60<br />
50<br />
40<br />
30<br />
20<br />
10<br />
0<br />
JAN-01<br />
JUL-01<br />
JAN-02<br />
JUL-02<br />
JAN-03<br />
JUL-03<br />
JAN-04<br />
JUL-04<br />
JAN-05<br />
JUL-05<br />
JAN-06<br />
JUL-06<br />
JAN-07<br />
JUL-07<br />
JAN-08<br />
JUL-08<br />
JAN-09<br />
JUL-09<br />
JAN-10<br />
JUL-10<br />
JAN-11<br />
JUL-11<br />
JAN-12<br />
JUL-12<br />
JAN-13<br />
JAN-95<br />
JUL-95<br />
JAN-96<br />
JUL-96<br />
JAN-97<br />
JUL-97<br />
JAN-98<br />
JUL-98<br />
JAN-99<br />
JUL-99<br />
JAN-00<br />
JUL-00<br />
JAN-01<br />
JUL-01<br />
JAN-02<br />
JUL-02<br />
JAN-03<br />
JUL-03<br />
JAN-04<br />
JUL-04<br />
JAN-05<br />
JUL-05<br />
JAN-06<br />
JUL-06<br />
JAN-07<br />
JUL-07<br />
JAN-08<br />
JUL-08<br />
JAN-09<br />
JUL-09<br />
JAN-10<br />
JUL-10<br />
JAN-11<br />
JUL-11<br />
JAN-12<br />
THOUSANDSBARRELS DAILY<br />
OPERATIVE OIL RIGS<br />
Source: Baker Hughes International Rig<br />
Count and OPEC´s Monthy Report,<br />
January 2013<br />
OIL PRODUCTION<br />
OPERATIVE RIGS<br />
20
EXPLORATION AND PRODUCTION<br />
PDVSA and BP, Chevron, ConocoPhillips,<br />
ExxonMobil, Statoil and Total, started in the late<br />
nineties, the exploitation of extra-heavy crude with<br />
the establishment of strategic partnerships. These<br />
agreements represent an investment of about 17<br />
billion dollars, which allowed to reach an average<br />
production in 2006 of 560 thousand barrels per<br />
day. Strategic partnerships were developed with<br />
the aim of vertically integrating the business of<br />
heavy oil from the Orinoco Belt, to include not only<br />
mining activities but also upgrading plants to produce<br />
synthetic crude with higher API gravity, better traded<br />
in international markets. According to this scheme,<br />
the participation of PDVSA averaged forty percent<br />
and a majority stake was in the hands of private<br />
partners.<br />
3. Exploration projects<br />
Since 2007, the exploration activities projects,<br />
former exploration, risk and profit sharing<br />
agreements, are operating under the new<br />
contractual scheme of joint ventures.<br />
Reserves certification projects<br />
Orinoco Magna Reserve Project (In Spanish Proyecto<br />
Orinoco Magna Reserva) is part of the Plan Siembra<br />
Petrolera 2005-2030 and is intended to quantify<br />
and certify the hydrocarbon reserves in the Orinoco<br />
Oil Belt.<br />
The FPO has been divided into 30 blocks,<br />
nested according to their technical and strategic<br />
in four areas:<br />
• Boyaca, Junin, Ayacucho and Carabobo<br />
(excludes firms assigned area Petrocedeño, SA,<br />
Petromonagas, SA, Petrozuata, CA and Oil<br />
Sinovensa, SA).<br />
From these blocks, 22 will be quantified in a joint<br />
effort between the CVP and 28 foreign companies,<br />
mainly state.<br />
The rest of the blocks will be quantified with PDVSA’s<br />
own effort.<br />
Source: : Informe de Gestión Anual de<br />
PDVSA de 2012.<br />
23
EXPLORATION AND PRODUCTION<br />
Comprehensive Exploration Project<br />
This project aims at the discovery and incorporation of hydrocarbon reserves up to 8,045 MMB and 40,001<br />
million cubic feet of gas. The balance at 31 December 2012 of works in progress stood at $ 535 million.<br />
Consists of the following subprojects:<br />
Source: Informe de Gestión Anual<br />
de PDVSA 2012<br />
Project<br />
Estimated<br />
Oil Reserves<br />
(MBD)<br />
Estimated<br />
Gas Reserves<br />
(MMMPC)<br />
Expected Oil<br />
Wells<br />
Estimated<br />
investment<br />
(MMUSD)<br />
Project<br />
Completion<br />
(%)<br />
Period<br />
PIEX Fachada-Caribe 1798 15349 49 1343 4.40 2008-2021<br />
PIEX Golfo de Venezuela Falcón 1813 11187 18 541 26.12 2010-2021<br />
PIEX Anzoátegui Monagas<br />
Central Pantano<br />
1136 3379 22 611 4.40 2007-2021<br />
PIEX Norte Monagas Serranía 1242 4938 20 558 24.57 2007-2021<br />
PIEX Trend Anaco Guárico 195 1286 7 349 2.05 2009-2019<br />
PIEX Zulia Oriental Falcón 1075 1380 20 653 25.2 2007-2021<br />
PIEX Centro Sur Sur 376 347 12 264 26.6 2007-2020<br />
PIEX Centro Sur Norte 410 2135 25 478 18.4 2007-2018<br />
TOTAL 8045 40001 173 4707<br />
24
JO<strong>IN</strong>T VENTURES UNTIL 2012<br />
Dirección Oriente Joint Venture Date<br />
División Furrial<br />
Petroquiriquire<br />
Boquerón<br />
August 21,<br />
2006<br />
October 11,<br />
2006<br />
(%) PDVSA´s<br />
Share<br />
(%) Associated<br />
firm Share<br />
Minority<br />
shareholder<br />
60 40 REPSOL<br />
60<br />
26.67<br />
13.33<br />
Boquerón<br />
Holdings<br />
PEI<br />
Formerly<br />
known as<br />
Quiriquire<br />
Operative<br />
Agreement<br />
Boquerón<br />
Operative<br />
Agreement<br />
Petrowarao<br />
August 9,<br />
2006<br />
60 40 PERENCO<br />
Pedernales<br />
Operative<br />
Agreement<br />
División Costa<br />
Afuera<br />
Petrosucre<br />
Petrolera Paria<br />
December 19,<br />
2007<br />
December 19,<br />
2007<br />
74 26 ENI<br />
60<br />
32<br />
8<br />
S<strong>IN</strong>OPEC<br />
<strong>IN</strong>E Oil & Gas<br />
<strong>IN</strong>C<br />
Golfo de Paria<br />
Oeste<br />
(CoroCoro)<br />
Exploration and<br />
Shared Revenue<br />
Agreement<br />
Golfo de<br />
Paria Este (Posa)<br />
Exploration and<br />
Shared Revenue<br />
Agreement<br />
Petrolera Güiria<br />
January 10,<br />
2008<br />
64,25<br />
19.5<br />
16.25<br />
ENI<br />
<strong>IN</strong>E Oil & Gas<br />
<strong>IN</strong>C<br />
Golfo<br />
de Paria Central<br />
Exploration and<br />
Shared Revenue<br />
Agreement<br />
25
JO<strong>IN</strong>T VENTURES UNTIL 2012<br />
Dirección Faja Joint Venture Date<br />
Dvisión Junín<br />
División Carabobo<br />
División Ayacucho<br />
Petrolera<br />
Indovenezolana<br />
Petrocedeño<br />
Petroanzoátegui<br />
(%) PDVSA´s<br />
Share<br />
(%) Associated<br />
firm Share<br />
Minority<br />
shareholder<br />
April 8, 2008 60 40 ONGC<br />
December 11,<br />
2007<br />
February 21,<br />
2008<br />
60<br />
100<br />
30.32<br />
9.677<br />
Petromiranda* April 20, 2010 60 40<br />
Petromacareo*<br />
Petrourica*<br />
Petrojunín*<br />
Petrodelta<br />
Petrolera<br />
Sinovensa<br />
Petromonagas<br />
September 17,<br />
2010<br />
December 14,<br />
2010<br />
December 14,<br />
2010<br />
October 3,<br />
2007<br />
February 1,<br />
2008<br />
February 21,<br />
2008<br />
Petrocarabobo* June 25, 2010 60<br />
Petro<br />
independencia*<br />
Petrokariña<br />
Petroven-Bras<br />
Petroritupano<br />
Petronado<br />
Petrocuragua<br />
Petrozumano<br />
Petrolera Kaki<br />
Petrolera<br />
Vencupet*<br />
June 25, 2010 60<br />
August 31,<br />
2006<br />
September 4,<br />
2006<br />
September 4,<br />
2006<br />
September 15,<br />
2006<br />
October 18,<br />
2006<br />
November 6,<br />
2007<br />
November<br />
28, 2006<br />
December 3,<br />
2010<br />
Total<br />
StatoilHydro<br />
Consorcio<br />
Nacional<br />
Petrolero<br />
60 40 Petrovietnam<br />
60 40 CNPC<br />
60 40 ENI<br />
60 40 HRN<br />
64.25 35.75 CNPC<br />
83.33 16.67 BP<br />
60<br />
11<br />
11<br />
11<br />
7<br />
34<br />
5<br />
1<br />
29.2<br />
10.8<br />
REPSOL<br />
PC Venezuela<br />
Petro<br />
carabobo<br />
Ganga<br />
Indoil<br />
Netherlands<br />
B. V.<br />
Chevron<br />
Japan<br />
Carabobo Uk<br />
Suelopetrol<br />
PETROBRAS<br />
Inversora<br />
Mata<br />
60 40 PETROBRAS<br />
60<br />
60<br />
60<br />
22<br />
18<br />
26<br />
8.36<br />
5.64<br />
28<br />
12<br />
PETROBRAS<br />
Venezuela US<br />
CGC<br />
BPE<br />
KNOC<br />
CIP<br />
OPEN<br />
60 40 CNPC<br />
60 40 <strong>IN</strong>EMAKA<br />
60 40 CUPET<br />
Formerly<br />
known as<br />
Convenio<br />
operativo San<br />
Cristóbal<br />
Asociación<br />
estratégica<br />
Sincor<br />
Monagas Sur<br />
Operative<br />
Agreement<br />
Asociación<br />
estratégica Cerro<br />
Negro<br />
Mata Operative<br />
Agreement<br />
Acema<br />
Operative<br />
Agreement<br />
Oritupano-Leona<br />
Operative<br />
Agreement<br />
Casma-Anaco<br />
Operative<br />
Agreement<br />
Zumano<br />
Operative<br />
Agreement<br />
Kaki Operative<br />
Agreement<br />
Convenio<br />
operativo Kaki<br />
27
JO<strong>IN</strong>T VENTURES UNTIL 2012<br />
Dirección<br />
Faja (cont.)<br />
Joint Venture<br />
Date<br />
(%) PDVSA´s<br />
Share<br />
(%) Associated<br />
firm Share<br />
Minority<br />
shareholder<br />
Formerly<br />
known as<br />
Petrolera<br />
Sino-Venezolana<br />
November<br />
28, 2006<br />
75 25 CNPC<br />
Caracoles<br />
Operative<br />
Agreement<br />
División Ayacucho<br />
(cont.)<br />
Petrolera<br />
Bielovenezolana<br />
Petropiar<br />
December 14,<br />
2007<br />
December 19,<br />
2007<br />
60 40<br />
Unión de<br />
Empresas<br />
Productoras<br />
Belorusneft<br />
70 30 Chevron<br />
Guara Este<br />
Operative<br />
Agreement<br />
Ameriven<br />
Operative<br />
Agreement<br />
Petrolera<br />
Venangocupet**<br />
November<br />
26, 2012<br />
60 40<br />
Comercial<br />
Cupet, S. A.<br />
y Sonangol<br />
(46) Pesquisa<br />
& Producao,<br />
S. A.<br />
División Boyacá<br />
Petroguárico<br />
October 25,<br />
2006<br />
70 30 Teikoku<br />
Guárico Oriental<br />
Operative<br />
Agreement<br />
Fuente: Informe de Gestión Anual<br />
de PDVSA 2012.<br />
**New Joint Venture mature field.<br />
28
REF<strong>IN</strong><strong>IN</strong>G<br />
Venezuela´s global refining capacity (domestic and offshore) at the end of 2012 was 2.822 million barrels<br />
per day. Of this, the refineries located in the country have the capacity to process 1.3 millions barrels per day.<br />
The rest of the refinery capacity is located in the Caribbean, Europe and the United States, which have<br />
a total capacity of 469 thousand barrels per day, 67 and 1.428 million barrels per day, respectively.<br />
REF<strong>IN</strong>ERÍA<br />
REF<strong>IN</strong><strong>IN</strong>G CAPACITY<br />
(THOUSAND BD)<br />
LOCATION<br />
Centro de Refinación de Paraguaná CRP (Refinerías Amuay<br />
y Cardón)<br />
955 Falcón<br />
Puerto La Cruz 187 Anzoátegui<br />
DOMESTIC<br />
El Palito 140 Carabobo<br />
Bajo Grande 16 Zulia<br />
San Roque 5 Anzoátegui<br />
Total nacional 1,303<br />
Offshore 10 Isla| 335 Curazao<br />
Camilo Cienfuegos 32 Cuba<br />
Jamaica 17 Jamaica<br />
Haina<br />
República<br />
17<br />
Dominicana<br />
Lake Charles 425 Estados Unidos<br />
Corpus Christi 157 Estados Unidos<br />
Lemont 167 Estados Unidos<br />
Chalmette 92 Estados Unidos<br />
Saint Croix 248 Estados Unidos<br />
Nynashamn 15 Suecia<br />
Gothenburg 5 Suecia<br />
Dundee 4 Escocia<br />
Eastham 5 Inglaterra<br />
Total offshore 1.519<br />
PDVSA’s total refining capacity 2.822<br />
PDVSA REF<strong>IN</strong><strong>IN</strong>G CAPACITY 2012<br />
(PERCENTAGES OF TOTAL REF<strong>IN</strong><strong>IN</strong>G)<br />
1<br />
46<br />
39<br />
%<br />
<strong>VENEZUELA</strong><br />
UNITED STATES<br />
CARIBBEAN<br />
EUROPA<br />
10<br />
Includes only PDVSA’s net share.<br />
Source: Informe de Gestión Anual<br />
de PDVSA de 2012.<br />
14<br />
29
REF<strong>IN</strong><strong>IN</strong>G<br />
Refineries outside Venezuela, 2012<br />
Source: Informe Operacional<br />
y Financiero PDVSA 2012.<br />
Refineries Location Company<br />
Refinning<br />
Capacity<br />
(MBD)<br />
PDVSA Refinning<br />
Capacity (MBD)<br />
Lake Charles United States CITGO 425 425 100%<br />
Corpus Christi United States CITGO 157 157 100%<br />
Lemont United States CITGO 167 167 100%<br />
Chalmette<br />
United States<br />
Chalmette<br />
Refining (2) 184 92 50%<br />
Saint Croix United States Hovensa (3) 495 248 50%<br />
Camilo<br />
Cienfuegos<br />
Cuba CUVENPETROL 65 32 49%<br />
Jamaica Jamaica Petrojam 35 17 49%<br />
Isla Curazao PDVSA 335 335 100%<br />
Haina Dominican Republic<br />
Refidomsa<br />
PDVSA<br />
34 17 49%<br />
Dundee Scotland Nynas 9 4 50%<br />
Eastham Inglaterra Nynas 18 5 25%<br />
Nynashamn Sweden Nynas 29 15 50%<br />
Gothenburg Sweden Nynas 11 5 50%<br />
Share<br />
30
Oil volume processed and inputs for processes and mixtures<br />
2011 – 2012<br />
National Refining<br />
Centro<br />
de Refinación Paraguaná<br />
(CRP)<br />
Refinería Puerto<br />
La Cruz<br />
International Refining<br />
CITGO Petroleum<br />
Corporation*<br />
Processed Oil<br />
Volume - 2012<br />
(Thousands B/D)<br />
Processed Oil<br />
Volume (includes<br />
process and mixtures<br />
inputs) - 2012<br />
(Thousands B/D)<br />
Processed Oil<br />
Volume - 2011<br />
(Thousands B/D)<br />
Processed Oil<br />
Volume (includes<br />
process and mixtures<br />
inputs) - 2011<br />
(Thousands B/D)<br />
637 659<br />
Chalmette 133 131<br />
Process and<br />
Mixtures Inputs. -<br />
2012 (Thousands<br />
B/D)<br />
Process and<br />
Mixtures Inputs. -<br />
2012 (Thousands<br />
B/D)<br />
Process and Mixtures<br />
Inputs- 2011<br />
(Thousands B/D)<br />
638 699 103 78<br />
171 169 56 62<br />
Refinería El Palito 127 127 101 91<br />
Total 936 995 260 231<br />
Process and Mixtures<br />
Inputs- 2011<br />
(Thousands B/D)<br />
Source: Informe de Gestión Anual<br />
de PDVSA 2012 y 2011.<br />
* Lake Charles, Corpus Christi &<br />
Lemont refineries<br />
**Closed since february 2012<br />
***Dundee, Eastham, Nynashamn &<br />
Gothenburg refineries.<br />
Saint Croix ** 283<br />
Isla 165 164 11 6<br />
Camilo<br />
Cienfuegos<br />
55 55<br />
Jamaica 23.8 24.5<br />
Haina 24.6 26.2<br />
Nynas*** 55.7 56.6<br />
Total 1094.1 1399.3 11 6<br />
31
According to official figures,<br />
exports of oil and refined<br />
products of Venezuela<br />
reached 2.568 million barrels<br />
per day in 2012<br />
COMMERCIALIZATION<br />
According to official figures, exports of oil<br />
and refined products of Venezuela reached 2.568<br />
million barrels per day in 2012 to include:<br />
Raw: 2.060 million barrels per day<br />
Refined products and natural gas liquids:<br />
508 thousand barrels per day<br />
Of the total exports were commercialized by<br />
region:<br />
North America: 1.002 million barrels per day<br />
Central America and the Caribbean: 564 thousand<br />
barrels per day<br />
Asia: 924 thousand barrels per day<br />
Europe: 156 thousand barrels per day<br />
South America: 73 thousand barrels per day<br />
Africa: 21 thousand barrels per day<br />
Other: 13 thousand barrels per day<br />
6 grados API.<br />
EXPORTS BY REGION 2006-2012 (THOUSANDS B/D)<br />
NORTH AMERICA (ST. CROIX <strong>IN</strong>CLUDED)<br />
CENTRAL AMERICA & THE CARIBBEAN<br />
ASIA<br />
EUROPE<br />
SOUTH AMERICA<br />
Sources: Informe Operacional Financiero<br />
de PDVSA 2007 & Informe de Gestión<br />
Anual de PDVSA 2008, 2009, 2010,<br />
2011 y 2012.<br />
AFRICA<br />
OTHERS<br />
0 200 400 600 800 1000 1200 1400 1600 1800<br />
32<br />
2012 2011 2010 2009 2008 2007 2006
COMMERCIALIZATION<br />
EXPORTS CLASSIFIED BY PRODUCT 2005-2012 (THOUSANDS B/D)<br />
Product 2012 2011 2010 2009 2008 2007 2006 2005<br />
Gasoline & nafta 30 46 49 48 69 80 95 87<br />
Destillates 43 64 63 108 104 133 140 162<br />
Residual fuel oil 258 268 215 297 227 160 174 189<br />
Asphalt 5 1 0,3 1 0 10 16 20<br />
Kerosene/Turbo fuels/Jet 57 66 59 59 64 59 58 60<br />
Others 40 33 43 33 61 74 82 60<br />
Source: Informe de Gestión Anual<br />
de PDVSA de 2012.<br />
33
In 2012<br />
Oil Exports accounted for 96 percent<br />
of total Venezuelan exports<br />
FISCAL POLICY AND THE OIL SECTOR<br />
In 2012 oil exports accounted for 96 percent of the total value of exports of Venezuela. The total oil exports<br />
in 2012 were higher than 2011 by 5.7 percent increase. Oil exports resulted in a contribution to the nation of U.S.<br />
$ 29,020 million (tax and nontax), falling about 47 percent from the previous year. These contributions were<br />
U.S. $ 19,995 million in taxes, U.S. $ 8,311 million to FONDEN and U.S. $ 9,025 million were allocated to social<br />
development programs.<br />
<strong>VENEZUELA</strong>N OIL EXPORTS 1997-2012 (MILLIONS US$)<br />
100000<br />
90000<br />
80000<br />
70000<br />
60000<br />
50000<br />
40000<br />
30000<br />
20000<br />
10000<br />
0<br />
120%<br />
100%<br />
80%<br />
60%<br />
40%<br />
20%<br />
0%<br />
OIL EXPORTS<br />
% OF TOTAL EXPORTS<br />
1997<br />
1998<br />
1999<br />
2000<br />
2001<br />
2002<br />
2003<br />
2004<br />
2005<br />
2006<br />
2007<br />
2008<br />
2009<br />
2010<br />
2011<br />
2012<br />
Source: BCV e Informe de Gestión Anual<br />
de PDVSA 2012.<br />
9<br />
According to the new Operacional<br />
y Financiero de PDVSA sólo hubo aportes<br />
al Fonden en los años 2007- 2011.<br />
34<br />
PDVSA’s social spending and contributions to<br />
FONDEN according to official figures increased<br />
steadily over the period 2004 - 2008, fell by 62<br />
percent in 2009, reaching the historical peak in 2011<br />
exceeding US$ 35 billion, to represent 17,336 during<br />
2012, the year in which decreased by 51 percent.<br />
Moreover, its share as a proportion of GDP, fluctuated<br />
from 1.12 percent in 2004, 7.52 percent in 2006,<br />
1.08 percent of total GDP in 2009 and reached<br />
a record to be 8.57 percent of GDP in 2010,<br />
subsequently reduced to 6 percent for 2011<br />
and 2012.
PDVSA’S CONTRIBUTIONS TO THE NATION BY TYPE<br />
40000<br />
35000<br />
30000<br />
25000<br />
20000<br />
FONDEN<br />
SOCIAL DEVELOPMENT PROGRAMS<br />
TAXES<br />
15000<br />
10000<br />
5000<br />
0<br />
2012 2011 2010 2009 2008 2007 2006<br />
Source: Informe sobre la gestión<br />
y resultados de PDVSA 2012.<br />
PDVSA: F<strong>IN</strong>ANCIAL <strong>IN</strong>FORMATION 2005 - 2012 (MILLIONS USD)<br />
2005 2006* 2007 2008 2009 2010 2011 2012<br />
Sales 82.915 99.252 96.242 125.499 73.819 94.929 124.754 121.480<br />
Income on refinery selling - 1.432 - 998 - -<br />
Asset share in afilliates net profits 1.074 1.120 732 -153 139 184 278 -64<br />
Crudes and products purchases 32.001 38.778 28.137 44.600 25.392 34.017 39.783 40.012<br />
Operative Costs** 14.152 14.879 15.112 16.581 15.482 12.039 14.718 23.014<br />
Expenses*** 5.487 5.824 6.720 10.192 10.736 9.766 10.690 11.183<br />
Net Financial Expenses n/d n/d n/d 200 -5.038 8.391 2.884 249<br />
Minority Interests 14 458 902 1.962 1.474 n/d n/d n/d<br />
Royalties and other taxes 13.318 18.435 21.981 23.371 12.884 13.904 17.671 17.730<br />
Social Development Spending 6.909 13.784 14.102 14.733 3.514 7.018 30.079 17.336<br />
Income Tax 5.793 4.031 5.017 4.280 3.310 3.849 2.007 7.279<br />
Income from discontinued<br />
operations, net of taxes<br />
154 20 101 57 -234 n/d 1.353<br />
Loses from discontinued<br />
operations, net of taxes<br />
n/d n/d n/d -655 -1.274 -558 n/d<br />
Net Income 4.335 3.212 4.809 9.413 4.498 3.164 4.496 4.215<br />
Source: Informe Operacional y Financiero<br />
PDVSA 2012.<br />
* Source: I: Información Financiera y<br />
Operacional de PDVSA y sus filiales,<br />
until 12/31/2007.<br />
*** Includes exploration costs<br />
***Depreciation and Amortization , plus<br />
administrative expenses, plus financial<br />
expenses plus other expenses.<br />
35
PDVSA´S SOCIAL CONTRIBUTIONS 2007-2012<br />
(AS PERCENTAGES OF TOTAL CONTRIBUTIONS TO THE NATION)<br />
40%<br />
35%<br />
30%<br />
25%<br />
SOCIAL PROGRAMS<br />
FONDEN<br />
20%<br />
15%<br />
10%<br />
Source: Informe de Gestión Anual<br />
de PDVSA 2012.<br />
5%<br />
0%<br />
2006 2007 2008 2009 2010 2011 2012<br />
Sales in 2012 were reduced from 124.754 million dollars in 2011 to 121,480 million in 2012 reflecting a decrease<br />
of 2.6 percent. In the case of royalties and other taxes there was an increase of 0.035 percent from 17,671<br />
million dollars in 2011 to 17,730 million in 2012. Moreover, the income tax reflected an increase of 263 percent<br />
over the same period. The social development spending fell from 30,079 million in 2011 to 17,366 million in 2012.<br />
Investment Plan: Siembra Petrolera<br />
PDVSA announced in 2005 the Siembra Petrolera<br />
Plan 2005-2012, proposing the use of oil resources<br />
to enhance the energy production capacity of<br />
Venezuela. According to the plan, oil production<br />
by the end of 2012 should have almost doubled<br />
reaching 5.837 million barrels a day.<br />
That said production declined 11% in that period.<br />
In PDVSA´s Annual Report for 2012, a new Siembra<br />
Petrolera Plan for 2012 to 2019 was announced.<br />
Goals for the Year 2019<br />
• Increase the level of oil production to 6 million<br />
barrels per day in 2019, of which 4 millions barrels<br />
per day come from the Orinoco Oil Belt.<br />
• Increase production of natural gas to a volume<br />
of 11,947 million cubic feet, with a significant<br />
proportion coming from the gas belt of our<br />
territorial waters.<br />
• Increase production of Liquid Natural Gas to 255<br />
thousand barrels per day.<br />
• Raise the domestic refining capacity to 2.2<br />
thousand barrels per day and to 2.4 thousand<br />
barrels per day internatinally, for a total capacity<br />
of 4.6 thousand barrels per day.<br />
• Achieve a level of exports of crude and products<br />
of 5.6 thousand barrels per day.<br />
• Develop a systematic and sustainable industrial<br />
capacity for goods and services required by<br />
the hydrocarbon core activities.<br />
• Strengthen the national capacity to transport<br />
crude and products.<br />
Amounts and investment scheme<br />
PDVSA estimates that implementation of the<br />
Plan will require an investment of approximately<br />
U.S. $ 256,986 million in the period 2013-2019.<br />
Of that amount, PDVSA estimates about it will<br />
provide 81 percent; the remaining 19 percent will be<br />
contributed by the partners. Of the total<br />
investments, 74 percent will be invested in<br />
exploration and production, 9 percent will be<br />
invested in PDVSA Gas, 10 percent in Refining,<br />
2 percent in Trade and Supply, and the remaining<br />
5 percent in Other Organizations.<br />
36
<strong>IN</strong>VESTMENT DISBURSEMENTS (MM USD) 2012 - 2019<br />
45.000<br />
40.000<br />
35.000<br />
30.000<br />
20.000<br />
15.000<br />
10.000<br />
FOOD, MASSIVE CONSUMPTION GOODS,<br />
AFFILIATES UNRELATED TO OIL AND OTHERS<br />
COMMERCIALIZ<strong>IN</strong>G AND SUPPLY<br />
TOTAL REF<strong>IN</strong><strong>IN</strong>G<br />
ON-SHORE NATURAL GAS<br />
TOTAL EXPLORATION AND PRODUCTION<br />
5.000<br />
0<br />
2012 2013 2014 2015 2016 2017 2018 2019<br />
The disaggregated investment plan 2012-2019<br />
shows a significant increase in exploration and<br />
production until 2018, and a refining effort concentrated<br />
between 2014-2018. Investment in non-oil subsidiaries<br />
tends slow down, flattening out around 2014.<br />
It should be noted the abrupt reduction of detail<br />
in planned disbursements information with respect<br />
to the 2011 Management Report. In addition to<br />
reducing the categories, the intertemporal profile<br />
of investments changed considerably. Below is the<br />
graph for 2011.<br />
<strong>IN</strong>VESTMENT DISBURSEMENTS (MM USD) 2011 – 2018<br />
70.000<br />
60.000<br />
50.000<br />
40.000<br />
30.000<br />
20.000<br />
10.000<br />
0<br />
2011 2012 2013 2014 2015 2016 2017 2018<br />
AFFILIATES UNRELATED TO OIL AND OTHERS<br />
PSO<br />
COMMERCIALIZATION AND SUPPLY<br />
NEW REF<strong>IN</strong>ERIES<br />
CURRENT REF<strong>IN</strong><strong>IN</strong>G<br />
ON-SHORE NATURAL GAS<br />
JO<strong>IN</strong>T VENTURES PRODUCTION<br />
SELF PRODUCTION<br />
EXPLORATION<br />
Source: Informe de Gestión<br />
de PDVSA 2012.<br />
37
GAS SECTOR<br />
GAS <strong>FIGURES</strong> 2012<br />
Gas Reserves: 196.4 trillion cubic feet, of which 58.42 trillion cubic feet are associated with the Orinoco Oil<br />
Belt and 35.95 trillion cubic feet associated with extraheavy crude are present in Eastern and Barinas-Apure<br />
basins.<br />
Gas production: 7,327 million cubic feet per day, of which 2,871 are reinjected.<br />
Rate Reserves / Production: 61 years.<br />
Average price of gas in Venezuela 2012: $ 0.53 / MPC.<br />
Offshore exploration and exploitation projects:<br />
• Rafael Urdaneta Project (Falcón)<br />
• Plataforma Deltana Project<br />
• Liquefied Natural Gas Project<br />
• Golfo de Paria Oeste y Punta Pescador Project<br />
• Blanquilla-Tortuga Project<br />
On shore projects::<br />
• Anaco Gas Project<br />
• San Tomé Gas Project<br />
• Fractioning Capacity Increase in Jose<br />
• Soto Deep Extraction Plant<br />
• IV Train in San Joaquín<br />
• Pirital I<br />
• Handling and Disposal of CO ²<br />
• G/J José Francisco Bermúdez (S<strong>IN</strong>ORGAS) Northeastern Natural Gas Pipeline<br />
• Expansion of the Bajo Grande Ulé Amuay Transport System<br />
• Ulé Amuay Center-Eastern Pipe Interconnection Segment<br />
• National Gasification<br />
39
Gas Reserves:<br />
58.42 trillion cubic feets<br />
associated to the Orinoco<br />
Oil Belt<br />
LEGISLATIVE BODY-STATUTE OF THE <strong>VENEZUELA</strong>N<br />
NATURAL GAS SECTOR<br />
Constitution of the Bolivarian Republic of Venezuela, (CBRV, 1999)<br />
Mineral and hydrocarbon deposits of any nature that exist within the territory of the nation, beneath the<br />
territorial sea bed, within the exclusive economic zone and on the continental shelf, are the property<br />
of the Republic, are of public domain, and therefore inalienable and not transferable. (Article 12)<br />
The management and governance of hydrocarbons is of the competence of National Public Power.<br />
(Article 156, paragraph 16) Gas transportation and distribution are also considered public services under<br />
the responsibility of the National Executive (Article 156, paragraph 29)<br />
40<br />
Gaseous Hydrocarbons Law, (LOHG 1999).<br />
Regulates the exploration and exploitation of non-associated gas in the production of oil or other fossil<br />
fuels, and the collection, storage and use of associated gas and non-associated gas.<br />
It ratified the “legal reserve” of the activity and ownership of gaseous hydrocarbon deposits (Article 1).<br />
Exploration activities in search of gaseous hydrocarbon deposits unassociated and exploitation of such<br />
deposits, and the collection, storage and use of both non-associated natural gas from such exploitation,<br />
and the associated gas produced with the oil or other fossil processing, manufacturing, transportation,<br />
distribution, internal and external trade of these gases, are governed by this Act and may be exercised<br />
by the state directly or by entities owned or private persons foreign or domestic; with or without the<br />
participation of the State (Article 2).<br />
Activities directly or indirectly related to the transport and distribution of hydrocarbon gases, intended for<br />
collective consumption, constitute a public service (Article 5).<br />
The Ministry of Petroleum and Mining is empowered to determine the prices of hydrocarbon gases from<br />
the production and processing centers, following principles of equity. Fees will be set by the Ministries<br />
of Petroleum and Mining, and the Ministry of Industry and Trade, who shall determine the rates to be<br />
applied to final consumers and the services provided under this Act for establishing bases of such fees shall<br />
be developed by the National Gas Entity (Article 12).<br />
To perform activities (other than exploration and exploitation) related to gaseous hydrocarbons, associated<br />
or not associated, produced by other people, you must obtain permission from the Ministry of Petroleum<br />
and Mining, after project definition or specific destination of such hydrocarbons. Will be applied the<br />
provisions in Article 24 of this Law, except as indicated in paragraphs 3 and 4. These permits require prior
authorization from the Ministry of Petroleum and Mining for assignment and transfer (Article 27).<br />
Gaseous hydrocarbons industrialization activities can be made directly by the State, by entities owned by it<br />
or by domestic or foreign individuals, with or without the participation of the State (Article 30).<br />
A National Gas Entity is created, with functional autonomy under the Ministry of Petroleum and Mining, to<br />
promote sector development and competition in all phases of the hydrocarbon gas industry related to transport<br />
and distribution activities and to assist in the coordination and protection of such activities (Article 36).<br />
Conditions for obtaining licenses for Exploration and Exploitation of Non-Associated<br />
Gaseous Hydrocarbons (LOHG, Article 24)<br />
This license is issued by the Ministry of Petroleum and Mining. Domestic or foreign individuals,<br />
with or without the participation of the State wishing to engage in exploration and exploitation<br />
of non-associated gaseous hydrocarbons, according to the following conditions.<br />
Project overview, indicating the destination of these hydrocarbons.<br />
Maximum length of thirty-five (35) years, renewable for a period to be agreed between the parties,<br />
not to exceed thirty (30) years.<br />
Maximum term of five (5) years to carry out the exploration and implementation of the respective<br />
programs, subject to the other conditions specified by the Regulation.<br />
Indication of the size, shape, location and technical delineation of the area under the license and any other<br />
requirements, which for better determination of the area, the Regulations notes.<br />
Indication of special considerations stipulated in favor of the Republic.<br />
Upon termination for any reason, the assets and services will be hand over to the state, according<br />
to conditions established in the contract or according to this article, where it discloses that the regression<br />
is complete, free of encumbrances and without compensation.<br />
In case of dispute, Venezuelan laws will be applied. Disputes shall be resolved in Venezuelan courts.<br />
Regulation of the Organic Law of Gaseous Hydrocarbons (2000) (Gaceta Oficial<br />
N° 36.793 09/23/1999)<br />
It aims to develop the provisions of the Act relating to the exploration and exploitation of<br />
non-associated gaseous hydrocarbons, the collection, storage and use of non-associated natural gas<br />
from such exploitation, and the associated gas produced with the oil or other fossil fuels, processing,<br />
manufacturing, transportation, distribution, internal and external trade of these gases and liquid<br />
hydrocarbons and non-hydrocarbon components cotained in Gaseous hydrocarbons and gas from the oil<br />
refining process.<br />
41
MA<strong>IN</strong> ACTORS<br />
Ministerio del Poder Popular<br />
para el Petróleo y la Minería (MPPPM).<br />
Agency responsible for regulation, policy<br />
formulation and evaluation. As well as planning,<br />
implementation and supervising the activities of the<br />
National Executive on oil and energy in general.<br />
This body is also responsible for market study and<br />
analysis to define prices.<br />
Ente Nacional del Gas (ENAGAS).<br />
It is an agency of the MPPPM that promotes<br />
the development and proficiency in all phases of<br />
the gaseous hydrocarbon industry and regulates<br />
the activities of transmission, distribution and<br />
commercialization of gas.<br />
PDVSA Gas.<br />
PDVSA subsidiary responsible of gas commercialization<br />
nationally and internationally.<br />
PDVSA Gas Comunal.<br />
PDVSA subsidiary responsible for domestic gas distribution<br />
to communities. Activities include filling<br />
gas plants and distribution to homes.<br />
Empresas operadoras privadas.<br />
ChevronTexaco, Statoil, Total, Petrobrás,<br />
Teikoku Oil, Gazprom, Petropars, Repsol YPF,<br />
Eni, Vinccler Oil & Gas, Energía de Portugal (EDP),<br />
Petronas, Inelectra, Otepi, Pluspetrol, GALP,<br />
Qatar Petroleum, Mitsubishi/Mitsui e Itochu.<br />
Petróleos de Venezuela, S.A. (PDVSA).<br />
State owned company in charge of exploration,<br />
production, manufacturing, transportation<br />
and marketing of hydrocarbons (including<br />
associated gas).<br />
42
FISCAL FRAMEWORK<br />
Income Tax (Income Tax Act)<br />
Stock companies and taxpayers assimilated to them, engaged in activities other than those mentioned<br />
in Article 11, will pay tax on all net enrichments, based on the rate provided for in Article 52 and set tax rates<br />
in their paragraphs (Article 9).<br />
Are excluded from the regime provided by Article 11 and 53 paragraph b (proportional rate of fifty percent),<br />
companies engaged in integrated activities or not, of non-associated gas exploration and exploitation,<br />
processing, transportation, distribution, storage, marketing and export of gas and its components (Article 11).<br />
Tax rate on tax units (UT) (Article 52):<br />
To the fraction included up to 2,000.00: 15 percent<br />
For the fraction exceeding 2,000.00 and up to 3,000.00: 22 percent<br />
For the fraction exceeding 3,000.00: 34 percent<br />
Royalty (LOHG, Article 34)<br />
From the volumes of gaseous hydrocarbons extracted from any reservoir, and not reinjected, the State<br />
is entitled to a share of twenty percent (20 percent) as a royalty.<br />
Required by the National Executive in cash or kind, if none is specified, it is assumed to be received in cash.<br />
In case of receive it in kind, the National Executive may use for transport and storage purposes, the services<br />
of the operator, which shall supply to the location as directed by the National Executive, who will pay the<br />
price to be agreed for such services.<br />
In case of receive it in cash; the operator must pay the price of the corresponding gaseous hydrocarbon<br />
volumes, calculated at market value in the field of production.<br />
Exploration and exploitation licenses granted after conversion services agreements in<br />
March 2007<br />
Social investment: one percent of the value of non-associated gas.<br />
Special Consideration for the state: ten percent of the value of non-associated gas.<br />
Annual surface income: a tax unit per hectare.<br />
43
EXPLORATION AND PRODUCTION<br />
Reserves<br />
Venezuela is the country with the eighth largest gas reserves. According to the annual report BP Statistical<br />
Review of World Energy 2013, our country has approximately 196.4 billion cubic feet of gas, which constitute the<br />
second largest reserves in the Americas after the United States whose reserves, according to the report, reaching<br />
around 300 trillion cubic feet.The large shale gas reserves have not yet been incorporated into these figures.<br />
Also, based on BP figures, Venezuela has 73 percent of the gas reserves of Central and South America and 3<br />
percent of world reserves.<br />
Source: BP Statistical Review of World<br />
Energy, 2013.<br />
Reserves, production<br />
and consumption of Gas, 2012<br />
RESERVES<br />
(TCF)<br />
PRODUCTION<br />
(BCFD)<br />
CONSUMPTION<br />
(BCFD)<br />
WORLD 6614.1 324.6 319.8<br />
SOUTH AND CENTRAL AMERICA 268.3 17.1 15.9<br />
<strong>VENEZUELA</strong> 196.4 3.2 3.4<br />
The level of gas reserves in Venezuela remained relatively stable since the mid-90s, growing at an average<br />
annual rate of nearly 1 percent. From the year 2006 there have been significant additions to an increase<br />
of 15 percent over the past six years.<br />
Source: BP Statistical Review of World<br />
Energy, 2013.<br />
44<br />
<strong>VENEZUELA</strong>N NATURAL GAS<br />
PROVED RESERVES 1980-2012<br />
(TRILLIONS OF CUBIC FEETS)<br />
220<br />
200<br />
180<br />
160<br />
140<br />
120<br />
100<br />
80<br />
60<br />
40<br />
1980 1982 1984 1986 1988 1990 1992 1994 1996 1998 2000 2002 2004 2006 2008 2010
PDVSA: RESERVES, PRODUCTION AND CONSUMPTION<br />
According to the Informe de Gestión Anual de PDVSA 2012, certified gas reserves in Venezuela now amount<br />
to 196,409 billion cubic feet, about 30 percent of which are associated with the FPO.<br />
In 2012, 2,747 million cubic feet of gas were incorporated, 89 percent of which comes from review of existing<br />
fields. The remaining 11 percent come from the discovery of new deposits.<br />
Most of Venezuela’s gas reserves are located north and northeast of the country, in the eastern basin and<br />
on the shores of the Caribbean and Atlantic continental shelf in an area of over 500 thousand square<br />
kilometers.<br />
In the chart below you can see the distribution basins of natural gas reserves.<br />
GAS RESERVES DISTRIBUTION CLASSIFIED BY VESSEL 2012<br />
7.36<br />
0.19<br />
22.27<br />
%<br />
GRAFICO<br />
69.7<br />
ORIENTAL<br />
MARACAIBO FALCÓN<br />
CARÚPANO<br />
BAR<strong>IN</strong>AS-APURE<br />
Source: Informe de Gestión Anual<br />
de PDVSA 2012<br />
45
Production and Consumption<br />
According to the Informe de Gestión Anual 2012 de PDVSA, in 2012, natural gas production in the country<br />
was 7,327 million cubic feet of gas per day, 38.18 percent of which was used for reinjection, leaving a net<br />
gas production of 4,456 million cubic feet per day.<br />
In 2011, natural gas production in the country was 7,125 million cubic feet of gas per day, 40.47 percent of which<br />
was used for reinjection, thus net gas production was 4,241 million cubic feet per day.<br />
Venezuelan gas production represents about 19 percent of production in Central and South America and<br />
the 1 to 2 percent of the world.<br />
Between 1970 and 1998 both production and consumption increased steadily. In 1999 gas production<br />
suffered a fall, achieved a progressive recovery, to fall again in 2003 and since then both have remained<br />
around 3,000 MMCFD 12 . By 2012 production was 3,200 MMCFD and 3,400 MMCFD consumption.<br />
<strong>VENEZUELA</strong>N NATURAL GAS PRODUCTION AND CONSUMPTION, 1970-2012<br />
(BILLIONS OF CUBIC FEETS DAILY)<br />
4.0<br />
3.5<br />
3.0<br />
2.5<br />
Source: BP Statistical Review of World<br />
Energy, 2013<br />
2.0<br />
1.5<br />
1.0<br />
0.5<br />
0.0<br />
1972 1975 1978 1981 1984 1987 1990 1993 1996 1999 2002 2005 2008 2011<br />
PRODUCTION<br />
CONSUMPTION<br />
In the past three years, the production level has decreased and consumption has exceeded the amounts<br />
of gas produced in the country. Venezuela has therefore had to resort to imports.<br />
PDVSA´S GAS PRODUCTION<br />
12<br />
6 4 32<br />
%<br />
51<br />
ANACO<br />
LICENCIAS<br />
QUIRIQUIRE GAS<br />
YPERGAS<br />
Source: Informe de Gestión<br />
PDVSA 2012<br />
22<br />
GAS GUÁRICO<br />
SAN TOMÉ<br />
SIPORORO<br />
12<br />
Excluding reinjection.<br />
46
Since 2008 Venezuela has been receiving gas from Colombia through the Transcaribeño Antonio Ricaurte<br />
pipeline. During 2012 Venezuela received from Colombia on average 187 million cubic feet per day of gas,<br />
resulting in a total supply of 7,514 million cubic feet of gas per day (MMCFD).<br />
11<br />
GAS AVAILABILITY BY SOURCE<br />
3<br />
12<br />
%<br />
GRAFICO<br />
74<br />
PDVSA PETRÓLEO<br />
PDVSA GAS<br />
JO<strong>IN</strong>T VENTURES<br />
CCHEVRON & ECOPETROL<br />
PURCHASES<br />
Of the total natural gas available in 2012, 28 percent was for the domestic market to meet the needs<br />
of the electricity, steel, cement, aluminum, household, marketing and petrochemicals<br />
Transport and distribution<br />
The Venezuelan distribution system for methane gas comprise a 5,031 kilometers pipe line network with width<br />
variances. The main systems are listed below:<br />
• Anaco – Barquisimeto<br />
• Anaco – Jose / Anaco - Puerto La Cruz<br />
• Anaco – Puerto Ordaz<br />
• Ulé – Amuay<br />
• Interconnection Coast – West<br />
• Interconnection Center East - West<br />
• Pipeline Transcaribeño Antonio Ricaurte<br />
With these facilities by 2012 the demand of more<br />
than 353,000 commercial and residential users was<br />
met, 91 percent of which were located in La Gran<br />
Caracas.<br />
In 2012 were incorporated 521 km of new lines:<br />
Phase I of the pipeline under construction G / J Jose<br />
Francisco Bermudez, Section Cumana-Daisy Barbecue:<br />
295 Km<br />
New segment Morón-Barquisimeto (ENELBAR IV):<br />
• Phase I - 55 Km (completed)<br />
• Phase II - 22 Km<br />
Pipeline under construction Altagracia-Arichuna expansion<br />
of Anaco- Barquisimeto system, stretch Altagracia<br />
(N50) - Guatopo (N-A10): 13 km<br />
Expansion of Anaco - Puerto Ordaz system:<br />
• Pipeline Soto-Epa: 29 Km<br />
• West Lejos-Morichal Pipeline section: 37.7 Km<br />
• Pipeline stretch Morichal - Mamo: 34.7 Km<br />
Branch line methane gas distribution to Ezequiel<br />
Zamora Power Plant: 2.6 Km<br />
Branch line methane gas distribution to La Raisa<br />
Power Plant: 5 Km<br />
Branch line methane gas distribution to El Sitio<br />
Power Plant: 1.7 Km<br />
Branch line methane gas distribution to San Diego<br />
de Cabrutica Power Plant: 25 Km<br />
47
Domestic Gas<br />
According to PDVSA Gas Communal information, 95 percent of Venezuelan families use liquefied petroleum<br />
gas (LPG) as an energy source. In December 2007 PDVSA Gas Communal was created as well as TROPIGAS<br />
and Vengas, the two largest distributors, was acquired by the state affiliate.<br />
In accordance with PDVSA’s last report, PDVSA Gas Communal has 60 of the 86 LPG filling plants<br />
nationwide, supplied a total of 42 national MDB, increasing by 5 percent compared to 2011, of MDB 35.42<br />
which correspond to PDVSA Gas Communal and private sector MDB 6.25.<br />
Investment<br />
Venezuela’s gas development is part of the Siembra Petrolera Plan 2012-2018. Two of its main axes are the<br />
development of offshore gas to meet the domestic market and the absolute sovereignty over oil and gas<br />
resources. According to the Plan, the targets set for 2019 with regards to gas production are 11,947 MMCFD<br />
of natural gas and 255 MBD of LNG.<br />
In 2010, 1.305 billion dollars were invested in Mainland Gas Development, 16 percent less than planned<br />
in 2009, while in 2011 the actual investment was 1,601 million, 6 percent higher than envisaged in the 2010<br />
plan investment for the development of Gas on the mainland. Beginning 2010 offshore gas development<br />
investment weren´t reported.<br />
Total disbursements for gas investment in Ground projected for the period 2012-2018 was located at 25,425<br />
million dollars. However, in 2012 there was an adjustment of the Plan, as the investment observed in the<br />
Annual Report for 2012 only contemplates PDVSA investment outlays by PDVSA Gas. For 2012 the amount<br />
was U.S. $ 2,682 million and its projected total for the period 2013-2018 is 22,048 million dollars, 13 percent<br />
lower than proposed in the 2012-2018 Plan.<br />
ONSHORE PROJECTED DISBURSEMENT <strong>IN</strong>VESTMENTS 2011-2018<br />
(MILLIONS OF DOLLARS)<br />
6.000<br />
5.000<br />
4.000<br />
<strong>IN</strong>FORME DE GESTIÓN DE PDVSA 2010<br />
<strong>IN</strong>FORME DE GESTIÓN DE PDVSA 2011<br />
3.000<br />
2.000<br />
1.000<br />
0<br />
2011 2012 2013 2014 2015 2016 2017 2018<br />
Source: Informe de Gestión PDVSA<br />
2010 y 2011.<br />
48
PDVSA: RESERVES, PRODUCTION Y CONSUMPTION<br />
PDVSA Gas Projects<br />
Project Description Location Current Situation<br />
Rafael Urdaneta<br />
Plataforma Deltana<br />
Mariscal Sucre<br />
Development of non-associated<br />
gas reserves located offshore, with<br />
potential reserves of 23 trillion cubic<br />
feet (TCF) of associated gas and 7 billion<br />
barrels of liquid hydrocarbons, designed<br />
to produce 1,000 MMCFD.<br />
Exploration and exploitation of<br />
offshore associated gas. Measurable<br />
reserves of a volume between 6 and<br />
10 BPC. Gas production estimated<br />
between 800 and 1,000 MMCFD.<br />
Includes transportation infrastructure<br />
to Industrial Complex Gran Mariscal de<br />
Ayacucho.<br />
Exploitation of non-associated<br />
gas reserves offshore and construction<br />
of an LNG plant. Gas Production Phase<br />
I: 600 MMCFD the domestic market.<br />
Final production estimated: 18<br />
thousands of condensate B/D, 1,200<br />
MMCFD Reservations: 14.73 Trillion<br />
cubic feet of gas and 74.82 million barrels<br />
condensate<br />
Northeastern Gulf of<br />
Venezuela and Falcón<br />
Delta Amacuro *<br />
North of Paria Peninsula,<br />
Sucre<br />
*<br />
*<br />
Blanquilla, Tortuga, Golfo<br />
de Paria Oeste Punta Pescador<br />
Exploration and exploitation<br />
of non-associated gas reserves under<br />
the Delta Caribe Project.<br />
These are areas with complex<br />
hydrocarbon systems but with an<br />
estimated gas potential of 11 trillion<br />
cubic feet.<br />
Nueva Esparta y Delta<br />
Amacuro<br />
*<br />
Gas Anaco<br />
Includes construction of five operating<br />
centers to collect, compress and<br />
transfer a potential production of 2,559<br />
and 34.55 thousands B/D of light crude<br />
Anzoátegui y Monagas 54%<br />
Jose’s Fractionation Capacity<br />
Increase<br />
It involves the construction of a new<br />
NGL fractionation train of 50 thousands<br />
B/D in Jose´s fractioning plant.<br />
Anzoátegui y Monagas<br />
Work in progress<br />
at Poliducto<br />
San Joaquín-Jose<br />
San Tomé Gas Project<br />
San Tomé Gas Project involves the<br />
construction of surface infrastructure<br />
required to handle a potential<br />
maximum set of 550 MMPCND/152<br />
MBHP<br />
Anzoátegui 15%<br />
49
PDVSA: RESERVES, PRODUCTION Y CONSUMPTION<br />
PDVSA Gas Projects<br />
Project Description Location Current Situation<br />
Soto Deep Extraction Plant<br />
The project aims to install a modular<br />
deep NGL extraction plant and<br />
Auxiliary Services Module I and II, with<br />
capacity to process 200 million cubic<br />
feet of gas and produce 15 thousands<br />
B/D of NGL.<br />
Anzoátegui 45%<br />
IV Tren de San Joaquín<br />
The project aims to build process<br />
facilities and services of an NGL<br />
extraction plant, which helps to<br />
increase processing capacity in Anaco<br />
area at 1,000 MMCFD, generating<br />
50 thousands B/D of NGL and 890<br />
MMCFD of residual gas to the gas<br />
transport systems of the domestic<br />
market.<br />
Anzoátegui 39%<br />
Pirital I<br />
The project aims to execute the<br />
construction and implementation<br />
of a deep extraction plant including<br />
ethane recovery, for the extraction of<br />
NGLs, with a 1,000 MMCFD natural<br />
gas processing capacity, generating 42<br />
thousands B/D of NGL.<br />
Monagas 8,33%<br />
Management and Disposal<br />
of CO ²<br />
Installation of CO ² gas reduction units<br />
capable of decreasing this component<br />
in processing gas to comply with the<br />
new regulations for gas transmission<br />
and commercialization under 3568<br />
COVEN<strong>IN</strong> standard that takes effect<br />
in 2013.<br />
4%<br />
Interconexión Centro-<br />
Occidente (ICO) Tramo Ulé<br />
- Amuay<br />
Gas transport systems infrastructure<br />
development to interconnect the<br />
Centro-Oriente (from Anaco –<br />
Anzoategui- to Barquisimeto –Lara-)<br />
with Occidente (from Ule, -Zulia- to<br />
Amuay –Falcon-). This allows the<br />
additional gas transmition of 520<br />
MMSCFD from Oriente to Occidente.<br />
Centro, Oriente,<br />
Occidente<br />
88%<br />
Bajo Grande Ulé Amuay<br />
Transmission System Expansion<br />
Transport capacity expansion from 220<br />
MMSCFD to 620 MMSCFD, to achieve<br />
the fulfillment of national and<br />
international gas delivery<br />
commitments.<br />
Falcón, Zulia 33%<br />
50
PDVSA: RESERVES, PRODUCTION Y CONSUMPTION<br />
PDVSA Gas Projects<br />
Project Description Location Current Situation<br />
Pipeline Nor-Oriental G/J<br />
José Francisco Bermúdez<br />
(S<strong>IN</strong>ORGAS)<br />
Infrastructure construction<br />
to incorporate gas from northeastern<br />
region offshore gas developments<br />
in the domestic market.<br />
Anzoátegui, Sucre,<br />
Monagas y Nueva<br />
Esparta<br />
51%<br />
Source: Informe de Gestión Anual<br />
de PDVSA 2009, 2010, 2011 y 2012.<br />
National Gasification<br />
Methane gas distribution networks<br />
development to gasify 23 states.<br />
Includes the installation of 48,900 km<br />
network distribution infrastructure to<br />
supply gas to 3,260,000 families across<br />
the country.<br />
All over the country 46%<br />
Transportation System Expansion Project<br />
Project Description Location<br />
Current Situation<br />
Anaco - PLC (Phase I and II)<br />
Construction of the necessary<br />
infrastructure for methane transport,<br />
in order to meet future gas demand.<br />
Anzoátegui 96%<br />
Anaco - Puesto Ordaz<br />
(Pipeline Epa Soto)<br />
Anzoátegui y Bolívar 91%<br />
Pipeline Tramo West Lejos -<br />
Morichal - Mamo<br />
Monagas 95%<br />
Source: Informe de Gestión Anual<br />
de PDVSA 2012.<br />
Anaco - Barquisimeto Oriente and Occidente 32,25%<br />
51
National and international Gas prices<br />
(Dollars by million of BTU)<br />
All the gas produced in Venezuela is consumed domestically, so it is important to consider domestic prices.<br />
According to current regulations, the state sets the prices and tariffs through the Ministry of Popular Power<br />
for Energy and Petroleum, with the collaboration of Ministry of Popular Power for Production and Commerce,<br />
as recommended by Enagas<br />
In 2006 it was established that for the year 2007, prices should reach approximately Bs. 26.86 per cubic<br />
meter. The new goal was set at Bs. 45.42 per cubic meter by 2015.<br />
Venezuelan*<br />
(fixed 2011)<br />
World<br />
(January 2011)***<br />
Venezuelan*<br />
(fixed 2012)<br />
World<br />
(January<br />
2012)***<br />
Venezuelan*<br />
(fixed 2013)<br />
World<br />
(January<br />
2013)***<br />
Anaco<br />
Lago<br />
Henry<br />
Hub<br />
NYC<br />
Gate****<br />
Anaco<br />
Lago<br />
Henry<br />
Hub<br />
NYC<br />
Gate****<br />
Anaco Lago Henry<br />
Hub<br />
NYC<br />
Gate****<br />
Source: Source: Venezuelan prices: Gaceta<br />
Oficial 38.401; World prices: Bloomberg<br />
* Domestic Gas<br />
*** Prices in December 31st<br />
****Mean monthly price in January<br />
Dispatch<br />
Center at<br />
Anaco<br />
0.31 0.62 2.97 5.06 0.33 0.66 2.67 4.85 0.35 0.7 3.3 4.52<br />
Mean 0.47 4.02 0.50 3.76 0.53 3.91<br />
52
PROJECTIONS 2011 – 2035 / OIL<br />
The following is a set of projections estimated by the International Energy Agency for the period 2011 - 2035<br />
and the New Policies scenario.<br />
The International Energy Agency projects a significant increase in production beginning in 2020.<br />
Below is a visual comparison between Venezuela production prospects and other important producers,<br />
regionally and members of OPEC.<br />
EXPECTED PRODUCTION <strong>VENEZUELA</strong> - THE AMERICAS<br />
7<br />
MILLONES DE BARRILES DIARIOS<br />
6<br />
5<br />
4<br />
3<br />
2<br />
<strong>VENEZUELA</strong><br />
MEXICO<br />
BRAZIL<br />
CANADA<br />
1<br />
0<br />
2011 2015 2020 2025 2030 2035<br />
Source: : International Energy Agency<br />
World Energy Outlook 2012, New Policies<br />
Scenario and authors calculations.<br />
By 2015 production in Brazil, Venezuela and<br />
Mexico will be similar, given a continued increase in<br />
production in Brazil and a continued decrease<br />
in Mexico. From 2025 Brazilian production will<br />
stagnate. In the case of Canada, strong growth<br />
is projected, always with the support of<br />
non-conventional crude in the Athabasca Oil Sands,<br />
as will be seen in subsequent graphs.<br />
EXPECTED PRODUCTION <strong>VENEZUELA</strong> - OPEC<br />
14<br />
MILLONES DE BARRILES DIARIOS<br />
12<br />
10<br />
8<br />
6<br />
4<br />
2<br />
<strong>VENEZUELA</strong><br />
SAUDI ARABIA<br />
IRAN<br />
IRAQ<br />
UNITED ARAB EMIRATES<br />
Source: International Energy Agency<br />
World Energy Outlook 2012, New Policies<br />
Scenario and authors calculations.<br />
0<br />
2011 2015 2020 2025 2030 2035<br />
53
A production increase is forecast for every country,<br />
especially in Iraq with a growth rate of 4.59 percent<br />
annual average.<br />
To meet these projections, Venezuela should have<br />
an annual growth of production equivalent to<br />
1.04 percent.<br />
UNCONVENTIONAL CRUDES EXPECTED PRODUCTION<br />
5<br />
4.5<br />
MILLION BARRELS DAILY<br />
4<br />
3.5<br />
3<br />
2.5<br />
2<br />
1.5<br />
<strong>VENEZUELA</strong><br />
CANADA<br />
Source: International Energy<br />
Agency World Energy Outlook 2012,<br />
New Policies Scenario<br />
and authors calculations<br />
1<br />
0.5<br />
0<br />
2011 2015 2020 2025 2030 2035<br />
The annual growth rate of production of<br />
unconventional oil in Venezuela will be much<br />
higher than the overall growth rate of oil<br />
production, reaching the equivalent of 5 percent<br />
annual increase. This trend will have an effect<br />
such that, for 2035, approximately 50 percent of<br />
Venezuelan production will be of this type of oil.<br />
As global oil demand, the IEA estimates a compound<br />
annual growth of 0.53 percent, caused mainly by the<br />
growth of Asian developing countries (2.12 percent) and<br />
Latin America (0.85 percent) compared to lower U.S.<br />
(-1.33 percent) and European demand (-0.92 percent).<br />
PROJECTED DEMAND BY REGION<br />
35<br />
30<br />
MILLION BARRELS DAILY<br />
25<br />
20<br />
15<br />
10<br />
USA<br />
EUROPA<br />
ASIA<br />
LAT<strong>IN</strong> AMERICA<br />
5<br />
54<br />
0<br />
2011 2015 2020 2025 2030 2035
Within the BRIC (Brazil, Russia, China and India) shows much higher growth in China and India relative to the<br />
rest of the group.<br />
PROJECTED DEMAND BRIC<br />
16<br />
14<br />
MILLION BARRELS DAILY<br />
12<br />
10<br />
8<br />
6<br />
4<br />
CH<strong>IN</strong>A<br />
<strong>IN</strong>DIA<br />
BRAZIL<br />
RUSSIA<br />
2<br />
0<br />
2011 2015 2020 2025 2030 2035<br />
PROJECTIONS 2011 – 2035 / GAS<br />
Regarding natural gas production, the International Energy Agency projects a steadily growing trend for<br />
Venezuela, with compound annual growth of 4.55 percent, showing a considerable acceleration from 2025<br />
and a slowdown in growth in 2030.<br />
EXPECTED PRODUCTION <strong>VENEZUELA</strong> - THE AMERICAS<br />
100<br />
90<br />
BILLIONS OF CUBIC METERS<br />
80<br />
70<br />
60<br />
50<br />
40<br />
30<br />
20<br />
10<br />
<strong>VENEZUELA</strong><br />
BRAZIL<br />
ARGENT<strong>IN</strong>A<br />
0<br />
2010 2015 2020 2025 2030 2035<br />
Despite the positive forecasts for Venezuelan production, Brazil stands out for its sharp rise beginning 2015,<br />
reaching a compound annual rate of 7.28 percent on a sustained basis throughout the estimated timeframe.<br />
In contrast, Argentina has a less favorable performance, with an annual rate of 1.82 percent.<br />
At the continental level, there is a growing trend of 1.13 percent in U.S. crude oil production due to shale gas<br />
developments. Meanwhile, Latin America shows higher growth (2.36 percent), but starting from lower levels.<br />
Canada, despite starting with production levels similar to those in Latin America, shows a lower growth rate<br />
of 0.65 percent compounded annually.<br />
Source: International Energy Agency<br />
World Energy Outlook 2012, New Policies<br />
Scenario and authors calculations.<br />
55
The International Center on Energy and Environment<br />
was created in 2005 to place <strong>IESA</strong> as the reference,<br />
at national and regional levels, in training<br />
managers with leadership skills in the energy sector,<br />
being a center of excellence in reflection, generation<br />
and dissemination of knowledge in the areas of<br />
energy and environment, with national and international<br />
reach.<br />
<strong>IN</strong>TERNATIONAL CENTER ON <strong>ENERGY</strong> AND ENVI-<br />
RONMENT TEAM:<br />
Director<br />
Francisco Monaldi<br />
Ph.D. Political Economy, Stanford. M.A. Economics,<br />
Yale<br />
Academic Coordinator<br />
Pedro Luis Rodríguez<br />
MPhil Economics, Cambridge<br />
Professors<br />
Richard Obuchi<br />
Ph.D. (c), Tulane. M.P.P. Chicago<br />
Profesores de Planta y Adjuntos afiliados al CIEA<br />
Asdrúbal Baptista - M.A. Kent<br />
Osmel Manzano - Ph.D. MIT<br />
José Manuel Puente - Ph.D. Oxford<br />
Ricardo Villasmil - Ph.D. Texas A&M<br />
Visitant Professors<br />
Ramón Espinasa - Ph.D. Cambridge<br />
Luisa Palacios - Ph.D. SAIS Johns Hopkins<br />
Luis Pacheco - Ph.D. Imperial College<br />
Luis Roberto Rodríguez - Ph.D. Oxford<br />
Researchers<br />
Amanda Beaujon Marín – Political Science, UCV<br />
Jean Paul Leidenz - Economics UCAB<br />
57
RIF:J-000675473<br />
<strong>IESA</strong>, Sede Principal en Caracas - Venezuela<br />
Tel: (+58 212) 555 4260<br />
58