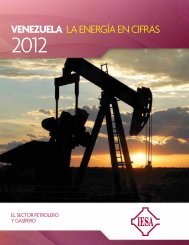
VENEZUELA ENERGY IN FIGURES - Servicios IESA
VENEZUELA ENERGY IN FIGURES - Servicios IESA
VENEZUELA ENERGY IN FIGURES - Servicios IESA
- No tags were found...

Create successful ePaper yourself
Turn your PDF publications into a flip-book with our unique Google optimized e-Paper software.
EXPLORATION AND PRODUCTION<br />
PRODUCTION <strong>IN</strong> 2012 ACCORD<strong>IN</strong>G<br />
TO <strong>IN</strong>TERNATIONAL SOURCES<br />
According to the monthly report of May 2013<br />
of the Organization of Petroleum Exporting<br />
Countries (OPEC) Venezuela´s oil production in<br />
2012 was 2.360 million barrels per day, about 8<br />
percent lower than in 2008. This level of<br />
production, according to OPEC, takes into<br />
account the amount of conventional crude oil<br />
production and the production of extra-heavy crude<br />
from the Orinoco Belt, once upgraded. This figure<br />
does not include condensed liquids nor natural gas<br />
liquids. This explains in part the difference with other<br />
international sources such as BP and official sources,<br />
both of which consolidate all production in one figure.<br />
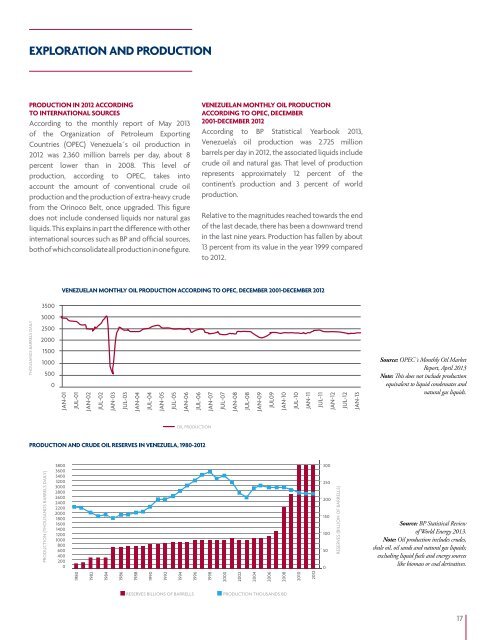
<strong>VENEZUELA</strong>N MONTHLY OIL PRODUCTION<br />
ACCORD<strong>IN</strong>G TO OPEC, DECEMBER<br />
2001-DECEMBER 2012<br />
According to BP Statistical Yearbook 2013,<br />
Venezuela’s oil production was 2.725 million<br />
barrels per day in 2012, the associated liquids include<br />
crude oil and natural gas. That level of production<br />
represents approximately 12 percent of the<br />
continent’s production and 3 percent of world<br />
production.<br />
Relative to the magnitudes reached towards the end<br />
of the last decade, there has been a downward trend<br />
in the last nine years. Production has fallen by about<br />
13 percent from its value in the year 1999 compared<br />
to 2012.<br />
<strong>VENEZUELA</strong>N MONTHLY OIL PRODUCTION ACCORD<strong>IN</strong>G TO OPEC, DECEMBER 2001-DECEMBER 2012<br />
3500<br />
3000<br />
THOUSANDS BARRELS DAILY<br />
2500<br />
2000<br />
1500<br />
1000<br />
500<br />
0<br />
3800<br />
3600<br />
3400<br />
3200<br />
3000<br />
2800<br />
2600<br />
2400<br />
2200<br />
2000<br />
1800<br />
1600<br />
1400<br />
1200<br />
1000<br />
800<br />
600<br />
400<br />
200<br />
0<br />
300<br />
250<br />
200<br />
150<br />
100<br />
50<br />
0<br />
1980<br />
1982<br />
1984<br />
1986<br />
1988<br />
1990<br />
1992<br />
1994<br />
1996<br />
JAN-01<br />
1998<br />
JUL-01<br />
PRODUCTION AND CRUDE OIL RESERVES <strong>IN</strong> <strong>VENEZUELA</strong>, 1980-2012<br />
2000<br />
JAN-02<br />
2002<br />
JUL-02<br />
Source: OPEC´s Monthly Oil Market<br />
Report, April 2013<br />
Note: This does not include production<br />
equivalent to liquid condensates and<br />
natural gas liquids.<br />
2004<br />
2006<br />
JAN-03<br />
2008<br />
2010<br />
2012<br />
JUL-03<br />
JAN-04<br />
JUL-04<br />
JAN-05<br />
JUL-05<br />
JAN-06<br />
JUL-06<br />
JAN-07<br />
JUL-07<br />
JAN-08<br />
JUL-08<br />
JAN-09<br />
JUL09<br />
JAN-10<br />
JUL-10<br />
JAN-11<br />
JUL-11<br />
JAN-12<br />
JUL-12<br />
JAN-13<br />
OIL PRODUCTION<br />
PRODUCTION (THOUSANDS BARRELS DAILY)<br />
RESERVES (BILLION OF BARRELLS)<br />
Source: BP Statistical Review<br />
of World Energy 2013.<br />
Note: Oil production includes crudes,<br />
shale oil, oil sands and natural gas liquids;<br />
excluding liquid fuels and energy sources<br />
like biomass or coal derivatives.<br />
RESERVES BILLIONS OF BARRELLS<br />
PRODUCTION THOUSANDS BD<br />
17