VENEZUELA ENERGY IN FIGURES - Servicios IESA
VENEZUELA ENERGY IN FIGURES - Servicios IESA
VENEZUELA ENERGY IN FIGURES - Servicios IESA
- No tags were found...

Create successful ePaper yourself
Turn your PDF publications into a flip-book with our unique Google optimized e-Paper software.
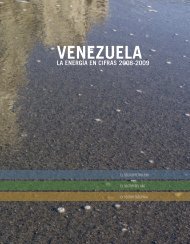
PDVSA: PRODUCTION, CONSUMPTION AND OIL RESERVES <strong>IN</strong> <strong>VENEZUELA</strong>, 1980-2012<br />
According to official figures, the production was 2.91 million barrels per day in 2012,<br />
representing a decrease of 2.7 percent from 2011, when production was 2.99 million barrels per day.<br />
With respect to consumption, PDVSA reported for 2012 a total of 681 thousand barrels per day.<br />
In 2011, PDVSA’s operating expenses were U.S. $ 14.555 million, an increase of 58 percent over 2012, when they<br />
were 23.014 million dollars. This increase relates primarily to the costs of Welfare, Labor and Benefit of workers.<br />
PDVSA PRODUCTION, DOMESTIC CONSUMPTION AND CONVENTIONAL OIL RESERVES <strong>IN</strong> <strong>VENEZUELA</strong>, 1980-2012<br />
THOUSANDS BARRELS DAILY<br />
3500<br />
3000<br />
2500<br />
2000<br />
1500<br />
1000<br />
300<br />
250<br />
200<br />
150<br />
100<br />
Source: PODE until 2008, Informe<br />
Operacional y Financiero de Pdvsa (2009),<br />
Informe de Gestión PDVSA 2010; Informe<br />
de Gestión PDVSA 2011 and Informe<br />
de Gestión PDVSA 2012.<br />
Note 1: Reserve level includes conventional<br />
and heavy-weight crudes certified until<br />
2007. They were estimated considering<br />
a 20 percent recovery rate.<br />
Note 2: Data includes natural gas<br />
condensates and heavy-weight crudes<br />
destined to Orimulsion.<br />
500<br />
50<br />
0<br />
1980<br />
1981<br />
1982<br />
1983<br />
1984<br />
1985<br />
1986<br />
1987<br />
1988<br />
1989<br />
1990<br />
1991<br />
1992<br />
1993<br />
1994<br />
1995<br />
1996<br />
1997<br />
1998<br />
1999<br />
2000<br />
2001<br />
2002<br />
2003<br />
2004<br />
2005<br />
2006<br />
2007<br />
2008<br />
2009<br />
2010<br />
2011<br />
2012<br />
0<br />
RESERVES MMMB PRODUCTION MBD CONSUMPTION MBD<br />
<strong>IN</strong>VESTMENT<br />
In 2012 investments in the oil industry increased<br />
by 47 percent relative to 2011, rising from 17.5<br />
billion dollars to 24.6. In 2012 the investments were<br />
concentrated in the area of oil exploration and<br />
production with an investment of approximately<br />
U.S. $ 12.48 billion. There was a decrease<br />
in investment in non-oil sectors of 51 percent,<br />
declining from 1.46 billion dollars to 0.715<br />
billion. However, investments in “Other” areas<br />
increased by 86 percent, resulting in the<br />
percentage share of total investments exceeding<br />
the sum of investments in refining, trading and<br />
supply, gas and food and consumer goods / non-oil<br />
subsidiaries.<br />
8<br />
3<br />
11<br />
27<br />
<strong>IN</strong>VESTMENT BY SECTOR <strong>IN</strong> 2012<br />
EXPLORATION AND PRODUCTION<br />
%<br />
REF<strong>IN</strong>N<strong>IN</strong>G, COMMERCIALIZ<strong>IN</strong>G AND SUPPLY<br />
GAS<br />
FOOD AND MASSIVE CONSUMPTION<br />
PRODUCTS/AFFILIATES UNRELATED TO OIL<br />
OTHERS<br />
51<br />
Source: Informe de Gestión<br />
PDVSA 2012.<br />
19