VENEZUELA ENERGY IN FIGURES - Servicios IESA
VENEZUELA ENERGY IN FIGURES - Servicios IESA
VENEZUELA ENERGY IN FIGURES - Servicios IESA
- No tags were found...

You also want an ePaper? Increase the reach of your titles
YUMPU automatically turns print PDFs into web optimized ePapers that Google loves.
PROJECTIONS 2011 – 2035 / OIL<br />
The following is a set of projections estimated by the International Energy Agency for the period 2011 - 2035<br />
and the New Policies scenario.<br />
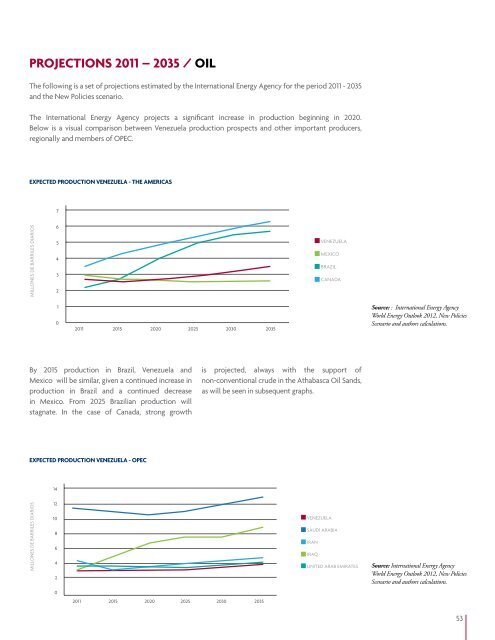
The International Energy Agency projects a significant increase in production beginning in 2020.<br />
Below is a visual comparison between Venezuela production prospects and other important producers,<br />
regionally and members of OPEC.<br />
EXPECTED PRODUCTION <strong>VENEZUELA</strong> - THE AMERICAS<br />
7<br />
MILLONES DE BARRILES DIARIOS<br />
6<br />
5<br />
4<br />
3<br />
2<br />
<strong>VENEZUELA</strong><br />
MEXICO<br />
BRAZIL<br />
CANADA<br />
1<br />
0<br />
2011 2015 2020 2025 2030 2035<br />
Source: : International Energy Agency<br />
World Energy Outlook 2012, New Policies<br />
Scenario and authors calculations.<br />
By 2015 production in Brazil, Venezuela and<br />
Mexico will be similar, given a continued increase in<br />
production in Brazil and a continued decrease<br />
in Mexico. From 2025 Brazilian production will<br />
stagnate. In the case of Canada, strong growth<br />
is projected, always with the support of<br />
non-conventional crude in the Athabasca Oil Sands,<br />
as will be seen in subsequent graphs.<br />
EXPECTED PRODUCTION <strong>VENEZUELA</strong> - OPEC<br />
14<br />
MILLONES DE BARRILES DIARIOS<br />
12<br />
10<br />
8<br />
6<br />
4<br />
2<br />
<strong>VENEZUELA</strong><br />
SAUDI ARABIA<br />
IRAN<br />
IRAQ<br />
UNITED ARAB EMIRATES<br />
Source: International Energy Agency<br />
World Energy Outlook 2012, New Policies<br />
Scenario and authors calculations.<br />
0<br />
2011 2015 2020 2025 2030 2035<br />
53