PowerPanel uWIN Software
PowerPanel uWIN Software - Uticor
PowerPanel uWIN Software - Uticor
- No tags were found...
You also want an ePaper? Increase the reach of your titles
YUMPU automatically turns print PDFs into web optimized ePapers that Google loves.
<strong>uWIN</strong> <strong>Software</strong> Manual UTICOR Technology, LP<br />
2 Main Programming Screen<br />
you have selected a basic frame, Color1 is used on all sides of<br />
the frame.<br />
20. Click OK.<br />
Bar Graph Object<br />
The Bar Graph Object will allow you to program a bar graph.<br />
How to create a Bar Graph Object:<br />
1. Click on the Bar Graph Icon.<br />
2. Position the cursor on the desired location. (It’s best to start<br />
with the top/left corner and drag down/right.)<br />
3. Click, do not hold, the left mouse button.<br />
4. Take note of the direction and size you want your bar graph.<br />
This is important because you are actually creating the bar<br />
graph area now.<br />
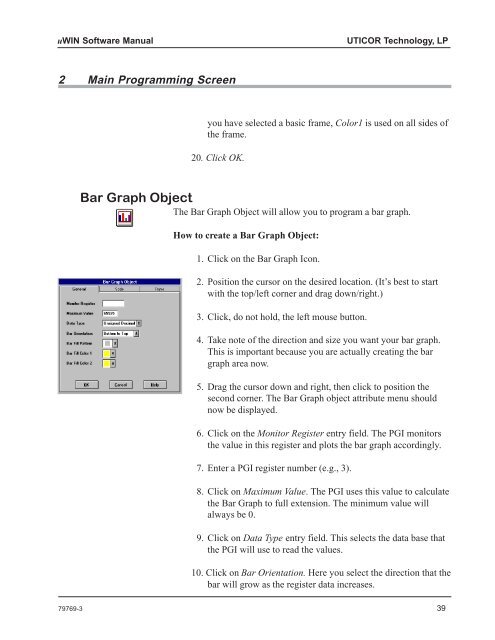
5. Drag the cursor down and right, then click to position the<br />
second corner. The Bar Graph object attribute menu should<br />
now be displayed.<br />
6. Click on the Monitor Register entry field. The PGI monitors<br />
the value in this register and plots the bar graph accordingly.<br />
7. Enter a PGI register number (e.g., 3).<br />
8. Click on Maximum Value. The PGI uses this value to calculate<br />
the Bar Graph to full extension. The minimum value will<br />
always be 0.<br />
9. Click on Data Type entry field. This selects the data base that<br />
the PGI will use to read the values.<br />
10. Click on Bar Orientation. Here you select the direction that the<br />
bar will grow as the register data increases.<br />
79769-3 39


