Illicit Financial Flows
Illicit Financial Flows and the Problem of Net Resource Transfers ...
Illicit Financial Flows and the Problem of Net Resource Transfers ...

You also want an ePaper? Increase the reach of your titles
YUMPU automatically turns print PDFs into web optimized ePapers that Google loves.
STRICTLY EMBARGOED UNTIL TUESDAY NIGHT, 28 MAY 2013<br />
AT 18:59 EDT / 23:59 BST / 23:59 WEST / 23:59 CET<br />
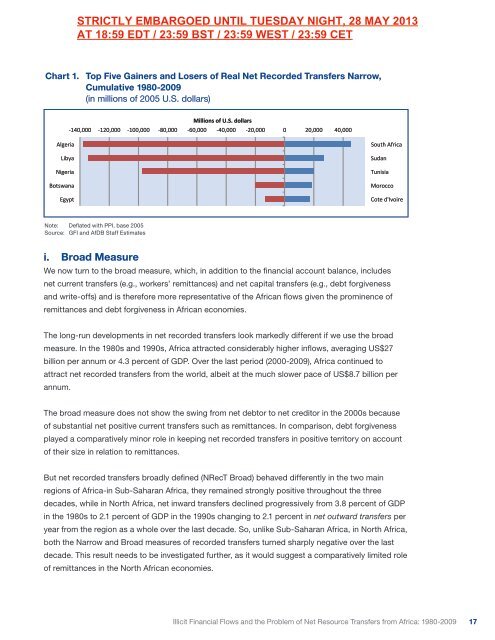
Chart 1. Top Five Gainers and Losers of Real Net Recorded Transfers Narrow,<br />
Cumulative Chart 1. Top 1980-2009 Five Gainers and Losers of Real Net Recorded Transfers <br />
(in millions of 2005 U.S. Narrow, dollars) CumulaAve 1980-‐2009 <br />
deflated with CPI, base 2005 <br />
Millions of U.S. dollars <br />
-‐140,000 -‐120,000 -‐100,000 -‐80,000 -‐60,000 -‐40,000 -‐20,000 0 20,000 40,000 <br />
Algeria <br />
Libya <br />
Nigeria <br />
Botswana <br />
Egypt <br />
South Africa <br />
Sudan <br />
Tunisia <br />
Morocco <br />
Cote d'Ivoire <br />
Note: Deflated with PPI, base 2005<br />
Source: GFI and AfDB Staff Estimates<br />
i. Broad Measure<br />
We now turn to the broad measure, which, in addition to the financial account balance, includes<br />
net current transfers (e.g., workers’ remittances) and net capital transfers (e.g., debt forgiveness<br />
and write-offs) and is therefore more representative of the African flows given the prominence of<br />
remittances and debt forgiveness in African economies.<br />
The long-run developments in net recorded transfers look markedly different if we use the broad<br />
measure. In the 1980s and 1990s, Africa attracted considerably higher inflows, averaging US$27<br />
billion per annum or 4.3 percent of GDP. Over the last period (2000-2009), Africa continued to<br />
attract net recorded transfers from the world, albeit at the much slower pace of US$8.7 billion per<br />
annum.<br />
The broad measure does not show the swing from net debtor to net creditor in the 2000s because<br />
of substantial net positive current transfers such as remittances. In comparison, debt forgiveness<br />
played a comparatively minor role in keeping net recorded transfers in positive territory on account<br />
of their size in relation to remittances.<br />
But net recorded transfers broadly defined (NRecT Broad) behaved differently in the two main<br />
regions of Africa-in Sub-Saharan Africa, they remained strongly positive throughout the three<br />
decades, while in North Africa, net inward transfers declined progressively from 3.8 percent of GDP<br />
in the 1980s to 2.1 percent of GDP in the 1990s changing to 2.1 percent in net outward transfers per<br />
year from the region as a whole over the last decade. So, unlike Sub-Saharan Africa, in North Africa,<br />
both the Narrow and Broad measures of recorded transfers turned sharply negative over the last<br />
decade. This result needs to be investigated further, as it would suggest a comparatively limited role<br />
of remittances in the North African economies.<br />
<strong>Illicit</strong> <strong>Financial</strong> <strong>Flows</strong> and the Problem of Net Resource Transfers from Africa: 1980-2009<br />
17