

Ethiopia KILM
Ethiopia KILM
Ethiopia KILM
- No tags were found...

Create successful ePaper yourself
Turn your PDF publications into a flip-book with our unique Google optimized e-Paper software.
Employment-to-population ratio <strong>KILM</strong> 2<br />
Employment-to-population ratios provide a limited measure for decent work that encompasses the<br />
quality as well as the quantity of jobs including aspects of employment related to rights, protection<br />
and dialogue. For this reason, it is useful to supplement this indicator with other measures such as<br />
earnings, hours of work, unemployment and underemployment, formal and informal employment<br />
and conditions of work.<br />
Trends<br />
As it can be seen from table 5 below, the trend of employment-to-population ratio in <strong>Ethiopia</strong> was<br />
fluctuating. The ratio has been decreasing from the year 1994 to 1999, increasing from the year 1999<br />
to 2005 and showed a tendency to decline from the year 2005 to 2007 for youth and adult population.<br />
This was largely a result of the decline in the participation rate especially for females, as seen in the<br />
previous indicator. When one looks at the ratio in terms of sex, the ratio is higher for male than for<br />
their female counterparts.<br />
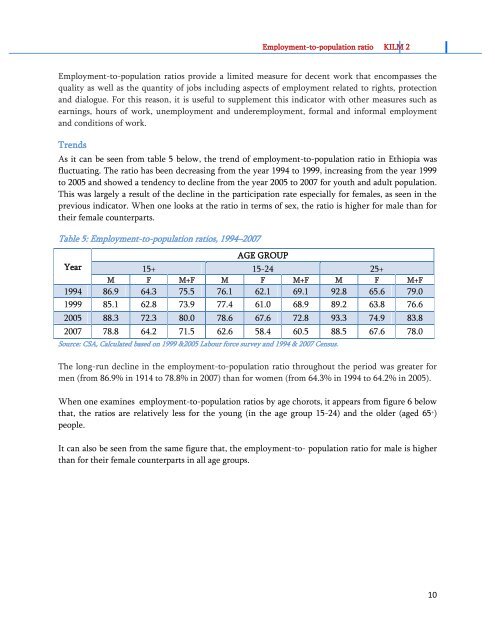
Table 5: Employment-to-population ratios, 1994–2007<br />
AGE GROUP<br />
Year<br />
15+ 15-24 25+<br />
M F M+F M F M+F M F M+F<br />
1994 86.9 64.3 75.5 76.1 62.1 69.1 92.8 65.6 79.0<br />
1999 85.1 62.8 73.9 77.4 61.0 68.9 89.2 63.8 76.6<br />
2005 88.3 72.3 80.0 78.6 67.6 72.8 93.3 74.9 83.8<br />
2007 78.8 64.2 71.5 62.6 58.4 60.5 88.5 67.6 78.0<br />
Source: CSA, Calculated based on 1999 &2005 Labour force survey and 1994 & 2007 Census.<br />
The long-run decline in the employment-to-population ratio throughout the period was greater for<br />
men (from 86.9% in 1914 to 78.8% in 2007) than for women (from 64.3% in 1994 to 64.2% in 2005).<br />
When one examines employment-to-population ratios by age chorots, it appears from figure 6 below<br />
that, the ratios are relatively less for the young (in the age group 15-24) and the older (aged 65 + )<br />
people.<br />
It can also be seen from the same figure that, the employment-to- population ratio for male is higher<br />
than for their female counterparts in all age groups.<br />
10