

Ethiopia KILM
Ethiopia KILM
Ethiopia KILM
- No tags were found...

You also want an ePaper? Increase the reach of your titles
YUMPU automatically turns print PDFs into web optimized ePapers that Google loves.
Labour Force Participation Rate<br />
Labour force participation rate <strong>KILM</strong> 1<br />
Trends<br />
Analysis of the labour force participation rate in <strong>Ethiopia</strong> (from table 1 and figure 2 below) reveals<br />
that is has shown an increasing trend for the period 1994-2005 and a declining trend from 2005-<br />
2007. One possible explanation for the decline of the LFPR for the younger age group (15-24) is that<br />
due to improved educational attainment they postponed their entry into the labour market in order<br />
to pursue their studies.<br />
Table 1: Labour force participation rates, 1994-2007<br />
Age<br />
Group<br />
YEAR<br />
1994 1999 2005 2007<br />
M F M+F M F M+F M F M+F M F M+F<br />
15+ 89.6 66.5 77.9 89.7 71.9 80.5 89.2 77.4 83.1 81.6 67.3 74.4<br />
15-24 80.0 66.0 73.0 83.1 73.3 78.2 79.5 74.8 77.0 65.8 62.1 63.9<br />
15-64 90.3 67.8 78.8 91.7 74.4 82.6 90.4 79.8 84.8 82.0 68.3 75.1<br />
25-54 97.0 69. 5 82.7 97.6 77.4 86.9 97.1 84.8 90.6 93.2 73.3 83.0<br />
25-34 96.1 69.8 82.0 97.9 80.2 88.4 96.7 85.7 90.8 91.8 73.5 82.2<br />
35-54 97.8 69.3 83.3 97.4 75.2 85.6 97.4 84.0 90.4 94.3 73.1 83.7<br />
55-64 93.6 62.5 79.2 91.5 54.3 73.6 94.5 66.6 80.8 90.1 63.5 77.7<br />
65+ 79.9 43.5 64.1 65.7 27.5 48.8 73.4 35.1 56.3 74.4 48.9 63.1<br />
Source: CSA, Calculated based on 1999 &2005 Labour force survey and 1994 & 2007 Census.<br />
In contrast, the participation rate of older persons in the labour market, especially women, has<br />
increased. This was the case for those aged 65 + after 2005.<br />
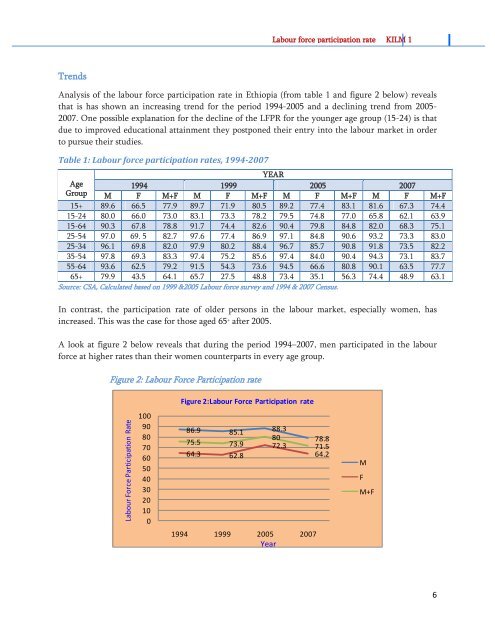
A look at figure 2 below reveals that during the period 1994–2007, men participated in the labour<br />
force at higher rates than their women counterparts in every age group.<br />
Figure 2: Labour Force Participation rate<br />
Figure 2:Labour Force Participation rate<br />
100<br />
90<br />
80<br />
70<br />
60<br />
50<br />
40<br />
30<br />
20<br />
10<br />
0<br />
86.9 85.1<br />
88.3<br />
80<br />
75.5<br />
78.8<br />
73.9 72.3 71.5<br />
64.3 62.8<br />
64.2<br />
M<br />
F<br />
M+F<br />
1994 1999 2005 2007<br />
Year<br />
6