

Ethiopia KILM
Ethiopia KILM
Ethiopia KILM
- No tags were found...

You also want an ePaper? Increase the reach of your titles
YUMPU automatically turns print PDFs into web optimized ePapers that Google loves.
Annex tables Annex 2<br />
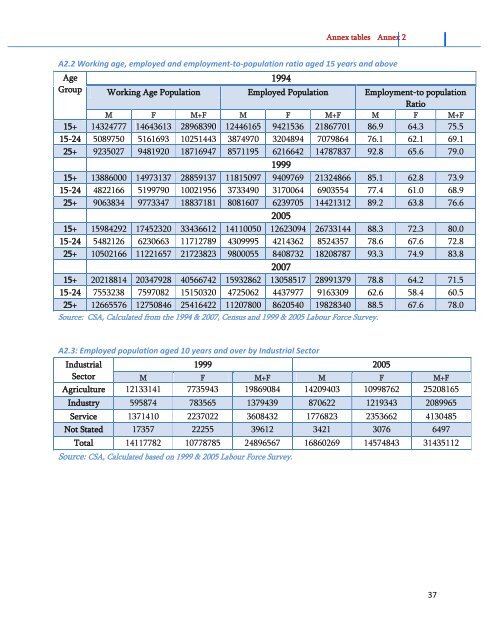
A2.2 Working age, employed and employment-to-population ratio aged 15 years and above<br />
Age<br />
1994<br />
Group Working Age Population Employed Population Employment-to population<br />
Ratio<br />
M F M+F M F M+F M F M+F<br />
15+ 14324777 14643613 28968390 12446165 9421536 21867701 86.9 64.3 75.5<br />
15-24 5089750 5161693 10251443 3874970 3204894 7079864 76.1 62.1 69.1<br />
25+ 9235027 9481920 18716947 8571195 6216642 14787837 92.8 65.6 79.0<br />
1999<br />
15+ 13886000 14973137 28859137 11815097 9409769 21324866 85.1 62.8 73.9<br />
15-24 4822166 5199790 10021956 3733490 3170064 6903554 77.4 61.0 68.9<br />
25+ 9063834 9773347 18837181 8081607 6239705 14421312 89.2 63.8 76.6<br />
2005<br />
15+ 15984292 17452320 33436612 14110050 12623094 26733144 88.3 72.3 80.0<br />
15-24 5482126 6230663 11712789 4309995 4214362 8524357 78.6 67.6 72.8<br />
25+ 10502166 11221657 21723823 9800055 8408732 18208787 93.3 74.9 83.8<br />
2007<br />
15+ 20218814 20347928 40566742 15932862 13058517 28991379 78.8 64.2 71.5<br />
15-24 7553238 7597082 15150320 4725062 4437977 9163309 62.6 58.4 60.5<br />
25+ 12665576 12750846 25416422 11207800 8620540 19828340 88.5 67.6 78.0<br />
Source: CSA, Calculated from the 1994 & 2007, Census and 1999 & 2005 Labour Force Survey.<br />
A2.3: Employed population aged 10 years and over by Industrial Sector<br />
Industrial<br />
1999 2005<br />
Sector<br />
M F M+F M F M+F<br />
Agriculture 12133141 7735943 19869084 14209403 10998762 25208165<br />
Industry 595874 783565 1379439 870622 1219343 2089965<br />
Service 1371410 2237022 3608432 1776823 2353662 4130485<br />
Not Stated 17357 22255 39612 3421 3076 6497<br />
Total 14117782 10778785 24896567 16860269 14574843 31435112<br />
Source: CSA, Calculated based on 1999 & 2005 Labour Force Survey.<br />
37