PSEUDO STATIC PILE LOAD TESTER A.J.G. ... - Profound BV
PSEUDO STATIC PILE LOAD TESTER A.J.G. ... - Profound BV
PSEUDO STATIC PILE LOAD TESTER A.J.G. ... - Profound BV
- No tags were found...

Create successful ePaper yourself
Turn your PDF publications into a flip-book with our unique Google optimized e-Paper software.
<strong>PSEUDO</strong> <strong>STATIC</strong> <strong>PILE</strong> <strong>LOAD</strong> <strong>TESTER</strong><br />
A.J.G. Schellingerhout 1 and E. Revoort 2 .<br />
Abstract<br />
For fast and economic testing of piles Fundex Piling and IFCO have jointly<br />
developed a new testing equipment: the Pseudo Static Pile Load Tester which is<br />
mounted on tracks and is able to execute full scale load tests under compression.<br />
Following paper describes the theoretical backgrounds and some test cases of this<br />
ready to use method.<br />
General<br />
An important question to be asked for any pile is, what is its real bearing<br />
capacity? Although static load testing is reliable, the major disadvantages are the high<br />
costs involved and the long time required. These reasons do not allow an often and<br />
regular use. Due to the commonly accepted Dutch cone penetration test in The<br />
Netherlands most engineers determine the pile bearing capacity by the method of<br />
Koppejan and others (also known as the 4D-8D method). This method has proven itself<br />
over the past decennia, however, recent disagreements were noted [1].<br />
Many West European countries have standard rules for determining the actual<br />
bearing capacity and the quality control which requires a certain number or percentage<br />
of static load tests at major projects. A relatively cheap alternative for the static load<br />
test is the dynamic load test, testing the pile only for a few milliseconds. The major<br />
objection of this method is the fact that the measured bearing capacity is a combination<br />
of both a static and a dynamic component. By means of pile modelling, only specialist<br />
engineers are able to derive the static component from the analyses.<br />
During the past few years new developments have improved dynamic load<br />
testing. It was expected that extending the loading time to a multiple period of<br />
milliseconds would substantially reduce the dynamic component of the measured<br />
bearing capacity. Such developments would simplify the interpretation significantly.<br />
These new quasi or "pseudo" static loading techniques emphasize the static element.<br />
Examples are Statnamic and the here described Pseudo Static Pile Load Tester<br />
(PSPLT).<br />
Theoretical background<br />
1 IFCO <strong>BV</strong> Limaweg 17 2743 CB Waddinxveen The Netherlands<br />
2 Funderingstechnieken Verstraeten <strong>BV</strong> (Fundex) Brugsevaart 6 4501 NE Oostburg The Netherlands
The most important advantage of the dynamic load test versus a static test is that<br />
devices for reaction forces are not required, such as reaction piles or heavy kentledge.<br />
During dynamic load tests the force F is the result of a change of momentum. Its relation<br />
is presented by<br />
in which<br />
r r<br />
p = ∫ Fdt = mv<br />
pre<br />
− mv<br />
post<br />
(1)<br />
m = the mass used for the test and v pre and v post are the velocities of the mass, before<br />
and after the interaction with the pile<br />
In the equation the principle of action = negative reaction can be recognised.<br />
The action force is exercised on the pile and the reaction force on the dropmass.<br />
Equation (1) is simplified by neglecting gravity, since this is very small related to the<br />
executed force during the load. Should gravity accelerate or decelerate the dropmass,<br />
equation (1) can be recalculated to a height with<br />
v<br />
= 2 gh<br />
(2)<br />
in which<br />
g = acceleration of gravity<br />
h = height of the mass before or after the test<br />
0<br />
-5<br />
Figure 1. The load settlement<br />
curve calculated for a dynamic, a<br />
pseudo static, and a static load<br />
test. The parameters are: soil<br />
stiffness = 0.28 GN/m, soil<br />
impedance (= damping)= 1.3<br />
MNs/m, wave velocity = 4180<br />
m/s, pile length = 16.4 m, pile<br />
area = 0.4x0.4 m 2 and the<br />
Youngs modulus= 42 GN/m 2 .The<br />
force as a function of time is (1-<br />
cos(t)). The t 50% is 4 ms for the<br />
dynamic test and 40 ms for the<br />
pseudo static test.<br />
displac eme nt [mm]<br />
-10<br />
-15<br />
-20<br />
-25<br />
Simula tion<br />
dyna mic load test t 50%<br />
= 4 ms<br />
quasi sta tic l oa d te st t = 40 ms<br />
50%<br />
static load test<br />
k =0.17 G N/m<br />
-30<br />
0 0.5 1 1.5 2 2.5 3 3.5 4<br />
forc e [MN ]
During a dynamic load test the magnitude of the exerted force is comparable to<br />
the ultimate pile bearing capacity. Equation (1) shows the relation of duration of the<br />
load on the pile with the change of momentum. Extending the load time requires<br />
increasing mass or velocity. The duration indicates how "static" the load test is. A<br />
definition of this time is the duration of which the load is above a certain percentage of<br />
the maximum load. The percentage is usually 50 %, (so called t 50 % ). When different<br />
systems are to be compared identical definitions for this time scale must be used.<br />
The duration t 50% of a loadtest performed with Statnamic can be calculated<br />
using formulas (1) and (2). For the mass it is advised to take 5-10 % of the pile's<br />
ultimate bearing capacity [9], velocity v pre = 0 m/s, assuming that the mass reaches a<br />
height of 1.5 m, and that the force as function of time has a triangular shape, then the<br />
duration of the load is:<br />
t<br />
50%<br />
01 . Fultimate<br />
2gh<br />
m 2gh<br />
g<br />
h<br />
= = = 01 . 2 ≈ 50ms<br />
(3)<br />
F<br />
F<br />
g<br />
ultimate<br />
ultimate<br />
in which<br />
t 50 % = is the duration where the force exceeds 50 % of the maximum force<br />
F ultimate = the ultimate pile bearing capacity<br />
The forcepuls deployed to the pilehead generates a shock wave into the pile.<br />
The travelling time of the wave from the pilehead to the piletoe and vice versa causes a<br />
delay in the response to the reaction forces of the subsoil. This is why for loads of<br />
relatively short duration only the velocity of the pile head is used for the analysis<br />
instead of displacement. The duration of the load should be compared with the wave<br />
travelling time. A load becomes quasi-static when:<br />
t<br />
in which<br />
50%<br />
2l<br />
>> (4)<br />
c<br />
l = the pile length<br />
c = wave velocity in the pile (approx. 4000 m/s for concrete, and 5100 m/s for steel)<br />
Figure 1 shows calculations of load-settlement curves for three loading<br />
techniques on a simplified pile-soil model. The pile has a length of 16.4 m, a crosssectional<br />
area of 0.4 x 0.4 m², and a wave velocity of 4180 m/s. The piletoe reaction<br />
force is generated by a pure elastic spring, and the pile has no side friction. From fig. 1<br />
can be read that the quasi-static testmethod very well approaches the elastic loadsettlement<br />
curve. The shape of the looped curve is caused by the time delay between<br />
load and settlement and does not relate to the shaft friction, since that is lacking in this<br />
simple model.
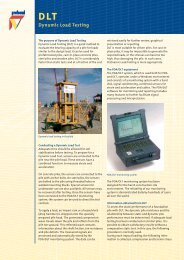
Pseudo Static Pile Load<br />
Tester<br />
The PSPLT is<br />
especially designed to<br />
execute quasi-static<br />
load tests (fig. 2). The<br />
load test is carried out<br />
by means of dropping a<br />
heavy mass with a<br />
coiled spring assembly<br />
from a predetermined<br />
height onto a single pile.<br />
After the hit the mass<br />
bounces and is caught in<br />
its highest position. The<br />
principle of the PSPLT<br />
was previously<br />
described in [3].<br />
According to equation<br />
(1), this loading method<br />
Figure 2. Drawing of the PSPLT.<br />
gives almost a double<br />
momentum change using the mass efficiently. Efficiency is further increased by catching<br />
the bouncing mass, which makes larger dropheights possible. This also avoids further<br />
hindrance to the test and the measurements. The instrumentation for the test consists of a<br />
load cell and an optical displacement measuring device. The load cell which is placed<br />
on top of the pile is almost identical to the one used during static load tests. Pilehead<br />
displacement is recorded with the optical device mounted on a tripod at a distance of<br />
approx. 10 m from the pile. It is furthermore equipped with a geophone to monitor<br />
vibrations of the tripod during the test. All measured signals are immediately processed<br />
by a computer and presented in relevant graphs.<br />
The execution of a test is as follows: the PSPLT is brought to the test site by a<br />
low-loader. It moves on its tracks to the testpile, whose pile head has previously been<br />
prepared. When the rig is positioned and the measuring devices are attached the test<br />
can start. First a static load test is carried out with the weight of the dropmass. Then<br />
subsequently a number of loads are deployed to the pile by dropping the mass from<br />
increasing heights onto the pile. With the output of results a quasi-static load-settlement<br />
curve is produced. Then the next pile can be tested. It is possible to load-test a<br />
significant number of piles per single working day. With proper preparations on the test<br />
site and the pileheads more than 10 piles daily have been tested.<br />
The load of the PSPLT can be described by a simple model: a mass m, with a<br />
spring k, is dropped from a height h onto a rigid base. The values of m and k are
espectively 25.000 kg and 8 MN/m, height h is equal to zero when the spring touches<br />
the base. The maximum force is then represented as:<br />
⎛ kh<br />
Fmax = mg<br />
⎛ 2 ⎞ ⎞<br />
⎜ + 1⎟ + 1 mgkh<br />
⎜<br />
⎝ ⎝ mg ⎠ ⎟ ≈ 2 (5)<br />
⎠<br />
The duration of the load is between<br />
maximum forc e [kN]<br />
4000<br />
3500<br />
3000<br />
2500<br />
2000<br />
1500<br />
1000<br />
500<br />
m 2π<br />
m<br />
175ms<br />
≈ π > t50%<br />
> ≈ 117ms<br />
k 3 k<br />
maximum force as a func tion of dropheight<br />
m =25000 kg k= 8 MN/ m<br />
0<br />
0 0.2 0.4 0.6 0.8 1 1.2 1.4 1.6 1.8 2 2.2 2.4 2.6 2.8 3<br />
drophe ight [m]<br />
Figure 3. Maximum force as a function of dropheight.<br />
force [kN]<br />
4000<br />
3500<br />
3000<br />
2500<br />
2000<br />
1500<br />
1000<br />
forc e of the PSPLT as a func tion of time<br />
h =3.00 m F max<br />
= 3685 kN t 50%<br />
=122 ms<br />
h =1.50 m F max<br />
= 2684 kN t 50%<br />
=124 ms<br />
h =0.50 m F max<br />
= 1667 kN t 50%<br />
=128 ms<br />
h =0.00 m F max<br />
= 490 kN t 50%<br />
=176 ms<br />
Static F max<br />
= 245 kN<br />
(6)<br />
Figure 3 shows<br />
equation (5) in a graph with<br />
the parameters of the PSPLT.<br />
Figure 4 shows the force as<br />
function of time. The duration<br />
of the load t 50 % has a small<br />
dependence of the dropheight.<br />
The above described model is<br />
a good approximation of the<br />
force exerted by the PSPLT as<br />
a function of time. However,<br />
an error is caused by the<br />
simplification of the coil<br />
springs being massless. The<br />
assumption of a rigid base is<br />
justified, because the<br />
displacement of the pile<br />
during loading is far less than<br />
the compression of the coiled<br />
springs. A complete model was<br />
also made, including the spring<br />
mass [4]. The mass effects of<br />
the coiled springs in the PSPLT<br />
are minimized by using<br />
additional rubber springs and<br />
by creating a time delay<br />
between subsequent coils<br />
hitting the base plate.<br />
500<br />
0<br />
0 50 100 150 200 250 300 350<br />
time [ms]<br />
Figure 4. The force as a function of time for different dropheights. The insert<br />
shows the different values for t 50% ..
Results and interpretation<br />
force [kN]<br />
pilehead dis placement [mm]<br />
2000<br />
1500<br />
1000<br />
500<br />
2<br />
0<br />
-2<br />
-4<br />
-6<br />
-8<br />
-10<br />
-12<br />
-14<br />
0<br />
0 100 200 300 400 500 600 700 800<br />
time [ms ]<br />
0 100 200 300 400 500 600 700 800<br />
time [ms]<br />
Figure 5. The measured force exerted by the PSPLT and the<br />
measured displacement of the pilehead as a function of time.<br />
between piles can easily be detected.<br />
At various sites in The<br />
Netherlands, Belgium and<br />
Germany the PSPLT has been<br />
used successfully. Some results<br />
of these tests are presented in<br />
figures 5, 6 and 7. When these<br />
test results were matched with<br />
available static load tests, it<br />
was observed that the PSPLT<br />
results were some-what<br />
optimistic for the ultimate pile<br />
bearing capacity. However, the<br />
tests gave a very good<br />
indication with respect to<br />
individual differences. In other<br />
words: better performance<br />
measured by the PSPLT gave<br />
equally better results in the<br />
static load test. Especially in<br />
the elastic behaviour of the pile<br />
the load-settlement curve is<br />
identical to the load-settlement<br />
curve of the static load test.<br />
This phenomenon made it<br />
useful to find "heaved" piles<br />
[5]. The differences in stiffness<br />
A difference between the results of both PSPLT and static load tests at ultimate<br />
bearing capacity was not expected. The Smith-model [6] is generally used to interpret<br />
the influence of the velocity for dynamic tests. This model predicts for quasi-static pile<br />
load tests a significant reduction of the velocity dependant component. The result from<br />
the quasi-static tests showed that the parameters for the model are not applicable.<br />
Therefore, results from tests in soils (like in The Netherlands) should be corrected,<br />
something which is apparently not required in cases where piletips are embedded in<br />
hard strata or rock [7]. This correction can be made by using the models from "short<br />
term" dynamic load tests with new values for the parameters [8]. Furthermore, a new<br />
simplified model for correction to ultimate bearing capacity is proposed [9].<br />
Experience gained with the PSPLT results show that the present models are not<br />
yet completely satisfactory. The creep behaviour of the bearing soil layer is not<br />
considered and this is a likely explanation why the measured ultimate bearing capacity<br />
derived from the PSPLT is larger than measured with a static load test. The same<br />
phenomenon is also observed when bearing capacities were obtained by means of fast
0<br />
PSPLT measurement of heaved pile<br />
continuous line<br />
-5<br />
pilehead displacement [mm]<br />
-10<br />
-15<br />
-20<br />
0 200 400 600 800 1000 1200 1400 1600 1800 2000<br />
force [kN]<br />
Figure 6. The load displacement curve generated by four consecutive dropheights. The continuous load settlement curve<br />
is also shown.<br />
executed static load tests (15 min.). Such tests showed better (=higher) results,<br />
compared to standard static tests [10].<br />
Further investigation will be necessary to find a better relation between the<br />
results of the pseudo static load test and those of the common static test. The lack of<br />
adequate and useful comparison tests is the reason that such a match has not yet been<br />
well defined.<br />
Loadtest Maasvlakte Rotterdam<br />
0<br />
-10<br />
displacement [mm]<br />
-20<br />
-30<br />
-40<br />
concrete pile nr:6<br />
Results static loadtest<br />
Results PSPLT 12-04-95<br />
-50<br />
0 500 1000 1500 2000 2500 3000 3500 4000 4500 5000<br />
force [kN]<br />
Figure 7. Comparison between a static load test and a measurement with the PSPLT.
Conclusion<br />
In checking the bearing capacity of piles the PSPLT method is quick, cheap and<br />
useful. It offers the possibility to identify the stiffness and bearing capacity of<br />
individual piles in a foundation. So far it is not yet possible to measure static ultimate<br />
bearing capacity with a sufficient degree of accuracy. However, it may be expected that<br />
future investigations will make this possible.<br />
References:<br />
1 Geerling, J., Stoevelaar, R., 1993, Nieuwe bevindingen omtrent een bekend paaltype. Cement nr 4 10-16.(in Dutch)<br />
2 Bermingham P., Janes, M., 1989, An innovative approach to load testing of high capacity piles. Proceedings of the<br />
International Conference on Piling and Deep Foundations, London, pp 409-413.<br />
3 Gonin, H., Coelus, G., Leonard, M.S.M., 1984, Theory and performance of a new dynamic method of pile testing,<br />
Proceedings of the Second International Conference on the Application of Stress Waves on Piles, Stockholm,<br />
Balkema Rotterdam, pp 403-410.<br />
4 Wolters H., Beschrijving van de PSPLT, (not published.)<br />
5 Doornbos, S., Revoort, E.,Schoo, O., Tirkkonen, O., 1994, Comparison of pile loading tests and the phenomenon of<br />
heave at Sachsen paper mill Eilenburg., Proceedings of the fifth International Conference on Piling and Deep<br />
Foundations 13-15 June pp 4.2.1-4.2.12.<br />
6 Smith, E.A. L., 1960, Pile Driving Analysis by the Wave Equation, J. Soil Mech.Found.,ASCE, Vol.86, No. SM4, pp<br />
35-61.<br />
7 Janes, M., Horvath, B.,1991, Pile load test results using the Statnamic method. 4th International DFI Conference at<br />
Stresa, Piling and Deep Foundations, pp 481-489.<br />
8 Chen, Y., Schellingerhout, A.J.G., van Weele, A.F., 1995, A New Pile Base Model for the Analysis of Pile Driving.<br />
Proceedings of the Tenth Asian Regional Conference on Soil Mechanics and Foundation Engineering Aug 29- Sept 2<br />
1995 Beijing China<br />
9 Middendorp, P., Bermingham, P., Kuiper, B., 1992, Statnamic Load Testing of Foundation Piles, Proceedings of<br />
Fourth International Conference on the Application of Stress Waves on Piles, the Hague, Balkema, pp 581-588.<br />
10. de Kruijff, H., Kuiper, B., Vinks, T.J.N., 1993, Europaal, Cement nr 2 pp 6-14.(in Dutch)