Bermingham
Statnamic Engineering of Art Sao Paulo 2000.pdf
Statnamic Engineering of Art Sao Paulo 2000.pdf
- No tags were found...

Create successful ePaper yourself
Turn your PDF publications into a flip-book with our unique Google optimized e-Paper software.
www.profound.nl<br />
Sixth International Conference on the Application of Stress-Wave Theory To Piles 1<br />
Orlando, Sao Paulo, 2000.<br />
Statnamic, the engineering of art<br />
P. Middendorp<br />
Profound, The Netherlands<br />
ABSTRACT: In present standard engineering practice there seems to be a big gap between engineering<br />
and art. It is the experience of the author that engineering and art can exist as an excellent combination. This<br />
will be illustrated by examples from history and the author’s personal experience. One example will be<br />
treated extensively: the continuous development of the Statnamic load testing method as a marvelous combination<br />
of engineering and art. The start of the Statnamic concept is described as an interaction between an artist<br />
and engineers together with developments on the theoretical approaches and technical applications. Further<br />
the present Statnamic state of the art will be discussed briefly.<br />
1 INTRODUCTION<br />
Art was of minor interest to the author when he was<br />
starting his engineering study at the Technical University.<br />
Within a short time his interest got a strong<br />
impulse when he met his present wife, a painter and<br />
artist, at that time studying at the Royal Academy of<br />
Art in The Hague. After assisting here with some<br />
projects he experienced that the “logical” thinking of<br />
engineers is in no way superior to the “associative<br />
and intuitive” thinking of artist in finding practical<br />
solutions, but that both are complimentary and when<br />
combined into an artist-engineer as a person or a<br />
team, can result in marvels.<br />
Still a strong interest of artists for engineering can<br />
be observed in modern art, for example Panamerenko<br />
(1996). The artist-engineers are still among us<br />
and it was the privilege of the author to cooperate<br />
for long period with one of them: Patrick <strong>Bermingham</strong>,<br />
the inventor of Statnamic and the nowadays<br />
President of the <strong>Bermingham</strong>mer company.<br />
During his career the author was impressed by the<br />
many creative solutions of engineers all over the<br />
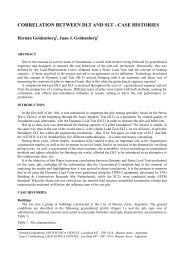
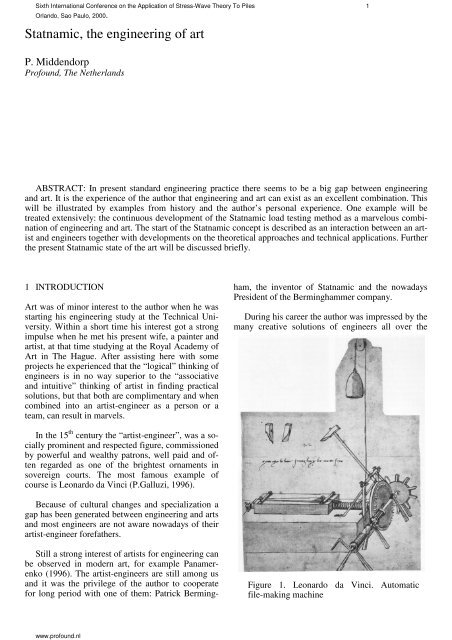
In the 15 th century the “artist-engineer”, was a socially<br />
prominent and respected figure, commissioned<br />
by powerful and wealthy patrons, well paid and often<br />
regarded as one of the brightest ornaments in<br />
sovereign courts. The most famous example of<br />
course is Leonardo da Vinci (P.Galluzi, 1996).<br />
Because of cultural changes and specialization a<br />
gap has been generated between engineering and arts<br />
and most engineers are not aware nowadays of their<br />
artist-engineer forefathers.<br />
Figure 1. Leonardo da Vinci. Automatic<br />
file-making machine
Sixth International Conference on the Application of Stress-Wave Theory To Piles 2<br />
Orlando, Sao Paulo, 2000.<br />
www.profound.nl<br />
world. Many engineers are not aware that their creative<br />
solutions can be considered art and that they act<br />
idea of Fellenius at that time was that dynamic pile<br />
testing would become independent of the piling contractor,<br />
the pile driving rig, and in many instances<br />
contractor’s unionized labor, as well make him and<br />
others free to perform dynamic load testing after a<br />
good and long set up time. This idea was not original<br />
because several such devices were already around,<br />
but Fellenius just needed a local practical tool.<br />
At that time <strong>Bermingham</strong> had just finished a professional<br />
education as a sculpturer in London and<br />
worked also for the <strong>Bermingham</strong> pile driving and<br />
hammer manufacturing company. From his childhood<br />
on Patrick was interested in both engineering<br />
and art and supplied, for example, several ideas for<br />
improvement to the <strong>Bermingham</strong>mer pile driving<br />
hammers.<br />
It was not such a strange idea that the <strong>Bermingham</strong>mer<br />
Company chose Patrick to come up with a<br />
design for a drop hammer. Patrick contacted Fellenius<br />
and suggested a pile loading system design<br />
from a fully different viewpoint compared to standard<br />
engineers.<br />
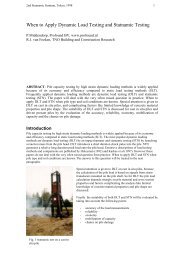
“Why do engineers want to drop the weight, why<br />
do they not send it up into the air?”<br />
Figure 2. Early sketch of a Statnamic piston and<br />
cylinder arrangement by Patrick <strong>Bermingham</strong><br />
as “engineer-artist”. In this paper the author wants to<br />
illustrate his view by using the Statnamic development<br />
as an example in which one “artist-engineer”<br />
and many “engineer-artist” contributed with creative<br />
ideas and solutions.<br />
Intuitively he converted Newton’s Law from<br />
Force = Mass times Acceleration<br />
To<br />
Mass times Acceleration = Force (Load)<br />
This concept needed a few months to evolve and<br />
The Statnamic development will be described by<br />
introducing the start of Statnamic together with<br />
some milestones, theoretical approaches and technical<br />
applications. Further the present research and<br />
developments will be mentioned and problems that<br />
still have to be solved.<br />
2 THE STATNAMIC CONCEPT<br />
Patrick <strong>Bermingham</strong> (1998) got the first idea about<br />
the Statnamic concept in Hamilton in 1985 while<br />
watching a static load test with kentledge, when he<br />
first thought about utilizing the inertia of the<br />
kentledge (Fig. 2).<br />
According to Fellenius (1995) the idea for the Statnamic<br />
concept was born in 1987 when he asked Patrick<br />
<strong>Bermingham</strong> to design a drop hammer for impacting<br />
a pile to perform dynamic load tests. The<br />
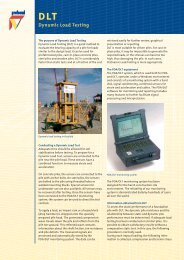
Figure 3. First Statnamic device with accelerometer<br />
and early catch mechanism.
Sixth International Conference on the Application of Stress-Wave Theory To Piles 3<br />
Orlando, Sao Paulo, 2000.<br />
www.profound.nl<br />
<strong>Bermingham</strong> made a first prototype (Figure 3) and<br />
started experiments by shooting masses upwards in<br />
Hamilton, Ontario in April 1988. He determined the<br />
feasibility of accelerating a mass upwards from the<br />
top of the foundation rather than dropping a mass<br />
onto the foundation<br />
<strong>Bermingham</strong> also tried out several concepts of<br />
catching the reaction mass when falling back from<br />
launching and also here creative ideas from the “artist-engineer”<br />
can be observed, especially the gravel<br />
catching mechanism based on the reliable gravity of<br />
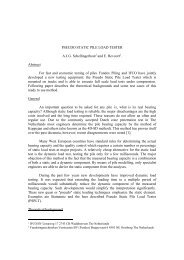
the earth (Fig.4). With the gravel mechanism a<br />
gravel container is placed around the reaction mass<br />
and the space between gravel container and reaction<br />
mass is filled with gravel. During testing four successive<br />
stages can be distinguished. In stage 1 the<br />
Statnamic device is ready for launching. In stage 2<br />
the reaction mass is launched upwards by highpressure<br />
gases. During this stage the pile is loaded<br />
and a Statnamic test performed. Because of the momentum<br />
the reaction mass will remain moving upward<br />
in stage 3 and the gravel will flow under the<br />
reaction mass and over the pile head because of<br />
gravity. In stage 4 the reaction mass will fall back<br />
and will be caught by the gravel inside the container<br />
and the impact load will not be transferred to the pile<br />
head but to the subsoil. This creative, simple and<br />
elegant principle is still applied as one of the methods<br />
in absorbing the energy from the falling reaction<br />
mass.<br />
Figure 4. First Statnamic trial tests.<br />
<strong>Bermingham</strong> presented his results and ideas to<br />
several parties and also to the author at the OTC<br />
(Offshore Technology Conference) at Houston in<br />
1988. Based on the combination of his engineering<br />
background and experience with ideas of artists, the<br />
author immediately recognized the beauty and<br />
power of <strong>Bermingham</strong>'s idea for pile testing applications.<br />
<strong>Bermingham</strong>mer and TNO agreed to start a joint<br />
development and decided to do the first prototype<br />
testing immediately after the Third Stress Wave<br />
Conference at Ottawa in 1988. With the help of<br />
Fokke Reiding and Matthew Janes they realized that<br />
the long duration feature of the load allowed a fully<br />
different approach in instrumentation and analysis<br />
compared to dynamic load testing.<br />
It was decided to base the load measurement on a<br />
calibrated load cell, to make the measurement independent<br />
from pile material properties and to measure<br />
displacement directly by the use of an electronic<br />
theodolite. The electronic theodolite was a rather<br />
expensive instrument and a new tool for measuring<br />
displacement was developed based on a laser and a<br />
laser sensor, which is still in use. So the basis of<br />
measurements became load-time signals and displacement-time<br />
signals similar to static load testing.<br />
3 FIRST DEVELOPMENTS<br />
Figure 5. Successive stages of Statnamic<br />
Testing.<br />
In May of 1988 the first model tests where performed<br />
with instrumentation provided by T'NO.<br />
These first two days of testing confirmed the ability<br />
of the very small Statnamic device to produce loads
Sixth International Conference on the Application of Stress-Wave Theory To Piles 4<br />
Orlando, Sao Paulo, 2000.<br />
of up to 5 tons with duration of up to 30 ms. From<br />
this point onwards the direction of Statnamic was<br />
upwards. A second model was built and sent to<br />
TNO in Holland where the instrumentation would be<br />
developed. In the laboratory at TNO, Statnamic<br />
tests were performed using a calibrated load cell and<br />
a new laser measuring system developed specifically<br />
for the Statnamic test. Both measuring systems<br />
worked very well the first day and they have remained<br />
virtually unchanged to this date.<br />
The next step was to build a Statnamic tester,<br />
which incorporated the instrumentation and was<br />
large enough to test a real pile in the ground. A 0.6<br />
MN tester was built, which was one tenth of full<br />
scale, but still able to test small piles driven into real<br />
soil. This load-testing device was first used to test<br />
piles in the <strong>Bermingham</strong>mer yard in Hamilton,<br />
McMaster University, and Ashbridges Bay. Since<br />
that time it has performed tests in Europe, Japan, and<br />
the United States. The primary objective of this<br />
equipment was to prove the durability of the instrumentation<br />
in all weather conditions, and to prove the<br />
practicality of the equipment in the field. This<br />
equipment was also used to make the first comparisons<br />
between conventional static load tests and the<br />
new load test method. The 0.6 MN device proved<br />
that Statnamic testing could be performed in all<br />
types of adverse weather including rain and snow. It<br />
also proved the simplicity and practicality of the system<br />
in the field and the first load test comparisons<br />
proved an unexpectedly close agreement with conventional<br />
static load tests. The success of this first<br />
prototype enabled <strong>Bermingham</strong>mer to manufacture<br />
of a full-scale 5MN tester.<br />
Statnamic was first called Inertial load testing<br />
Figure 7. Set up of a 5MN Statnamic device with<br />
gravel catch mechanism<br />
(<strong>Bermingham</strong>, P., et all., 1989. The author gave the<br />
method its present name Statnamic, realizing that<br />
the method was positioned between Static load testing<br />
and Dynamic load testing.<br />
From the very beginning Statnamic was an international<br />
development rather than a regional or national<br />
development. Testing of driven and cast insitu<br />
piles was carried out in Canada, Holland,<br />
Germany and the United States during the first two<br />
years.<br />
At this time all of the testing was conducted with<br />
the aim of gaining a better understanding of the behavior<br />
of piles subjected to very quick loading cycles.<br />
Statnamic and static load tests were conducted<br />
side by side as well as on the same pile in as many<br />
different soil types as possible. Every effort was<br />
made to collect as much data as possible and to<br />
avoid making predictions about the static behavior<br />
of a foundation until we could collect a wide range<br />
of test results. Today many companies and universities<br />
are still collecting and expanding this worldwide<br />
database.<br />
Figure 6. Patrick <strong>Bermingham</strong> launching a<br />
0.6MN device<br />
www.profound.nl<br />
The first two years of research revealed a great<br />
deal about pile behavior when subjected to a Statnamic<br />
load of 120ms duration. It was observed that<br />
in the elastic range there was a very good agreement<br />
between static load deflection and Statnamic load<br />
deflection, it was observed that in very soft soils and<br />
clays it was possible to apply a much larger load
Sixth International Conference on the Application of Stress-Wave Theory To Piles 5<br />
Orlando, Sao Paulo, 2000.<br />
www.profound.nl<br />
than a static load prior to plunging the pile. In stiff<br />
non-cohesive soils and rock sockets it was observed<br />
that there was very close agreement between Statnamic<br />
load test results and static load tests performed<br />
along side. It was also observed that the sequence<br />
of loading a foundation had a great effect on<br />
the perceived similarity of test results and this had to<br />
be taken into account. It was also observed that during<br />
a typical Statnamic test the pile would reach<br />
maximum displacement at some time after peak<br />
force had been applied. In other words the pile<br />
would continue to move downwards while the applied<br />
load at the pile top was decreasing. At the<br />
point where the pile reached maximum displacement<br />
the velocity of the pile was zero and then the pile<br />
would begin to rebound as the load was further decreased.<br />
This observation which was present in<br />
nearly all test results except very stiff piles on rock,<br />
lead to the development of the Unloading Point<br />
Method (UPM) by the author (P. Middendorp,<br />
1992).<br />
4 METHODS OF ANALYSIS<br />
From the very start of development there has<br />
been a determined effort to make Statnamic a means<br />
of measuring rather than a prediction method. This<br />
has meant putting a very strong emphasis on using<br />
accurate measuring equipment and recording equipment.<br />
The measured data will then be more reliable<br />
and may then be examined more closely. From the<br />
beginning we have been observing the behavior of<br />
foundations subjected to very rapid loading with a<br />
view to being able to better understand the mechanism<br />
of failure during a Statnamic test. In the end it<br />
is hoped that Statnamic testing will stand alone as a<br />
rapid test with a distinct method of analysis, which<br />
will measure the load deflection behavior and determine<br />
the factor of safety of the foundation.<br />
The first approach to analyzing failure was to<br />
look to the displacement curve and to analyze the<br />
rate of change of displacement, or velocity of the<br />
pile. Normalizing the load and plotting load vs. velocity<br />
was examined in an effort to pinpoint the load<br />
at which the velocity begins to increase. This only<br />
worked well when the foundation experienced a<br />
plunging failure, and it did not work well when the<br />
pile was in a cohesive material.<br />
Statnamic test results were also evaluated with a<br />
simple 2.5mm offset method, which was analogous<br />
to the Davisson failure criterion but much more conservative.<br />
All three of these methods of determining<br />
the point of failure were far too subjective to be of<br />
any great value.<br />
In January of 1993, while reviewing the results of<br />
pile 7 at Texas A&M the author noticed that during<br />
the unloading of the test the velocity of the shaft<br />
reached zero at a load, which corresponded closely<br />
to the ultimate static resistance. The foundation began<br />
to rebound as the load was further decreased.<br />
PDA users had observed the significance of the<br />
point of zero velocity in the 1970's and some attempts<br />
were made to make use of it. However, during<br />
pile driving the point of zero velocity at the pile<br />
head does not correspond to zero velocity anywhere<br />
else in the pile unless the pile is very short and rigid.<br />
The author’s observation provided both a practical<br />
means of determining a significant point on the<br />
static load displacement curve and also a means of<br />
estimating the damping coefficient directly from the<br />
test results rather than from a soil boring. This<br />
Unloading Point Method (UPM) assumed that the<br />
damping was a constant, which was zero when the<br />
velocity was zero, and that the pile was behaving as<br />
an elastic body, which could be treated as a lumped<br />
Initially no attempt was made to convert the results<br />
of Statnamic load testing into quasi-static load<br />
test results, because they would loose integrity in the<br />
process. What was recognized was that every Statnamic<br />
test result was unique and that very small differences<br />
in the relative stiffness of two different<br />
foundations could be measured accurately. Much<br />
like the dynamic resistance of a driven pile, it is very<br />
useful even though there is no direct correlation to<br />
static resistance.<br />
The Statnamic test has been described as applying<br />
a controlled strain while monitoring corresponding<br />
deflection. When a test is performed, a predetermined<br />
load is applied and the resulting deflection is<br />
measured.<br />
DLT<br />
DLT<br />
signal matching<br />
yes<br />
pseudo<br />
STN<br />
no<br />
UPM & stress wave<br />
corrections<br />
N w < 6<br />
no<br />
N w > 1000<br />
no<br />
N w > 12<br />
yes<br />
yes<br />
STN<br />
UPM, no stress<br />
wave corrections<br />
Static load displacement behaviour<br />
SLT<br />
Figure 8. Stress wave influences as function of<br />
wave number N w
Sixth International Conference on the Application of Stress-Wave Theory To Piles 6<br />
Orlando, Sao Paulo, 2000.<br />
www.profound.nl<br />
mass and a spring. Subsequent research has concentrated<br />
on testing these assumptions and determining<br />
the limit of their validity. The unloading point<br />
method has provided a very simple universal method<br />
of analysis and was first published at the 4 th International<br />
Conference on Stress Waves in 1992. The basic<br />
principles of the method have been presented in<br />
the Appendix.<br />
The UPM method is based on the assumption that<br />
stress wave phenomena can be neglected. The author<br />
studied the validity of the method with the stress<br />
wave program TNOWAVE (1996) by varying the<br />
pile length with constant load duration. To quantify<br />
the stress wave influence he assumed a wave number<br />
constant N w = D/L, in which D = c.T and T the<br />
duration of the load, c the stress wave velocity and L<br />
the pile length. In this way it was possible to indicate<br />
when stress wave phenomena could be neglected<br />
and when they should be taken into account.<br />
A valuable extension to the UPM method is the<br />
“Modified UPM” (M-UPM) by Justason (1997). The<br />
method simply involves the averaging of the top and<br />
toe velocity and acceleration for calculating the inertia<br />
and damping. The method can be applied to any<br />
length of pile, but becomes more necessary as the<br />
pile becomes longer (low N w numbers). The standard<br />
UPM method assumes that pile top velocity and<br />
pile toe velocity are in the same range. The M-UPM<br />
method is particularly useful when the pile top and<br />
pile toe velocity are not in the same range (elastic<br />
pile, high toe resistance). Averaging the pile top and<br />
pile toe velocities and accelerations yields more accurate<br />
inertia and damping forces. The method<br />
yields the best results when used in conjunction with<br />
an embedded toe accelerometer.<br />
Prof. Gray Mullins of the University of South<br />
Florida made an additional improvement to the M-<br />
UPM method, the "Segmental Unloading Point" S-<br />
UPM. This method uses measured strain gage data<br />
to separate the pile into "segments" and perform an<br />
M-UPM on each segment. The data for each segment<br />
are added together to produce a total "derived<br />
static" load-displacement for the top of the pile. The<br />
S-UPM can be applied to any pile, so long as the<br />
pile has strain gages distributed over the pile shaft.<br />
The first application was the Taipei Financial Center<br />
in Taiwan - 1999.<br />
The S-UPM method is briefly described below.<br />
The Segmental Unloading Point Method extends the<br />
applicability of M-UPM to long piles. All assumptions<br />
of the Unloading Point Method remain valid.<br />
The Segmental Method assumes each segment of a<br />
pile behaves as a single degree of freedom system.<br />
The method requires embedded strain gauge data. A<br />
measure of toe displacement is desirable. All results<br />
are based on measured quantities.<br />
F = ε E A<br />
i<br />
i<br />
i<br />
i<br />
where F i is the measured force at level i, ε i is the<br />
measured strain at level i (typically an average of all<br />
strain gages at level i), E i is the calculated (or assumed)<br />
elastic modulus at level i, and A i is the calculated<br />
(or assumed) area at level i<br />
⎛ ε + ε ⎞<br />
+ ⎟<br />
⎝ 2 ⎠<br />
i i+<br />
1<br />
u<br />
i<br />
= ui<br />
1<br />
− ⎜ Li+<br />
1<br />
where u i is the calculated displacement at level i,<br />
L i is the length of the pile segment between levels i<br />
and i+1<br />
d ⎛ ui<br />
+ ui<br />
⎜<br />
dt ⎝ 2<br />
+ 1<br />
vi<br />
=<br />
⎞<br />
⎟<br />
⎠<br />
wherev i<br />
is the first derivative with respect to time<br />
of the average displacement for the pile segment between<br />
levels i and i+1<br />
a<br />
i =<br />
where<br />
time of v<br />
i<br />
dvi<br />
dt<br />
ai<br />
is the first derivative with respect to<br />
The Unloading Point method is performed on<br />
each pile segment using the following equation:<br />
F − S − c v = m a<br />
i<br />
− Fi<br />
− 1<br />
i<br />
i<br />
i<br />
where S i is the equivalent static force for the<br />
segment between F i and F i-1<br />
S i represents the friction forces on the each pile<br />
segment, with the exception of the bottom pile segment,<br />
which also has some component of end bearing.<br />
m i is the mass of the pile segment between i<br />
and i-1.<br />
The cumulative derived static force at each level<br />
can be calculated by the following equation:<br />
F<br />
∑<br />
= n STATn<br />
i=<br />
1<br />
S<br />
i<br />
where n is the pile level number, and F STATn is the<br />
cumulative derived static force at each level.<br />
i<br />
i
Sixth International Conference on the Application of Stress-Wave Theory To Piles 7<br />
Orlando, Sao Paulo, 2000.<br />
www.profound.nl<br />
The derived static load displacement curve can be<br />
drawn at each strain gage elevation using F STATn and<br />
u i .<br />
Each of the above variables represents an entire<br />
data set measured over time.<br />
The S-UPM was first used for the Taipei Financial<br />
Center for 80m piles in 1999<br />
5 THE HYDRAULIC CATCH MECHANISM<br />
Hydraulic catching systems eliminate the need for<br />
gravel and gravel structure since the upward moving<br />
reaction masses are caught at the top of their flight<br />
by four hydraulic actuators (or rams). These 3.2m<br />
stroke rams are activated by four low pressure (100<br />
bar) nitrogen accumulators, which store compressed<br />
nitrogen gas over hydraulic oil. As the weight on the<br />
rams is released during a test, the compressed nitrogen<br />
quickly expands to force hydraulic oil into the<br />
rams causing them to chase the reaction masses to<br />
the apex of their flight. The hydraulic oil is routed<br />
(in series) through one-way valves at the base of<br />
each ram, which restricts reverse flow, and thus the<br />
downward movement of the masses. Each of the<br />
four rams is independent of the others providing redundancy<br />
and safety. The masses remain at this position<br />
until the user redirects the additional fluid in<br />
the rams back into the accumulators. At which time,<br />
a subsequent load cycle can be performed.<br />
Figure 9. Statnamic device with hydraulic<br />
catch mechanism (4 MN)<br />
The foundation industry not only wanted to perform<br />
larger Statnamic tests but also more of them and at a<br />
higher frequency. Also in this case Patrick <strong>Bermingham</strong><br />
and design engineers came up with a creative<br />
solution. In 1995, the hydraulic catching mechanism<br />
was built to provide a means of testing, without using<br />
the conventional gravel container, or gravel.<br />
This simple piece of equipment makes it possible to<br />
test up to ten individual piles and to perform multiple<br />
load-cycles. The catch mechanism provides the<br />
luxury of multiple load cycles within a matter of<br />
minutes, the ability to inspect the ignition circuit<br />
without disassembly, the benefit of single truck mobilization,<br />
and its avoids the environmental problems<br />
with gravel retrieval with testing over water.<br />
By transferring the initial weight of the masses to<br />
the rams at the onset of the test it is possible to perform<br />
Statnamic testing without a pre-load condition.<br />
Additionally, hydraulic catching systems have no<br />
minimum required jump-height for the silencerreaction<br />
mass assembly, which is a concern for<br />
gravel catching systems. By removing this restriction,<br />
low load tests can be performed with much<br />
greater than 5% reaction mass. Such tests can produce<br />
long duration load pulses greater than 0.5 seconds,<br />
thus reducing inertial and damping forces for<br />
large portions of the test.<br />
Although the set-up time for a 4MN gravel or hydraulic<br />
catching systems is comparable, multiple cycles<br />
can be performed in a matter of minutes when<br />
using the latter. Further, the breakdown typically<br />
takes less time. In using gravel-catching systems,<br />
great care is exercised in the preparation of the ignition<br />
circuitry. An inadequate igniter connection<br />
could cost a project as much as a day of delay time.<br />
This of little concern when using the hydraulic<br />
catching system due to the ability to raise the entire<br />
stack of reaction masses with the hydraulic rams so<br />
as to access the fuel basket.<br />
A substantial portion of all Statnamic testing costs<br />
stems from the mobilization of equipment. Typically,<br />
a 4 MN test requires two tractor-trailers to<br />
ship the combined weight of the equipment and<br />
reaction masses (27,000 kg total) where only 20,000<br />
kg is permitted per truck in the USA (30,000 kg in<br />
Europe). The device can be equipped with two reaction<br />
mass options: (1) an entire set of six concretefilled<br />
steel masses, which requires two trucks to<br />
ship, or (2) a set of six empty, structurally reinforced<br />
steel cans. The empty cans option allows single<br />
truck mobilization to distant sites with a total
Sixth International Conference on the Application of Stress-Wave Theory To Piles 8<br />
Orlando, Sao Paulo, 2000.<br />
www.profound.nl<br />
shipped mass of 19,000 kg. Once at the site the cans<br />
can be filled with sand, gravel, water or any combination<br />
to attain the required mass<br />
3MN and 4MN hydraulic catching systems are<br />
now in use in the United Kingdom, the USA and the<br />
Netherlands for 3MN and 4MN systems. In 2000 a<br />
mechanical catch mechanism will be constructed for<br />
a 16 MN device.<br />
the company AFT. Loads of up to 10 MN have now<br />
been applied in lateral load testing.<br />
6 BATTER PILE TESTING<br />
Drop hammers and dead weight static load tests<br />
are fully dependent on gravity. One of the big<br />
advantages of Statnamic is its independence of gravity<br />
because generating the load it is based on inertia<br />
Figure 11. Lateral load testing preparations for a<br />
7.5MN test.<br />
Major pioneering developments have been performed<br />
by Dan Brown (1998) of Auburn University<br />
USA in the analysis of lateral Statnamic tests.<br />
8 WATER REACTION MASS TESTING<br />
Figure 10. Over water Statnamic testing on a<br />
batter pile<br />
forces. This means that the test can be performed in<br />
any direction: under batter, lateral and even allows<br />
to perform a tension test on a pile. In Figure 9 an example<br />
of the application of batter pile testing is presented.<br />
It is almost impossible to perform static load<br />
test in this over water pile testing situation. The<br />
flight of the reaction mass is guided by a support<br />
beam<br />
A most significant development is the use of water<br />
as a reaction mass when testing piles over-water<br />
or near-water. By being able to mobilize the inertia<br />
of the ocean or a river, very large tests may be per-<br />
7 LATERAL LOAD TESTING<br />
Lateral STN testing is becoming popular in the<br />
USA and was strongly encouraged by Barry Berkowitz<br />
of the FHWA. The first lateral test with a large<br />
device was at the Salt Lake City, Utah Airport in a<br />
research project with Kyle Rollins of Brigham<br />
Young University USA and a 14MN device was<br />
used. Mike Muchard and Don Robertson of Applied<br />
Foundation Testing perfected lateral load testing.<br />
They developed a "jig" for holding the piston and a<br />
"sled" for holding the silencer and masses.<br />
A very significant job was for the Mississippi<br />
DOT in 1998 to simulate a ship impact of 7.5MN by<br />
Figure 12, Set up of Statnamic water reaction<br />
mass testing
Sixth International Conference on the Application of Stress-Wave Theory To Piles 9<br />
Orlando, Sao Paulo, 2000.<br />
www.profound.nl<br />
formed with testing equipment weighing only 1 % of<br />
Geert Jonker of IHC Foundation Equipment envisioned<br />
the idea to extend the use the water reaction<br />
Figure 13. Water reaction mass containers<br />
the test load. The necessary 5% or10% reaction mass<br />
would be provided by water confined within a vessel<br />
and submerged below the surface of the water. This<br />
weightless reaction mass makes it possible to perform<br />
very large tests of longer duration than are<br />
practical today. The use of water reaction will also<br />
make it possible to drive piles underwater with a<br />
tool, which will be virtually weightless.<br />
Statnamic testing using water reaction mass was first<br />
done by <strong>Bermingham</strong>mer in 1998 in Hamilton Harbour.<br />
These tests went to 600kN. The first fieldtesting<br />
was performed for the Port of Lake Charles<br />
in Louisiana in 1999 by Applied Foundation Testing<br />
assisted by <strong>Bermingham</strong>mer. The loads were up to<br />
5 MN.<br />
9 PILE DRIVING WITH WATER REACTION<br />
Figure 14. Water reaction mass testing<br />
mass into a pile-driving tool. <strong>Bermingham</strong>mer, IHC<br />
and TNO are now working together to build an underwater<br />
Statnamic hammer, which will consist of a<br />
large inertial mass, made of water and a Statnamic<br />
tool capable producing multiple loading pulses.<br />
This tool will be used to push an anchor pile into the<br />
seabed and measure its capacity at the same time.<br />
In the coming years, we will see driving small<br />
onshore and offshore piles according to the Statnamic<br />
principle.<br />
10 EVENTS<br />
To share the experience among pile engineers and<br />
to improve the Statnamic test technology the first International<br />
Statnamic Seminar was held in Vancouver<br />
in 1995 with 25 papers and 54 participants. The<br />
Japanese research group on Rapid Pile Load Test<br />
Methods organized the Second International Statnamic<br />
Seminar in 1998 with 48 papers and 132 participants.<br />
The third Statnamic seminar is planned in<br />
the Netherlands in 2002.<br />
Figure 15. Artist’s impression of a water reaction<br />
pile-driving tool.<br />
In March of 2000, the Japanese Geotechnical Society<br />
(1998) published a standard for “Method for<br />
Rapid Load Test of Single Piles”
Sixth International Conference on the Application of Stress-Wave Theory To Piles 10<br />
Orlando, Sao Paulo, 2000.<br />
www.profound.nl<br />
An ASTM standard for Statnamic type pile testing<br />
is in progress.<br />
Creeping phenomena cannot be determined with<br />
Statnamic, dynamic load testing and in many cases<br />
not even with static load testing.<br />
11 RESEARCH AND DEVELOPMENTS<br />
Companies and universities have accumulated up<br />
to date more than 700 case histories throughout the<br />
world. The total number of contract Statnamic tests<br />
worldwide has exceeded 1000, with testing now occurring<br />
at a frequency of more than one each day.<br />
The largest volume of testing to date has occurred in<br />
Malaysia, with the number of contract tests exceeding<br />
300. Similar numbers of contract tests have now<br />
been performed in the United States. The UK and<br />
Japan are close behind in their numbers of tests.<br />
An important contribution to the development of<br />
Statnamic was supplied by the Japanese Geotechnical<br />
Society, which established the research group of<br />
Rapid Pile Load Test Methods in 1993. Professor<br />
Osamu Kusakabe of Tokyo Institute of Technology<br />
chaired the group. A strong promoter and initiator of<br />
Statnamic in Japan was Makoto Tsuzuki of Fugro<br />
Japan. The research group included 30 private institutes<br />
and companies as members. The activities of<br />
the Research Group aimed at cataloging the existing<br />
knowledge about rapid load tests, examining the basic<br />
characteristics and the applicability of the test,<br />
and producing scientific interpretations of the Statnamic<br />
test results.<br />
The University of South Florida (1998) conducted<br />
over 150 Statnamic tests in conjunction with<br />
privately and federally funded test programs. The<br />
tests programs have included: (1) axial load tests on<br />
piles and shafts in sands, clays, or rock-sockets, (2)<br />
lateral load tests on pile groups and shafts, and (3)<br />
plate load tests on sands and full-scale spread footings<br />
on sands and vibro-compacted soils (stone columns).<br />
The application of Statnamic produces excellent<br />
results in stiff and/or granular soils, although loading<br />
rate effects have to be taken into account. The influence<br />
of soil viscosity alongside buildup of pore water<br />
pressure in fine grained soils requires further development<br />
of analysis tools and experience.<br />
(E.L.Hajuk et. al. 1998).<br />
The soil viscosity shows up in two different<br />
ways:<br />
- Creeping, this means continuing settlements<br />
under constant pile load<br />
- Velocity dependent soil behavior<br />
The velocity dependent soil behavior can be split<br />
up in soil damping phenomena and strain rate dependency.<br />
Soil damping phenomena can be derived<br />
straightforward from a Statnamic test. Strain rate<br />
dependency for fine-grained soils is still subject to<br />
study, for example by the University of Sheffield<br />
UK (A.F.L. Hyde. Et all, 1998). Well-documented<br />
data from pile load test projects is becoming available<br />
to support the insight in strain rate effects<br />
(Holyman, et al., 2000).<br />
12 CONCLUSIONS<br />
The success of Statnamic stems for a significant<br />
part from the concepts and ideas generated by “artist-engineers”<br />
and “engineer-artists”.<br />
According to Brandl (2000): an excellent engineer<br />
requires not only a firm theoretical knowledge<br />
but also comprehensive experience as well as engineering<br />
feeling and intuition in equal parts. The author<br />
would like to add: the ability to be creative and<br />
think in unconventional ways.<br />
The success of Statnamic can be further explained<br />
by the high degree of international cooperation and<br />
research, which has brought the technology to the<br />
forefront.<br />
The Statnamic community originated from the<br />
stress wave community and the author is sure that<br />
they will remain in close contact. Both have a common<br />
interest in the research of dynamic phenomena<br />
of soils and the development of tools for the load<br />
testing of piles. The incorporation of the ideas of<br />
“artist-engineers” and “engineer artists” will guarantee<br />
more marvels in the development of pile testing<br />
applications and other fields of engineering.<br />
13 REFERENCE:<br />
<strong>Bermingham</strong>, P., Janes, M., ”An innovative approach<br />
to load testing of high capacity piles”, Proceedings<br />
of the International Conference on Piling<br />
and Deep Foundations, London, 1989<br />
.<br />
Middendorp, P. <strong>Bermingham</strong>, B Kuiper, Statnamic<br />
load testing of foundation piles. 4th International<br />
Conference on Stress Waves, The Hague, Balkema,<br />
1992
Sixth International Conference on the Application of Stress-Wave Theory To Piles 11<br />
Orlando, Sao Paulo, 2000.<br />
www.profound.nl<br />
Galluzi, P., Mechanical Marvels, Invention in the<br />
age of Leonardo, ISBN 88-09-20959-1, Instituto e<br />
Museo di Storia della Scienza, Florence, 1996.<br />
Baudson, M., Panamarenko, Paris 1996<br />
Fellenius, B., Welcome from the Chairman, First International<br />
Statnamic Seminar, Vancouver, 1995<br />
Middendorp, P., Daniels, B., The Influence of Stress<br />
Wave Phenomena during Statnamic Load Testing,<br />
5th International Conference on the Application of<br />
Stress-Wave Theory To Piles Orlando, Florida,<br />
1996<br />
<strong>Bermingham</strong>, P.D., Statnamic the first ten years,<br />
Proceedings of the 2 nd International Statnamic<br />
Seminar, Tokyo, 1998<br />
Hajduk, E.L., Paikowsky, S.G., Mullins, G., Lewis<br />
C., Ealy, C.D., Hourani. N.M., The behavior of piles<br />
in clay during Statnamic and different static load test<br />
procedures. Proceedings of the 2 nd International<br />
Statnamic Seminar, Tokyo, 1998<br />
Mullins, G., Garbin, E.J., Jr., Statnamic testing:<br />
University of South Florida Research, Proceedings<br />
of the 2 nd International Statnamic Seminar, Tokyo,<br />
1998<br />
Brandl, H., Civil and Geotechnical engineering in<br />
society – Ethical aspects and future prospects, Proceedings<br />
of the First International Conference on<br />
Geotechnical Engineering Education and Training,<br />
Sinaia, Romania, 2000<br />
Brown, D.A., Statnamic lateral load response of two<br />
deep foundations, Proceedings of the 2 nd International<br />
Statnamic Seminar, Tokyo, 1998<br />
Hyde A.F.L., Anderson W.E., Robinson S.A., Rate<br />
Effects in clay soil and their relevance to Statnamic<br />
pile testing, Proceedings of the 2 nd International<br />
Statnamic Seminar, Tokyo, 1998<br />
Justason, M. D.; Janes, M. C.; Middendorp, P.; Mullins,<br />
A. G. Statnamic load testing using water as reaction<br />
mass, The 6th International Conference on the<br />
application of stress wave theory to piles, Sao Paulo,<br />
Brazil 2000.<br />
Holeyman, A., Maertens, J., Huybrechts, N., Legrand,<br />
C., Preparation of an international pile dynamic<br />
prediction event. The 6th International Conference<br />
on the application of stress wave theory to<br />
piles, Sao Paulo, Brazil 2000
Sixth International Conference on the Application of Stress-Wave Theory To Piles 12<br />
Orlando, Sao Paulo, 2000.<br />
www.profound.nl<br />
14 APPENDIX<br />
F stn<br />
<br />
F stn<br />
<br />
The Unloading Point Method (UPM)<br />
Step I) Determination of static resistance from<br />
unloading point<br />
<br />
<br />
<br />
<br />
<br />
<br />
<br />
<br />
<br />
<br />
<br />
<br />
<br />
<br />
<br />
<br />
<br />
<br />
<br />
<br />
<br />
<br />
<br />
M<br />
<br />
F soil<br />
<br />
<br />
F a<br />
Assumption:<br />
The long duration Statnamic load F stn allows modelling of the pile as a<br />
concentrated mass (M) and springs<br />
F stn = Statnamic force (measured and known)<br />
u = displacement (measured and known)<br />
v = du\dt = velocity<br />
(known)<br />
a = d 2 u/dt 2 = acceleration (known)<br />
F soil = F u + F v<br />
F u = static resistance (unknown)<br />
F v = C.v = damping force<br />
(unknown)<br />
C = damping factor<br />
(unknown)<br />
Load F stn<br />
STATNAMIC SIGNALS<br />
F a = M.a<br />
(known)<br />
Equilibrium:<br />
F unl<br />
F stn = F soil + F a<br />
Displacement u<br />
Time<br />
F stn = F u + F v + F a<br />
F u = F stn - C v - M.a<br />
At maximum displacement (Unloading Point)<br />
v = 0 → u = maximum, t = t umax<br />
F unl = F stn(t umax) , a unl = a(t umax)<br />
u unl<br />
Velocity<br />
v<br />
Time<br />
F u(t umax) = F unl - M.a unl<br />
(known)<br />
Static resistance F u is known at u unl<br />
v = 0, t = t umax<br />
F u(t umax) , u unl is a static point<br />
Acceleration a<br />
Time<br />
Step II) Construction of static load-displacement<br />
Assumption:<br />
diagram<br />
The soil is yielding over range F stn(max) to F unl<br />
So F u = F unl<br />
a unl<br />
Time<br />
Over this range the following equation is valid<br />
F v = F stn - F unl - F a<br />
Load<br />
F stn<br />
with F v = C.v<br />
C = (F stn - F unl - F a) / v<br />
Calculate mean damping factor C mean for above range.<br />
F stn<br />
Now static resistance Fu can be calculated at all points<br />
F u<br />
F stn(max)<br />
F u = F stn - C mean .v - F a<br />
Draw static load-displacement diagram with F u and u<br />
F unl, u unl<br />
F a<br />
Displacement u<br />
Load displacement diagrams