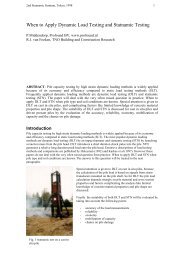
CORRELATION BETWEEN DLT AND SLT - CASE HISTORIES
CORRELATION BETWEEN DLT AND SLT - CASE HISTORIES
CORRELATION BETWEEN DLT AND SLT - CASE HISTORIES

Create successful ePaper yourself
Turn your PDF publications into a flip-book with our unique Google optimized e-Paper software.
<strong>CORRELATION</strong> <strong>BETWEEN</strong> <strong>DLT</strong> <strong>AND</strong> <strong>SLT</strong> - <strong>CASE</strong> <strong>HISTORIES</strong><br />
Hernán Goldemberg 1 , Juan J. Goldemberg 2<br />
ABSTRACT<br />
Due to the increase in service loads of foundations, a world wide trend is being followed by geotechnical<br />
engineers and designers to measure the real behaviour of the pile-soil interaction. Historically, this was<br />
defined by the Load-Displacement Curve, obtained from a Static Load Test, and the concept of bearing<br />
capacity…if those involved in the project arrived to an agreement on its definition. Technology developed<br />
and the concept of Dynamic Load Test (<strong>DLT</strong>) arrived, bringing with it an economic and faster way of<br />
measuring the response of piles to imposed loads. But is this what the geotechnical engineer requires?<br />
A comparison between <strong>DLT</strong> and <strong>SLT</strong> is analysed throughout the eyes of a geotechnical engineer and not<br />
from the perspective of a testing house. Different types of piles were tested with both methods, seeking for<br />
correlation, side effects and installation influence in results, aiming to know the real performance vs.<br />
predictions.<br />
INTRODUCTION<br />
In the first half of the ‘80s, it was introduced in Argentina the pile testing speciality based on the Stress<br />
Wave Theory; at the beginning through the Sonic Integrity Test (SIT), as a parameter for control quality of<br />
foundations and, afterwards, with the Dynamic Load Test (<strong>DLT</strong>) in order to measure the pile-soil behaviour.<br />
But up to then, how was determined the bearing capacity of a piled foundation? The answer is simple, in<br />
the same way than in the rest of the world, that is, with a Static Load Test (<strong>SLT</strong>). As we all know, in spite the<br />
familiarity <strong>SLT</strong> has within the engineering community…that, if we first agree on what type of <strong>SLT</strong>, due that<br />
the ASTM D 1143-81 Standard has five different methodologies…it is time and money consuming.<br />
During those years, where Quality Assurance (QA) started to play an important role in the Argentinean<br />
construction market, as well as the increment in service loads, lead to an increase in the demand for verifying<br />
piling works. As well, a reactivation of the local economy, the availability of new technology in construction<br />
methods and tighter schedules for finishing site works, allowed the <strong>DLT</strong> to be introduced as an alternative to<br />
the cumbersome static test.<br />
It is the objective of this Paper to present correlations between Dynamic and Static Load Tests performed<br />
on the same pile, including all the information that the Geotechnical Consultant had at the moment of<br />
analysing the results and highlighting how it was arrived to those conclusions. It is the moment to mention<br />
that in all cases the Dynamic Load Tests were performed using the FPDS-3 equipment, developed by TNO<br />
Building & Construction Research (the Netherlands), while the <strong>SLT</strong>s were conducted under ASTM<br />
Standard. When the Static test was carried out, the transfer load structure assembled consisted in a beam and<br />
reaction piles anchored well below the influence area of the test pile.<br />
<strong>CASE</strong> <strong>HISTORIES</strong>.<br />
Buildings<br />
The site was a group of buildings constructed in the City of Buenos Aires, Argentina. The ground<br />
conditions are described in the following geotechnical profile (Figure 1), and the pile type was of<br />
substitution, reinforced concrete and casted in-situ under bentonite mud (pile characteristics are presented on<br />
Table 1).<br />
Table 1. Pile characteristics.<br />
1 Hernán Goldemberg, GEOTECNICA CIENTEC, Lavalleja 847 - ZIP: 1414 - Buenos Aires - Argentina<br />
2 Juan J. Goldemberg, GEOTECNICA CIENTEC, Lavalleja 847 - ZIP: 1414 - Buenos Aires - Argentina
Pile Bentonite mud Diameter Length<br />
Type (m) (m)<br />
I 0.35 14.0<br />
II 0.40 15.0<br />
III 0.50 15.0<br />
Figure 1. Geotechnical profile.<br />
BORING N° 12<br />
Depth ( m )<br />
C la s ific ation SPT<br />
USS N<br />
0.0 CL<br />
1.0 CL 6<br />
2.0 CL 2<br />
3.0 ML 4<br />
4.0 CL 6<br />
5.0 ML 4<br />
6.0 SM 11<br />
7.0 SM 5<br />
8.0 ML 28<br />
9.0 ML 13<br />
10.0 CL 15<br />
11.0 CL 13<br />
12.0 ML-CL 20<br />
13.0 ML 50<br />
14.0 ML 50<br />
15.0 ML 50<br />
16.0 ML 50<br />
17.0 MH 42<br />
18.0 MH 50<br />
19.0 MH 50<br />
20.0 MH 50<br />
SPT<br />
(N )<br />
0 10 20 30 40 50<br />
W ATERTABLE<br />
The foundation project consisted in 408 piles<br />
placed under caps in groups of one, two or three<br />
units each. All the installed piles had to be<br />
controlled through the Sonic Integrity Test (SIT)<br />
in order to verify that they were free of damages<br />
and to select which ones were to be subject for<br />
<strong>DLT</strong> and <strong>SLT</strong>.<br />
It was decided, by the Engineer, that the first<br />
three piles were going to be tested statically with<br />
the ‘slow method’ and then 7% of the foundation<br />
population (29 piles) were going to be tested with<br />
the Dynamic Load Test (the tests information is<br />
presented on Table 2)<br />
Table 2. Test programme*<br />
Test Pile<br />
Type Type<br />
Quantity Service Max. Test Maximum<br />
Load Load Settlement<br />
(MN) (MN) (mm)<br />
<strong>DLT</strong> I 10 0.6 1.4 2.6<br />
II<br />
III<br />
10<br />
9<br />
0.7<br />
0.9<br />
1.9<br />
2.4<br />
3.0<br />
3.9<br />
<strong>SLT</strong> I 1 0.6 1.2 2.2<br />
II 1 0.7 1.4 2.1<br />
III 1 0.9 1.8 2.6<br />
Note *: information is presented only for those piles where<br />
<strong>DLT</strong> and <strong>SLT</strong> were performed.<br />
Conclusions: The results of the homologated tests are presented on Figure 2, where it is clearly seen the<br />
good correlation between <strong>DLT</strong> and <strong>SLT</strong>. The quality of this match depends dramatically on the quality of the<br />
geotechnical investigation, the knowledge of the mechanical properties of the concrete and the concrete<br />
consumption, in order to check variations in the cross section of the piles.
Figure 2. <strong>DLT</strong> and <strong>SLT</strong> load-settlement curves.<br />
Settlement (mm)<br />
Load (MN)<br />
0 0.5 1 1.5 2 2.5 3<br />
0<br />
0.5<br />
1<br />
1.5<br />
<strong>DLT</strong> I<br />
2<br />
<strong>SLT</strong> I<br />
2.5<br />
3<br />
Industrial Facility<br />
The site consisted in the expansion of an industrial<br />
facility in the South Area of Gran Buenos Aires, where<br />
250 precast reinforced concrete piles were going to be<br />
driven with a diesel hammer. Pile data is available on<br />
Table 3.<br />
Table 3. Pile characteristics.<br />
Pile Cross section Length<br />
Type (mxm) (m)<br />
Concrete precast 0.4x0.4 19.0<br />
Settlement (mm)<br />
Load (MN)<br />
0 0.5 1 1.5 2 2.5 3<br />
0<br />
0.5<br />
1<br />
1.5<br />
2<br />
2.5<br />
<strong>DLT</strong> II<br />
<strong>SLT</strong> II<br />
3<br />
3.5<br />
Settlement (mm)<br />
Load (MN)<br />
0 0.5 1 1.5 2 2.5 3<br />
0<br />
0.5<br />
1<br />
1.5<br />
2<br />
2.5<br />
3<br />
<strong>DLT</strong> III<br />
<strong>SLT</strong> III<br />
3.5<br />
4<br />
4.5<br />
In order to determine the pile length in different areas of the building site, Pile Driving Analysis (PDA)<br />
was performed, monitoring Driving Resistances, Enthru Energy, Stresses, etc. The 100% of the pile<br />
population was tested with SIT searching for cracked piles, 10% of the foundation (20 piles) was tested<br />
dynamically and only 1 ‘slow’ <strong>SLT</strong> was performed to have a correlation between both methods. The<br />
summary of these investigations is presented on Table 4.<br />
Table 4. Test programme.<br />
Test<br />
Type<br />
Quantity Service<br />
Load<br />
Max. Test<br />
Load<br />
Maximum<br />
Settlement<br />
(MN) (MN) (mm)<br />
PDA 40 - - -<br />
<strong>DLT</strong> 20 1.2 2.9 4.8<br />
<strong>SLT</strong> 1 1.2 2.4 3.8
Figure 3. Geotechnical profile.<br />
BORING N° 1<br />
Clasific.<br />
Depth ( m )<br />
USS<br />
SPT<br />
N<br />
0.0<br />
1.0 10<br />
2.0 SM 7<br />
3.0 3<br />
4.0 SM 4<br />
5.0 5<br />
6.0 SM 6<br />
7.0 4<br />
8.0 SM 3<br />
9.0 3<br />
10.0 ML 2<br />
11.0 2<br />
12.0 SM 1<br />
13.0 16<br />
14.0 CL 8<br />
15.0 24<br />
16.0 CL 23<br />
17.0 CL 25<br />
18.0 CL 27<br />
19.0 CL 30<br />
20.0 28<br />
21.0 CL 26<br />
22.0 26<br />
SPT<br />
(N)<br />
0 1020304050<br />
WATERTABLE<br />
Shaft friction<br />
f s (MPa)<br />
0 1<br />
It is interesting to discuss what happened<br />
with this correlation. Due to the unreal short<br />
period of time allowed to finish all the driving<br />
works, the Engineer decided to perform the<br />
Dynamic Load Test immediately after drivingalthough<br />
GEOTECNICA CIENTEC intended to<br />
persuade him not to do so because a less total<br />
resistance was going to be obtained due to the<br />
influence of pore pressure.<br />
The geotechnical information, described on<br />
Figure 3, shows the stratigraphic profile<br />
throughout SPT and CPT tests. Because<br />
discrepancies were detected during the original<br />
borings in different areas of the site, Dutch Cone<br />
was used. It was also very useful the Pile<br />
Driving Prediction (PDP), performed before the<br />
first pile was driven, to select the most suitable<br />
diesel hammer.<br />
On Figure 4, the results of the load tests<br />
performed on pile N° 135 are plotted, where the<br />
first <strong>DLT</strong> carried out did not fulfilled the<br />
expectations- due to what was mentioned above.<br />
After the results were available, the Engineer<br />
decided to perform the <strong>SLT</strong> two weeks later, having in mind that the test could not be taken to failure<br />
because it was a service pile. Five days after finishing the Static test, the piling rig was used to redrive pile<br />
N° 135 to monitor its dynamic behaviour.<br />
As it can be clearly observed, the differences between the first <strong>DLT</strong> and the <strong>SLT</strong> as well as among the<br />
dynamic ones was caused because it was not taken into account that in cohesive saturated soils, the driving<br />
effects on remoulding soil layers and the slow dissipating pore pressure cause a reduction of the bearing<br />
capacity.<br />
Conclusions: Dynamic Load Tests are affected by local geotechnical characteristics as well as by soil<br />
conditions at the moment of carrying out the measurements. This is the reason why the first <strong>DLT</strong> did not<br />
provide reliable information, because the behaviour of the pile-soil interaction during testing was different<br />
than that at the design stage. It is the authors’ opinion that in order to perform a better geotechnical design of<br />
piles, more efficient and foundation works less expensive, it must be to carry out CPTs tests during the soil<br />
investigation programme. In this way better Signal Matches will be obtained between Upper Travelling<br />
Waves, because more exact soil models can be evaluated.<br />
Figure 4. <strong>DLT</strong> and <strong>SLT</strong> load-settlement curves.<br />
Toe resistance<br />
q s (MPa)<br />
0 10 20 30<br />
Load (MN)<br />
Settlement (mm)<br />
0<br />
1<br />
2<br />
3<br />
4<br />
5<br />
0 0.5 1 1.5 2 2.5 3 3.5 4<br />
<strong>DLT</strong><br />
<strong>SLT</strong><br />
1st <strong>DLT</strong><br />
Bridge<br />
In the Province of Santa Fe, Argentina, due to<br />
yearly over floods of the Paraná River- caused<br />
mainly by heavy rains during the rainy season,<br />
many bridges in the area of the lowlands had to<br />
be rebuilt and some others expanded.<br />
In this case, the project consisted in raising the<br />
level of the road as well as increasing the length<br />
of the bridge from one span 10m long to a deck<br />
of two spans 15m each.<br />
6
The geotechnical design for the foundation was based on the soil strata illustrated on Figure 5, adopting<br />
bored piles casted under bentonite mud. The pile details are included on Table 5.<br />
Table 5. Pile characteristics.<br />
Pile Bentonite mud Diameter Length<br />
Type (m) (m)<br />
Bored 1.20 21.5<br />
The North, South and Intermediate piers had three piles each, which were tested with SIT, aiming for<br />
defects such us cracks, soil inclusions, contaminated concrete and their real lengths. The testing programme<br />
carried out is shown on Table 6.<br />
From the interpretation of the Sonic Integrity Tests signals, it was concluded that pile N°4 had an<br />
impedance reduction.<br />
After a detailed analysis using the Signal Matching technique with TNOWAVE, it was calculated that the<br />
abnormality consisted in a reduction of cross section from 1.20m of nominal diameter to 1.12m extended<br />
over a length of 0.5m and at a depth of 14.6m, measured from the pile head. With this result, it was decided<br />
to go further on in the investigations, in order to determine the real behaviour of the pile-soil interaction and<br />
measure if the foundation element was suitable of transferring loads to the surrounding stratigraphy. A<br />
Dynamic and a Static Load Tests were going to be run on pile N°4.<br />
Figure 5. Geotechnical profile.<br />
BORING N° 2<br />
Depth ( m )<br />
Clasification SPT<br />
USS N<br />
0.0<br />
1.0 CL 4<br />
2.0 CH 6<br />
3.0 CH 5<br />
4.0 CL 3<br />
5.0 CL-ML 1<br />
6.0 SP-SM 7<br />
7.0 SM 24<br />
8.0 SP-SM 50<br />
9.0 SP-SM 42<br />
10.0 SP-SM 42<br />
11.0 SP-SM 41<br />
12.0 SP-SM 26<br />
13.0 SP-SM 18<br />
14.0 SP-SM 24<br />
15.0 SP-SM 32<br />
16.0 SP-SM 37<br />
17.0 SC 50<br />
18.0 SP-SM 50<br />
19.0 SP-SM 50<br />
20.0 SP-SM 50<br />
21.0 SP-SM 50<br />
22.0 SP-SM 50<br />
23.0 SP-SM 50<br />
24.0 SP-SM 50<br />
SPT<br />
(N )<br />
0 10 20 30 40 50<br />
WATERTABLE<br />
Table 6. Test programme.<br />
Test<br />
Type<br />
Quantity Service Max. Test Maximum<br />
Load Load Settlement<br />
(MN) (MN) (mm)<br />
<strong>DLT</strong> 1* 4.0 6.5 7.3<br />
<strong>SLT</strong> 1 4.0 7.2 8.6<br />
Note *: Originally 1 <strong>SLT</strong> and 1 <strong>DLT</strong> were<br />
projected, but as one pile was damaged it was<br />
agreed to perform a second <strong>DLT</strong>.<br />
Due to the local geological conditions, mainly<br />
sandy soil, a ‘quick’ Static Load Test was going<br />
to be performed because the creep effect was not<br />
critical for the bridge behaviour. The results are<br />
plotted on Figure 6 jointly with its dynamic<br />
counterpart.
Figure 6. <strong>DLT</strong> and <strong>SLT</strong> load-settlement curves.<br />
Conclusions: At it is clearly presented, the<br />
0 1 2 3 4 5 6 7 8<br />
Dynamic Load Test can have an accurate static<br />
0<br />
correlation, inclusive for high loads- 7MN as in<br />
1<br />
this case.<br />
2<br />
As in the previous cases, the building and the<br />
3<br />
industrial facility projects, it is an irrevocable<br />
4<br />
condition - in order to obtain a good match or<br />
5<br />
correlation between dynamic and static<br />
6<br />
measurements of a same phenomenon pile-soil<br />
7 <strong>DLT</strong><br />
interaction - to have an exhaustive geotechnical<br />
8<br />
9<br />
10<br />
<strong>SLT</strong><br />
investigation, knowledge of the parameters of<br />
the materials used for the construction on the<br />
foundation and the pile shape. Although some<br />
skepticism, that still over flies on some<br />
Engineer’s minds, Dynamic Load Testing is reliable if the above conditions are fulfilled, inclusive for high<br />
loads in cast in-situ piles.<br />
Settlement (mm)<br />
GENERAL CONCLUSIONS.<br />
In the above case histories, where piles varied in dimensions and construction methods- from driven<br />
precast concrete to bored piles under slurry, throughout Franki type; installed in clay, lime and sand affecting<br />
the pile-soil interaction in different ways under small to big loads, they all have a common denominator.<br />
That common denominator is, leaving aside the fact that all tests were properly performed, recorded and<br />
post-processed, the quality of the basic information. In other words, the geotechnical information,<br />
dimensions and pile shape, mechanical properties of materials used and the installation procedure.<br />
For both types of test, Dynamic (<strong>DLT</strong>) and Static (<strong>SLT</strong>), that information is vital. Notable contradiction,<br />
because it is required for both designing the test and interpretation of results. It is useless to obtain huge<br />
amount of data, in white paper in case of a <strong>SLT</strong> or a computer file for a <strong>DLT</strong>, in order to be plotted as the<br />
‘Load-Settlement Curve’ and handed in to the Client as a great achievement certifying that ‘the pile will<br />
stand the load’ without the geotechnical-structural diagnosis. In other words, the interpretation!<br />
If not, effort, time and money would have been wrongly spent…three not refundable goods in any aspect of<br />
life.<br />
But making an abstraction and travelling to the Contractors’ Paradise, where no testing is required and<br />
QA has not been invented- not even as a concept. Nevertheless, would not be necessary to know the<br />
geotechnical investigation, material properties and selected pile in order to construct the project?<br />
In almost all the above case histories, a good correlation between Dynamic and Static Load Tests was<br />
obtained, satisfying the expectations for homologation of both methods. It is a fact the acceptance for <strong>DLT</strong><br />
from the local market and its growing reliability, due that it provides similar results than the Static Test with<br />
almost no delays on site and reduced budget.<br />
REFERENCES.<br />
Load (MN)<br />
ASTM, D 1143-81 (Reapproved 1994). “Standard Test Method for Piles Under Static Axial Compressive<br />
Load”. ASTM<br />
ASTM, D 4945-89. “Standard Test Method for High-Strain Dynamic Testing of Piles”. ASTM<br />
C. R. Mullins (1992). “Large diameter pile test project”. Proceedings of the Conference on Recent Larfe<br />
Scale Fully Instrumented Piles in Clay, London, June 1992<br />
Caroll L. Crowther (1988). “Load Testing of Deep Foundations”.<br />
German Society for Static and Dynamic Pile Tests (1997). “Recommendations for Static and Dynamic Pile<br />
Tests”