Education
DoE Annual Report 2012-2013 - Department of Education
DoE Annual Report 2012-2013 - Department of Education
- No tags were found...

Create successful ePaper yourself
Turn your PDF publications into a flip-book with our unique Google optimized e-Paper software.
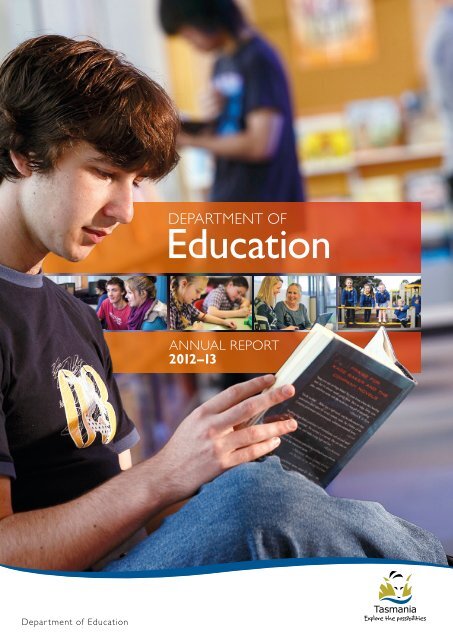
DEPARTMENT OF<br />
<strong>Education</strong><br />
ANNUAL REPORT<br />
2012–13<br />
Department of <strong>Education</strong>
Letter to the Ministers<br />
Hon Nick McKim MP<br />
Hon Michelle O’Byrne MP<br />
Minister for <strong>Education</strong> and Skills Minister for Children<br />
Level 9, Marine Board Building Ground Floor, Public Building<br />
1 Franklin Wharf 53 St John Street<br />
HOBART Tasmania 7000 LAUNCESTON Tasmania 7250<br />
Dear Ministers<br />
In accordance with the requirements of section 36 of the Tasmanian State Service Act 2000 and section 27 of the<br />
Financial Management and Audit Act 1990, I am pleased to submit to you this report of the activities of the<br />
Department of <strong>Education</strong> for the financial year 2012–13.<br />
Colin Pettit<br />
Secretary<br />
October 2013<br />
© State of Tasmania, Department of <strong>Education</strong>, 2013<br />
You may copy, distribute, display, download and otherwise<br />
freely deal with this work provided that you attribute the<br />
Department of <strong>Education</strong>, Tasmania.<br />
Department of <strong>Education</strong><br />
Level 1, 73 Murray Street,<br />
Hobart Tasmania 7000<br />
Telephone 1800 816 057<br />
GPO Box 169<br />
Hobart Tasmania 7001<br />
www.education.tas.gov.au<br />
ISSN 1449-1575
Contents<br />
About this Report 2<br />
Department at a Glance 3<br />
Strategic Plan 2014–2017 4<br />
Strategic Focus 6<br />
Services 12<br />
Department of <strong>Education</strong> Organisation Chart 16<br />
Clients 17<br />
Workforce 20<br />
Expenditure Summary 2012–13 22<br />
Pre-Compulsory and Compulsory<br />
<strong>Education</strong> – Output Group 1 23<br />
Early Years 24<br />
Direction 24<br />
Major Initiatives 24<br />
Performance 27<br />
Literacy and Numeracy 30<br />
Direction 30<br />
Major Initiatives 30<br />
Performance 34<br />
Post-Compulsory <strong>Education</strong> and Skills<br />
Development – Output Group 2 41<br />
Direction 42<br />
Major Initiatives 43<br />
Performance 48<br />
LINC Tasmania – Output Group 3 49<br />
Direction 50<br />
Major Initiatives 51<br />
Performance 57<br />
Required Reporting 59<br />
Employment 60<br />
Teachers (Includes all schools and<br />
Polytechnic) 62<br />
Qualifications of teachers and other<br />
professional staff 62<br />
General workforce recruitment<br />
(Includes all schools and Polytechnic) 63<br />
Workplace diversity programs 64<br />
Employee participation in industrial<br />
relations matters 64<br />
Internal grievances procedures 65<br />
Occupational health and safety 65<br />
Health and wellbeing programs 65<br />
Employee Performance and Development Programs 67<br />
Performance management 67<br />
Professional learning 69<br />
Disability Framework for Action 71<br />
Disability Standards for <strong>Education</strong> 2005 71<br />
More Support for Students with Disability National<br />
Partnership Agreement 71<br />
Tasmanian Adult Literacy Action Plan 2010–2015 72<br />
Implementation of child and family centres 73<br />
Public Access to the Department 74<br />
Legislation Administered, Enacted and Amended 75<br />
Statutory and Non-statutory Bodies 76<br />
Asset Management and Risk Management 78<br />
Climate Change 79<br />
Pricing Policies 82<br />
Administered Payments 82<br />
Loss and Damage 83<br />
Debts Written Off 83<br />
Major Capital Projects 84<br />
Contracts and Tenders 86<br />
Superannuation Certificate 89<br />
Other Annual Reports 90<br />
Tasmanian Library Advisory Board<br />
Annual Report 90<br />
State Library and Archives Trust<br />
Annual Report 92<br />
Allport Library and Museum of Fine Arts<br />
Annual Report 93<br />
Tasmanian Home <strong>Education</strong> Advisory<br />
Council Annual Report (2012) 96<br />
Schools Registration Board Annual Report 98<br />
Financial Statements 101<br />
Statement of Comprehensive Income 102<br />
Statement of Financial Position 103<br />
Statement of Cash Flows 104<br />
Statement of Changes in Equity 105<br />
Notes 106<br />
Statement of Certification 144<br />
Auditor-General's Report 145<br />
Appendices 147<br />
Additional Performance Measures 148<br />
Abbreviations and Acronyms 150<br />
Publications 151<br />
Contact Details 153<br />
Index 154<br />
Compliance Index 157<br />
Contents<br />
1
About this Report<br />
This report meets the department’s legislative reporting<br />
obligations and provides information for all Tasmanians<br />
with an interest in education, training and information<br />
services. The report provides an overview of the<br />
operations, major initiatives and performance of the<br />
department during the 2012–13 year.<br />
Information on the department’s activities and<br />
achievements that have contributed to the successes<br />
of education, training and information services in<br />
Tasmania is included.<br />
Feedback or enquiries regarding this report are<br />
welcome. They should be directed to Tony Luttrell,<br />
Director, <strong>Education</strong>al Performance Services at<br />
tony.luttrell@education.tas.gov.au<br />
This report, and further information, is available on the<br />
department’s website at www.education.tas.gov.au<br />
Structure of the report<br />
The report is presented in sections to meet the different<br />
information needs of a range of readers.<br />
Department at a Glance<br />
This section provides a snapshot of the department<br />
including the strategic plan, strategic focus, services,<br />
structure and an overview of clients.<br />
Pre-Compulsory and Compulsory <strong>Education</strong><br />
This section highlights the direction, major initiatives and<br />
performance of the department’s output group 1, which is<br />
the responsibility of the Early Years and Schools Division.<br />
This includes the provision of early years services, and<br />
literacy and numeracy services across the department.<br />
Post-Compulsory <strong>Education</strong> and<br />
Skills Development<br />
This section highlights the department’s direction,<br />
major initiatives and performance in the provision of<br />
education and skills training beyond the compulsory years.<br />
This relates to the department’s output group 2 and is<br />
the responsibility of the Further <strong>Education</strong> and Training<br />
Division 1 .<br />
LINC Tasmania<br />
This section highlights the direction, major initiatives and<br />
performance of the department’s output group 3, which<br />
includes the operations of all LINC Tasmania services.<br />
LINC Tasmania is part of the Further <strong>Education</strong> and<br />
Training Division 1 .<br />
Required Reporting<br />
This section provides information on the financial,<br />
administrative and human resource management aspects<br />
of the department. The annual reports of related bodies<br />
and boards are also included.<br />
Financial Statements<br />
This section provides the financial statements of the<br />
department for the 2012–13 financial year.<br />
Appendices<br />
This section includes additional performance information,<br />
indexes and supplementary information.<br />
1. As of 1 July 2013 the Further <strong>Education</strong> and Training Division is to be<br />
renamed as the Skills, Community and <strong>Education</strong> Services Division.<br />
2 About this Report
Department<br />
at a Glance
Strategic Plan 2014–2017<br />
LEARNERS FIRST<br />
Connected and Inspired<br />
we value<br />
our vision<br />
Successful, skilled and<br />
innovative Tasmanians.<br />
our mission<br />
To provide every Tasmanian with the<br />
opportunity to continue to learn and<br />
reach their potential, to lead fulfilling<br />
and productive lives and to contribute<br />
positively to the community.<br />
Learning<br />
Tasmanians are engaged in positive, productive and<br />
supported learning experiences; and encouraged<br />
towards lifelong learning.<br />
Excellence<br />
We have high expectations for our learners and a<br />
strong commitment to the pursuit of excellence<br />
and innovation in our people, in our programs and<br />
in our resources.<br />
Equity<br />
We all have the right to challenging and engaging<br />
learning opportunities in appropriate settings.<br />
Respect<br />
Positive and effective interactions, with each other and<br />
with our environment, are conducted on the basis of<br />
responsibility, integrity and accountability.<br />
Relationships<br />
We achieve growth and strength through partnerships<br />
and connections with our learners, their communities<br />
and the world.<br />
4 Department at a Glance » Strategic Plan 2014–2017
our key drivers<br />
Successful Learners<br />
• Engage and retain students through creative, innovative and<br />
supported learning programs and environments.<br />
• Develop Tasmanians to have the knowledge, skills and desire<br />
to successfully contribute in our community.<br />
• Empower learners to set high standards for their education<br />
and reach their potential through tailored learning.<br />
• Establish balanced, flexible and responsive learning and<br />
training pathways for students to encourage lifelong learning.<br />
An Innovative Workforce<br />
• Create and retain a highly qualified, motivated and supported<br />
workforce through strong professional development.<br />
• Implement strategies that enhance the health and<br />
wellbeing of our staff.<br />
• Provide staff with regular and structured feedback on<br />
their performance.<br />
• Ensure staff in all areas have the required knowledge<br />
and skills to support each other for learning, growth<br />
and achievement.<br />
Inspired Leadership<br />
• Promote a culture of inspiring leadership.<br />
• Provide professional learning, coaching and mentoring<br />
opportunities for aspiring, newly appointed and<br />
experienced leaders.<br />
• Equip leaders with the skills to manage and encourage<br />
innovation and continuous improvement.<br />
• Enhance leadership development and performance<br />
management across the department.<br />
Dynamic Learning Environments<br />
• Work collaboratively to harness the expertise of the<br />
community and government to holistically support the<br />
needs of learners.<br />
• Foster the growth of sustainable networks of schools to<br />
support the delivery of high-quality education and improved<br />
student outcomes through continuous improvement.<br />
• Provide resources, facilities and infrastructure (including<br />
building and information technology) that support current<br />
and dynamic learning and teaching practices.<br />
• Demonstrate financial governance for a sustainable future.<br />
Community Confidence<br />
• Pursue a strong and measurable approach to continuous<br />
improvement using appropriate data to review the<br />
performance of all areas of the department.<br />
• Improve quality communication with the community about<br />
public education and promote lifelong learning.<br />
• Develop open and transparent reporting processes to the<br />
Tasmanian public.<br />
• Develop conducive partnerships with the Tasmanian<br />
community so we can collectively achieve educational<br />
outcomes for Tasmanian learners.<br />
our priorities<br />
Early Years<br />
Bright Beginnings<br />
Priorities<br />
• Ensure quality education and care programs and services<br />
for young children so they develop as confident and curious<br />
learners prior to commencing full-time school.<br />
• Engage with children and families in a cohesive way by<br />
connecting and integrating services.<br />
• Develop and maintain strong relationships between schools,<br />
families, services and the broader community from the<br />
early years.<br />
School <strong>Education</strong><br />
Great Schools... Great Communities<br />
Priorities<br />
• Implement and support the Australian Curriculum and ensure<br />
teachers are provided with appropriate and high-quality<br />
resources to support the delivery of learning and thinking.<br />
• Work within the organisation-wide framework for teaching<br />
and learning of literacy and numeracy to ensure students<br />
develop the skills required for participation and growth<br />
throughout their education.<br />
• Establish networks of schools to work to improve outcomes<br />
through meaningful, creative and innovative programs so<br />
students are engaged in learning, motivated to complete<br />
their studies and equipped with the skills required to be<br />
citizens in a dynamic and global world.<br />
Further <strong>Education</strong>,<br />
Adult Learning and Skills<br />
Purposeful Pathways<br />
Priorities<br />
• Engage with industry, employers and stakeholders to ensure<br />
training meets education and workforce needs, and students<br />
are provided with tangible pathways to further education<br />
and employment.<br />
• Provide supported and relevant learning, knowledge and<br />
training opportunities to adult learners to ensure they are<br />
equipped with the skills to contribute productively to our<br />
community and economy.<br />
• Promote higher education, vocational and adult learning<br />
throughout the community to encourage participation and<br />
create fulfilled and enriched Tasmanians.<br />
The department reviews the strategic plan regularly to assist in the setting of priorities for each year. Information about the strategic plan and current<br />
priorities can be viewed at http://www.education.tas.gov.au/About_us/Pages/Strategic-Plan.aspx<br />
Department at a Glance » Strategic Plan 2014–2017<br />
5
Strategic Focus<br />
The Department of <strong>Education</strong> is responsible for providing<br />
a comprehensive and lifelong approach to learning for all<br />
people regardless of age. All aspects of early learning and<br />
school education support young learners to reach their<br />
potential; lead fulfilling and productive lives; and contribute<br />
positively to their community. Our scope includes<br />
education and care; child and family centres; early years<br />
services; primary, secondary, combined and senior<br />
secondary schools; LINC Tasmania and Government<br />
<strong>Education</strong> and Training International.<br />
The department’s Learners First Strategy drives the work<br />
of the department through our:<br />
• belief that all learners have a right to participate in<br />
challenging and engaging learning opportunities<br />
• commitment to excellence and equitable access<br />
to learning<br />
• conviction that all learners have the right to be<br />
treated with respect<br />
• desire to work collaboratively with learners and<br />
their communities.<br />
These drivers ensure that Tasmania’s public education<br />
system continues to strive to be world-class.<br />
Supporting the provision of quality early childhood<br />
education and care in Tasmania is integral to the work<br />
of the <strong>Education</strong> and Care Unit (ECU). Implementation<br />
of the Council of Australian Government’s National<br />
Quality Agenda for Early Childhood <strong>Education</strong> and Care<br />
is being progressed by the ECU through monitoring<br />
and assessment and rating of services using a nationally<br />
consistent process. Throughout the state the Early Years<br />
Learning Framework provides a curriculum framework for<br />
Kindergarten and education and care (child care) services<br />
and programs; while the Framework for School Aged Care<br />
in Australia guides the provision of quality before school,<br />
after school and vacation care programs.<br />
Our delivery of skills training and adult learning programs<br />
provide Tasmanians with the skills and knowledge<br />
needed by the workforce and community to contribute<br />
to society and ensure a strong and sustainable economy<br />
into the future. The LINC Tasmania network opens up<br />
the world of information, resources and adult learning<br />
services to our Tasmanian community for personal and<br />
professional growth. Skills Tasmania, as a business unit of<br />
the department since July 2013, is Tasmania’s State Training<br />
Authority, developing strategies and providing support,<br />
advice, opportunities and funding to deliver quality training<br />
to meet the needs of Tasmanians and our industries.<br />
Government <strong>Education</strong> and Training International (GETI)<br />
is Tasmania’s international education unit, and manages all<br />
matters in relation to fee paying international students in<br />
government secondary and senior secondary schools.<br />
Underpinning our priority areas: Bright Beginnings;<br />
Great Schools…Great Communities; and Purposeful Pathways<br />
are the department’s key drivers which collectively<br />
support a strong, robust and sustainable educational<br />
system. The department’s strategies, policies and initiatives<br />
are aligned to the key drivers, which strive to improve<br />
educational outcomes for Tasmanian learners.<br />
Successful Learners<br />
The department’s mantra is learners first, connected and<br />
inspired. We place learners first – meaning they are at the<br />
forefront of everything we do as a department. We seek<br />
to connect them to education, their community and the<br />
world. We seek to inspire them, to encourage them<br />
to grow and achieve, and to be the best they can be.<br />
We strive to engage and retain learners with creative and<br />
innovative learning programs, and the individual support<br />
mechanisms they need to be successful. It is important<br />
that their learning environments are vibrant, appropriate<br />
and inspiring.<br />
A wealth of research supports the benefits of investment<br />
in the early years of a child’s life. The significant investment<br />
in Launching into Learning (LiL) and child and family centres<br />
is based on the belief that parents are their child’s first<br />
and most influential teacher. Engaging in partnerships with<br />
families in education before children begin Kindergarten<br />
is more effective in achieving a wider range of successful<br />
outcomes for students than interventions later in life.<br />
The most recent analysis from the Launching into Learning<br />
Longitudinal Study 2007–2014 Progress Report 2012<br />
further demonstrates that regular participation in<br />
LiL consistently and significantly improves educational<br />
outcomes across all main performance measures,<br />
particularly literacy and numeracy. Strong connections are<br />
being developed between LiL and the 12 child and family<br />
centre communities to strengthen and support<br />
the engagement of families.<br />
Our schools are implementing the Australian Curriculum.<br />
Prep–Year 10 students are currently being assessed<br />
against the Australian Curriculum in English, Mathematics,<br />
Science and History which are mandated areas of study<br />
in the curriculum. Assessment in all other learning areas<br />
remains under the Tasmanian Curriculum Framework.<br />
In 2014, Geography will be implemented from<br />
Prep–Year 8 and will be optional for Years 9 and 10.<br />
Schools will also be trialing Health and Physical <strong>Education</strong>.<br />
6 Department at a Glance » Strategic Focus
Tasmania, along with other states, has endorsed the<br />
senior secondary Australian Curriculum for English,<br />
Mathematics, Science and History as the agreed and<br />
common base for development of senior secondary<br />
courses. Processes and timelines are being determined<br />
during 2013. Eight curriculum teacher leaders with specific<br />
learning area responsibility across Years 9–12 have been<br />
appointed to provide direct school-based learning area<br />
support with a senior secondary focus.<br />
The department’s Literacy and Numeracy Framework guides<br />
the work of schools in literacy and numeracy. Based on<br />
the framework, every school has an explicit literacy and<br />
numeracy strategy as part of their school improvement<br />
plan so that every child’s literacy and numeracy learning<br />
needs can be supported.<br />
Through the Lead School/Lead Teacher initiative and the<br />
development of the literacy and numeracy resource,<br />
Supporting Literacy and Numeracy Success – a teacher’s<br />
resource for Early Years to Year 12, the department continues<br />
to support teachers to build capacity in literacy and<br />
numeracy teaching and learning. In 2013, the lead teacher<br />
initiative was expanded into Years 11 and 12. Curriculum<br />
teacher leaders support their colleagues in senior<br />
secondary schools with curriculum implementation as well<br />
as supporting literacy and numeracy teaching and learning.<br />
Further commitment to improving the literacy and<br />
numeracy outcomes of students is demonstrated through<br />
the department’s successful needs-based Raising the<br />
Bar (RTB) initiative, which has a particular emphasis on<br />
targeting disadvantage. In 2013, 51 primary and secondary<br />
schools are participating in RTB. This commitment is also<br />
demonstrated through an action research project to<br />
improve literacy and numeracy across Years 5–8. In 2013,<br />
participating schools and their primary school clusters are<br />
exploring how to improve literacy and numeracy with an<br />
emphasis on transition from primary to secondary school.<br />
Whole-school ownership of school improvement plans<br />
and student performance is becoming increasingly<br />
evident as school data is used more effectively and is<br />
integral to school improvement planning processes.<br />
The department is supporting the capacity of teachers<br />
and principals to effectively interpret and use data at the<br />
classroom, school and system level through a range of<br />
services. Examples of these include the development of<br />
systems to collect, manage and report on student data<br />
such as the NAPLAN Toolkit, the provision of a range of<br />
reports around student assessments – including NAPLAN<br />
data, and links to inform teaching and learning strategies.<br />
This increased use of data to inform planning, targeted<br />
intervention and support is a sustainable feature across<br />
all our schools.<br />
Further support for teachers and schools to collect, store,<br />
access and utilise data to inform improvement planning is<br />
the development of a dynamic data warehouse that will<br />
provide accurate, up-to-date data regarding all aspects<br />
of the schools context. Access to this information will be<br />
available to teachers and schools through a secure web<br />
portal which will further enhance schools’ capacity to<br />
monitor students’ outcomes and ensure that schools are<br />
effective and efficient.<br />
The Student Support System (SSS), which was rolled-out<br />
to schools from first term 2013, assists schools to record<br />
observations, actions and strategies used to support<br />
students. Student information follows the students as they<br />
move between schools—enabling principals, teachers<br />
and support staff to further support students with their<br />
learning needs. SSS provides valuable information regarding<br />
the support needs of particular groups of students such<br />
as students with disability, students with complex medical<br />
needs, and students under Care and Protection Orders.<br />
Closing the gap between Aboriginal and non-Aboriginal<br />
student outcomes in Tasmania is one of our top priorities.<br />
We continue to address the national Aboriginal and<br />
Torres Strait Islander education agenda through the<br />
implementation of its Closing the Gap on Aboriginal <strong>Education</strong><br />
Outcomes 2010–2014: a strategy for Aboriginal student success<br />
through school improvement. This strategy outlines a series<br />
of initiatives to improve the success of Aboriginal students<br />
in schools by supporting the particular needs of individual<br />
schools, students and their families. The strategy includes<br />
initiatives aimed at building the capacity of the Tasmanian<br />
education system to deliver quality, inclusive teaching and<br />
leadership for Aboriginal students.<br />
Department at a Glance » Strategic Focus<br />
7
In late 2012, our Lesbian, Gay, Bisexual, Transgender and<br />
Intersex Strategic Working Group (with stakeholder<br />
representation) helped produce the comprehensive<br />
resource: Guidelines for Supporting Sexual and Gender<br />
Diversity in Schools and Colleges. Through our values of<br />
equity, respect and relationships, we are committed<br />
to providing equal opportunity and access for all<br />
people. Inclusive language can play an important role in<br />
acknowledging everyone and treating all people equitably<br />
and with the sensitivity and respect to which they are<br />
entitled. Hence we have developed Guidelines for Inclusive<br />
Language. The department also launched a new strategy<br />
for sexuality and relationship education to support schools<br />
to deliver development-appropriate relationships and<br />
sexual education.<br />
There is strong evidence that completing a formal<br />
qualification has many benefits for learners, including<br />
direct economic and social benefits. The vast majority<br />
of jobs today and in the future will require higher-level<br />
formal qualifications and ongoing learning opportunities.<br />
Improving youth transitions and engaging students so they<br />
stay in education and training to gain meaningful Year 12<br />
or equivalent qualifications is the focus of a number of<br />
reform initiatives and complimentary actions undertaken<br />
during 2012–13. Tasmania’s implementation of the Youth<br />
Attainment and Transitions National Partnership and the<br />
Australian Government’s Trade Training Centres in Schools<br />
program together with the Retention and Attainment<br />
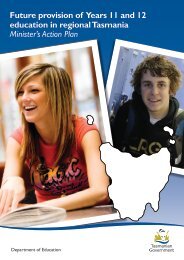
Strategy Years 10–12, Guaranteeing Futures initiatives and<br />
the Minister’s Action Plan for the future provision of Years<br />
11 and 12 education in regional Tasmania are examples<br />
of significant work aimed to support improved rates of<br />
attainment and completion.<br />
Future work will also be informed by the partnership<br />
with the University of Tasmania (UTAS) on the research<br />
Linkage Project: Beyond the Compulsory Years in Rural,<br />
Regional and Disadvantaged Communities Project. This threeyear<br />
collaborative project will inform our work on<br />
developing and implementing effective interventions<br />
in Tasmania to enhance student retention, attainment<br />
and completion.<br />
The department is developing an eStrategy to ensure that<br />
learners can access and fully engage with the opportunities<br />
for 21 st century learning enabled by digital technologies.<br />
Current priorities include the deployment of an integrated<br />
Virtual Learning Environment (VLE) that provides schools<br />
with a common and contemporary toolset to support<br />
anywhere, anytime learning; increasing the ongoing support<br />
for the digital repository of learning resources that supports<br />
the Australian Curriculum implementation in Tasmanian<br />
schools; and the delivery of new professional learning<br />
programs through the Professional Learning Institute to<br />
build leadership and teacher capacity—particularly to<br />
support digitally enriched teaching for 21 st century skills<br />
and capabilities.<br />
Strategic partnerships have also been established and<br />
strengthened to provide access to professional learning<br />
and resources for Tasmanian teachers and leaders in<br />
best practice use of technology. Examples include world<br />
leaders in learning support such as Apple <strong>Education</strong>,<br />
Microsoft Partners in Learning, and Pearson.<br />
As the National Broadband Network continues to be<br />
connected in regional areas around the state, schools will<br />
be able to offer a wider range of courses to their students.<br />
This will lead to improved access to subject specialists<br />
across the state, particularly in the mathematics and<br />
science curriculum areas. Students will be able to<br />
collaborate and interact with other students nationally<br />
and internationally and will be able to undertake virtual<br />
excursions by using high definition video lessons with<br />
experts in their field.<br />
International education in Tasmania enriches our<br />
learners and community on many levels and studying<br />
abroad brings our international students great benefits.<br />
Learning alongside students from diverse cultural<br />
backgrounds gives Tasmanian students the opportunity<br />
to understand cultural differences and become effective<br />
participants in the global community. The department is<br />
working with UTAS, through the partnership agreement,<br />
on strategies to increase international student enrolments<br />
in Tasmania.<br />
8 Department at a Glance » Strategic Focus
An Innovative Workforce<br />
A motivated, qualified, and supported workforce is the<br />
key to an innovative organisation. The department places<br />
a high value on recognising, rewarding and retaining<br />
employees with diverse skills who work across the<br />
department. Professional learning and development<br />
supports the growth of a successful, skilled, innovative<br />
workforce and inspiring leadership.<br />
Employees feel valued when their health and wellbeing<br />
needs are put at the forefront, with key strategies that<br />
enhance welfare and commitment. To create an effective<br />
and efficient organisation, it is important that staff in all<br />
areas have the required knowledge and skills to support<br />
each other for learning, growth and achievement.<br />
In September 2012, in response to Employment Direction<br />
No. 26 – Managing Performance in the State Service, we<br />
introduced the Performance and Development Framework.<br />
By June 2013, over 98% of staff had participated in a<br />
performance and development meeting with their<br />
line manager and had a Performance and Development<br />
Plan (PDP) in place. This PDP identifies individual key<br />
performance goals and professional development needs.<br />
As part of the PDP process, all plans are revisited and<br />
updated annually.<br />
As part of our commitment to the health and wellbeing<br />
of our staff, the department, in conjunction with the<br />
Department of Health and Human Services and<br />
Workplace Standards Tasmania, contributed to the<br />
development of a Healthy Workplace Resource Toolkit<br />
– Your Simple Guide to Workplace Health and Wellbeing.<br />
This toolkit was trialed in a number of departmental<br />
settings across the state and will be further promoted as a<br />
major resource throughout the next year. Staff awareness<br />
of the Healthy@Work program and related initiatives has<br />
been raised through regular articles in departmental<br />
newsletters. The department’s Healthy@Work staff<br />
intranet site has been redesigned to provide staff with a<br />
consolidated health and wellbeing related resource.<br />
In terms of providing professional learning for all staff,<br />
including non-teaching staff, we are one of the most<br />
progressive education departments in Australia.<br />
The Professional Learning Institute (PLI) is responsible for<br />
delivering and brokering high quality professional learning<br />
for all staff in the department and ensures the realisation<br />
of our vision of a successful, skilled and innovative<br />
workforce. In partnership with the PLI, a major Corporate<br />
Services Division professional development program<br />
was delivered in-house to 277 staff with workshops in<br />
collaboration and team building; conflict resolution and<br />
negotiation; and critical thinking and problem solving<br />
(collectively known as the 3Cs). The PLI will release<br />
its 2014 Prospectus for all departmental employees in<br />
October 2013.<br />
Department at a Glance » Strategic Focus<br />
9
Inspired Leadership<br />
Leadership is about having the knowledge, skills and<br />
courage to influence others. It is not necessarily about<br />
position, but rather about making a difference. The<br />
Professional Learning Institute (PLI) provides a range of<br />
programs that support aspiring, newly appointed and<br />
experienced leaders across the department as well as<br />
programs that equip leaders with the skills to manage<br />
and encourage innovation and continuous improvement.<br />
Some of these programs are: Leadership Starts from Within,<br />
Leading Teaching and Learning; and Shadowing Program<br />
for Aspiring Principals. These programs are reflective of<br />
our strategic plan, with a particular emphasis on the key<br />
drivers of Inspired Leadership and An Innovative Workforce.<br />
In 2012 and 2013, four leadership development programs<br />
for principals newly appointed to their school and for<br />
beginning principals have been delivered. The programs<br />
address the knowledge and skill-sets that principals require<br />
and include in-depth learning on departmental policies,<br />
procedures and structures, including the Learners First<br />
Strategy and the Literacy and Numeracy Framework.<br />
The PLI works closely with the department’s Aboriginal<br />
<strong>Education</strong> Services to provide programs that focus on<br />
understanding the conditions that promote culturally<br />
diverse learning environments and how to achieve<br />
culturally responsive education. This engagement<br />
underpins efforts to improve outcomes for Aboriginal<br />
students in Tasmania and supports the implementation<br />
of the Australian Curriculum. The PLI has brokered a<br />
program through the Principals Australia Institute aimed at<br />
developing quality leaders in Aboriginal and Torres Strait<br />
Islander <strong>Education</strong>. The program is designed to provide<br />
for personal growth and to give participants a number of<br />
practical applications to draw upon for use in their school<br />
communities. All aspects of the program encompass the<br />
directions of the National Agenda in Aboriginal and Torres<br />
Strait Islander <strong>Education</strong>.<br />
To further develop the leadership capacity of principals<br />
and managers, the department, in conjunction with the<br />
Centre for Strategic <strong>Education</strong>, hosted a series of inspiring<br />
workshops with internationally renowned educationalists,<br />
Dr Valerie Hannon and Dr Yong Zhao. The theme<br />
of their workshops was 21 st century learning with<br />
particular reference to innovation and entrepreneurship.<br />
In October 2013, Professor Michael Fullan will address<br />
senior leaders of the department at the second<br />
Leadership Symposium. Building learning cultures in our<br />
schools and education system is fundamental to school<br />
improvement. To this end, Professor Geoff Masters will<br />
return to Tasmania to continue his work with principals on<br />
the Teaching and Learning School Improvement Framework.<br />
Dynamic Learning<br />
Environments<br />
The department has undergone an organisational<br />
change as a result of the passage through parliament<br />
of the Training and Workforce Development Act 2013.<br />
With the commencement of TasTAFE on 1 July 2013,<br />
the Polytechnic no longer exists as a business unit of the<br />
department. TasTAFE was created from the combined<br />
resources of the Tasmanian Polytechnic and Tasmanian<br />
Skills Institute. Also on 1 July 2013, Skills Tasmania<br />
became a business unit of the department. This means<br />
the department no longer has a service delivery<br />
function for vocational education and training, and now<br />
has responsibility for policy development and funding<br />
of training to meet the needs of Tasmanians and<br />
Tasmanian industries.<br />
The network structure implemented in 2012 supports<br />
school and system improvement, improved student<br />
learning outcomes and reform. Eleven principal network<br />
leaders work to build the capacity of school principals<br />
and provide at-the-shoulder support to principals to lead<br />
and manage school improvement and accountability and<br />
provide dynamic learning environments for our students.<br />
In 2014, Tasmania will implement Better Schools Tasmania.<br />
This reform will support the improvement of educational<br />
outcomes for young Tasmanians, especially those from<br />
disadvantaged backgrounds. Better Schools Tasmania<br />
includes a National Plan for School Improvement that is<br />
centred on teacher quality, quality learning, empowered<br />
school leadership, meeting student need and transparency<br />
and accountability.<br />
Through LINC Tasmania’s network service model, the<br />
department extends learning opportunities to the wider<br />
community, in particular those who may have disengaged<br />
from formal education, or those who have experienced<br />
barriers to learning. LINC sites offer Tasmanians a place<br />
to take first steps into the learning process through<br />
community learning courses, information sessions,<br />
small group and one-to-one sessions.<br />
LINC Online connects Tasmanians anywhere, anytime to<br />
local, national and international resources for use in work<br />
and daily life. Ongoing support of online access centres,<br />
and the extension of free public Wi-Fi in 2012–13 to<br />
urban and regional LINCs, continues the department’s<br />
commitment to providing flexible, convenient access to<br />
the internet and web-based services.<br />
Many libraries have been remodelled to accommodate<br />
these new and emerging needs. In 2012–13 a new<br />
purpose-built LINC opened at Scottsdale, and<br />
Bridgewater LINC was recognised in the 2013 Tasmanian<br />
Architecture Awards.<br />
10 Department at a Glance » Strategic Focus
Community Confidence<br />
The department is committed to providing the Tasmanian<br />
public with open, transparent and timely information so<br />
they can be confident that Tasmanian students are receiving<br />
high-quality and relevant education. The department’s<br />
strategic plan, and a number of initiatives supporting the<br />
plan, including the Literacy and Numeracy Framework and<br />
the department’s key drivers and associated policies,<br />
demonstrate our commitment to open and transparent<br />
communication.<br />
To further demonstrate our commitment to quality<br />
communication with the community, the department<br />
has sought feedback from the public in relation to major<br />
initiatives such as the move to a four-term school year,<br />
the review of the role and function of Tasmania’s public<br />
VET providers, and the future provision of Years 11 and 12<br />
education in regional Tasmania and home areas. Individuals<br />
and organisations from all walks of life provide valuable<br />
feedback which the department takes into consideration<br />
when forming policy, programs and services that further<br />
support education in Tasmania.<br />
We continually check our knowledge and understanding<br />
of educational trends to inform current and future<br />
decision making. The Professional Learning Institute<br />
plays a major role in brokering research projects for<br />
the department. We have partnered with UTAS for<br />
an Australian Research Council Linkage Grant and are<br />
undertaking a research project titled: Student Retention<br />
Beyond the Compulsory Years in Rural, Regional and<br />
Disadvantaged Communities Project. We are also working<br />
with UTAS on the action research project: Supporting<br />
Literacy and Numeracy across Years 5 to 8.<br />
As part of our commitment to providing free, high quality<br />
information services accessible to all Tasmanians, the<br />
department continues to support a network of LINCs,<br />
libraries, and online access centres where community<br />
members can access a range of publications and online<br />
resources. This includes a comprehensive collection of<br />
Tasmania’s documentary history, as part of the legislated<br />
roles of the State Library and Tasmanian Archive and<br />
Heritage Office.<br />
In late 2012, the department launched its new website,<br />
www.education.tas.gov.au with the aim of providing<br />
relevant, up-to-date and easy to find information for the<br />
community. We also initiated a Facebook page that has<br />
been well utilised. Twitter, Flickr and other social media<br />
platforms are used to further communicate with parents,<br />
students and communities.<br />
As part of our commitment, the department will<br />
continue to work collaboratively with students, parents,<br />
stakeholders and the broader community to shape our<br />
education system to best meet the needs of current and<br />
future students.<br />
Department at a Glance » Strategic Focus<br />
11
Services<br />
There were 203 government schools 1 at the<br />
commencement of 2013 – including senior secondary<br />
schools and the Tasmanian Polytechnic, comprising: 2<br />
• 131 primary<br />
• 30 secondary<br />
• 25 combined (Kindergarten–Year 10)<br />
• 8 senior secondary 3<br />
• 1 polytechnic (in various locations across the state)<br />
• 8 special. 4<br />
Schools (not including the Tasmanian Polytechnic) are<br />
distributed across the following Learning Services:<br />
• Learning Services (North) – 56<br />
• Learning Services (North-West) – 55<br />
• Learning Services (South) – 91.<br />
<strong>Education</strong> services for students who are unable to attend<br />
a school are provided by the Tasmanian eSchool.<br />
The LINC Tasmania network provides services through<br />
89 physical service points in 69 locations across the state,<br />
together with LINC Online.<br />
1. This is a count of school entities and is not a count of school campuses.<br />
2. Includes school changes as at the commencement of 2013 – see<br />
‘New arrangements’ section in this chapter for further information.<br />
3. Senior secondary schools were previously referred to as colleges.<br />
4. Count of special schools includes four Early Childhood Intervention<br />
Service Centres. Although these are services, they are classified in<br />
the department’s organisational structure as ‘schools’.<br />
Early Years and Schools<br />
The Early Years and Schools Division delivers its services<br />
to approximately 63,000 school aged students 1,2 attending<br />
203 schools. It oversees schooling delivered through<br />
programs operating in schools, senior secondary schools<br />
and in established child and family centres. <strong>Education</strong>al<br />
leadership within Early Years and Schools is provided by a<br />
Deputy Secretary with support from a General Manager<br />
for Curriculum and Program Services and General<br />
Managers in three Learning Services.<br />
Eleven networks of schools across the three<br />
Learning Services are each supported by a principal<br />
network leader whose role is to support the school<br />
principal with a focus on school improvement and<br />
accountability.<br />
The Early Years and Schools Division is continuing to<br />
progress the priorities outlined in the department’s<br />
Learners First Strategy and key areas outlined in<br />
the School Support and Expectations 2013 resource.<br />
2013 has seen an ongoing emphasis on the implementation<br />
of the Australian Curriculum. During 2012, English,<br />
Mathematics and Science was successfully implemented<br />
in all schools. History was voluntarily taken up by almost<br />
half of the schools. In 2013, all government schools are<br />
implementing the Foundation to Year 10 (F–10) History<br />
curriculum and some schools have voluntarily opted to<br />
implement the F–10 Geography curriculum.<br />
Improving literacy and numeracy will always be a priority<br />
for the department. In alignment with the Literacy and<br />
Numeracy Framework 2012–2015 the department has<br />
developed birth to Year 12 literacy and numeracy support<br />
packages for teachers. Lead teachers in literacy and<br />
numeracy in each network provide direct support to<br />
schools and teachers. Eight curriculum teacher leaders<br />
with specific learning area responsibility across<br />
Years 9–12 have been appointed to provide direct<br />
school based support for the Australian Curriculum with<br />
a focus on literacy and numeracy.<br />
Student safety, health and wellbeing are important<br />
priorities. The Early Years and Schools Division is<br />
developing the Building Better Behaviour resource for all<br />
staff, to enable whole school approaches that support<br />
positive classroom management and teacher and learner<br />
wellbeing. This will be launched in October 2013.<br />
The division is responsible, through its regulatory<br />
authority, for implementing the National Quality Framework<br />
for Early Childhood <strong>Education</strong> and Care. This includes a<br />
national system of regulation, and assessment and rating<br />
of education and care services which aim to improve the<br />
quality of outcomes for children attending these services.<br />
The regulatory authority also licenses and monitors a<br />
number of other child care services, mostly occasional<br />
care, under Tasmanian legislation.<br />
1. Includes students in all senior secondary schools (previously referred to<br />
as colleges). Senior secondary students were not included in the figures<br />
published in the 2011–12 Annual Report given that the colleges were not<br />
part of the Early Years and Schools Division during that period.<br />
2. Does not include the students in the Tasmanian Polytechnic.<br />
Aboriginal <strong>Education</strong> Services (AES) supports<br />
schools, child and family centres and Learning Services in<br />
their programs and services for Aboriginal students and<br />
their families. The work of the service is closely aligned<br />
to the six priority areas of the Closing the Gap Strategy<br />
which is at the centre of the Australian Government’s<br />
National Indigenous Reform Agenda and the Tasmania’s<br />
Aboriginal <strong>Education</strong> Framework 2012–2015. AES provides<br />
comprehensive support to schools to address the<br />
challenges of readiness for school, engagement and<br />
connections, attendance, literacy and numeracy, leadership,<br />
quality teaching, workforce development and pathways<br />
to post-school options. AES plays a key role in the<br />
development of the department’s policies and initiatives.<br />
Curriculum Services has a team of curriculum<br />
officers who work with the Professional Learning Institute,<br />
Learning Services, <strong>Education</strong>al Performance Services,<br />
Information Technology Services and the Tasmanian<br />
Qualifications Authority to provide teachers and school<br />
leaders with support to implement the Australian<br />
Curriculum and deliver the Tasmanian Curriculum. The team<br />
provides targeted curriculum and pedagogical support<br />
for school leaders through curriculum teacher leaders,<br />
principal network leaders, literacy and numeracy lead<br />
teachers, local networks and lead schools. It supports<br />
dynamic learning environments through access to high<br />
quality digital resources and networks. Curriculum Services<br />
supports improved literacy and numeracy outcomes<br />
through a lead school network model of statewide<br />
support for literacy and numeracy. Curriculum Services<br />
also provides high level educational leadership in each of<br />
the curriculum learning areas and supports developing<br />
program continuity to assist transition and retention from<br />
Years 9–12. In addition, it works in collaboration with<br />
relevant inter-agency and community service providers to<br />
promote health and wellbeing learning outcomes.<br />
Early Years is responsible for the promotion of early<br />
years learning for young children. The Early Years team<br />
provides support for schools and their communities in<br />
12 Department at a Glance » Services
the implementation of high quality programs and effective<br />
practices that support learning from birth to Kindergarten.<br />
Belonging, Being, Becoming – The Early Years Learning<br />
Framework for Australia is the curriculum framework that<br />
guides the team’s practice and has been designed for use<br />
by early childhood teachers to work in partnership with<br />
families, children’s first and most influential educators.<br />
There is a strong focus and a specific emphasis on play<br />
based learning and recognition of the importance of<br />
communication and language including early literacy<br />
and numeracy, and social and emotional development.<br />
The team’s work assists the ongoing implementation and<br />
development of Launching into Learning, which supports<br />
families and young children in school communities.<br />
Support is also provided to child and family centres.<br />
The <strong>Education</strong> and Care Unit (ECU) regulates<br />
education and care (child care) in Tasmania. The unit, as the<br />
Tasmanian Regulatory Authority, is responsible for the<br />
implementation of the National Quality Framework for Early<br />
Childhood <strong>Education</strong> and Care, including the administration<br />
of the <strong>Education</strong> and Care Services National Law (Tasmania)<br />
2011. ECU also administers the Child Care Act 2001.<br />
The unit supports and monitors the development of<br />
high quality education and care programs and services in<br />
Tasmania, including administration of a nationally consistent<br />
assessment and rating process and the implementation<br />
of Belonging, Being and Becoming – The Early Years Learning<br />
Framework for Australia and My Time, Our Place – Framework<br />
for School Age Care in Australia.<br />
<strong>Education</strong>al Performance Services (EPS) monitors<br />
and measures student outcomes in the pre-compulsory<br />
and compulsory years of schooling including achievement<br />
against the national benchmarks established under the<br />
National Assessment Program – Literacy and Numeracy<br />
(NAPLAN). EPS also provides statewide support and<br />
advice for teacher assessment and reporting against the<br />
standards of the Tasmanian Curriculum and the Australian<br />
Curriculum as it is being progressively implemented by<br />
schools. EPS is directed towards Tasmanian compliance<br />
with national assessment program requirements and<br />
national reporting for the schooling sector to the end<br />
of Year 12. EPS has representation at a national level in<br />
a number of forums around Tasmania’s performance,<br />
public reporting and accountability requirements.<br />
EPS monitors and reports on the educational<br />
accountability information required for specific purpose<br />
programs and is also responsible for corporate reporting<br />
and facilitating the collection, storage and utilisation of<br />
student and school data. In addition to this, EPS develops<br />
and implements systems such as the Student Support<br />
System and the NAPLAN Toolkit designed to support<br />
classroom teachers and provide the capacity for statewide<br />
analysis of student data.<br />
The English as an Additional Language (EAL)<br />
Program focuses on improving educational opportunities<br />
and outcomes for newly arrived students by providing<br />
resources that develop English language competence and<br />
facilitate participation in mainstream educational activities.<br />
Proficiency in Standard Australian English is crucial to<br />
achieving successful learning outcomes in all areas of the<br />
curriculum. EAL Program support is delivered by EAL<br />
teachers and teacher assistants according to the needs of<br />
the students enrolled in each school.<br />
eLearning supports flexible provision across the<br />
department. In addition, the Flexible Learning Network<br />
provides a collaborative structure to deliver academic,<br />
general and vocational study options for senior secondary<br />
students. eLearning manages the online learning tools<br />
and collection of digital resources that support quality<br />
teaching and learning for the Australian Curriculum.<br />
This includes the deployment of a new Virtual Learning<br />
Environment across Tasmanian schools. eLearning manages<br />
the coordination and delivery of a variety of online<br />
courses and opportunities to students throughout<br />
Tasmania that complement local provision and provide<br />
access to educational experiences and opportunities that<br />
would otherwise be unavailable, e.g. programs for<br />
gifted/highly-able students and other core and<br />
extension courses such as languages.<br />
Learning Services (North, North-West and South)<br />
provide support for networks of schools through the<br />
services of a general manager in each Learning Service,<br />
principal network leaders, specialist staff such as social<br />
workers, school psychologists, speech and language<br />
pathologists, autism consultants and inclusive learning<br />
leaders; and various support staff.<br />
The Professional Learning Institute (PLI)<br />
supports the growth of a successful, skilled, innovative<br />
workforce and inspiring leadership in the department.<br />
The development of the new institute began in 2011.<br />
The work of the PLI is integral to the mission of the<br />
department—to provide every Tasmanian with the<br />
opportunity to continue to learn and reach their potential<br />
to lead fulfilling lives and to contribute positively to the<br />
community. In line with the department’s Learners First<br />
Strategy, the PLI places high priority on promoting a strong<br />
leadership culture.<br />
The State Support Service provides resourcing and<br />
support for students in schools with hearing loss and<br />
those who are visually impaired, through the support of<br />
the vision services team, Braille production, teachers of<br />
the deaf and Auslan interpreters. Programs to support<br />
assistance with transport, minor works, and contingency<br />
support for students new to our system are also provided.<br />
Other services are provided through the three Learning<br />
Services and through the Early Childhood Intervention<br />
Service for students with severe disabilities and those with<br />
high and additional needs. The Learning Services also have<br />
a team of specialist staff such as social workers, school<br />
psychologists, speech and language pathologists, autism<br />
consultants and inclusive learning leaders.<br />
The Strategic Policy and Planning (SPP) unit<br />
supports the Secretary and Deputy Secretary by providing<br />
high level advice on the development and implementation<br />
of the department’s strategic policies including advice on<br />
cross-agency issues and responsibilities. SPP assists the<br />
Secretary and Deputy Secretary in the development of<br />
business plans including performance and accountability<br />
within the Early Years and Schools Division. SPP has<br />
oversight of the implementation and reporting of key<br />
national partnerships and agreements.<br />
Department at a Glance » Services<br />
13
Further <strong>Education</strong> and Training<br />
The Further <strong>Education</strong> and Training Division is responsible<br />
for education and training beyond the compulsory years<br />
of school as well as library, archive and heritage services,<br />
and international education. From the commencement<br />
of 2012, LINC Tasmania became part of the<br />
Further <strong>Education</strong> and Training Division.<br />
The division’s responsibilities are reflected in the<br />
Budget Papers in some aspects of Output Group 2:<br />
Post-Compulsory <strong>Education</strong> and Skills Development<br />
(Tasmanian Polytechnic, Tasmanian Academy, and<br />
Post-Compulsory <strong>Education</strong> in Schools), and<br />
Output Group 3: LINC Tasmania.<br />
The services provided by the division are delivered<br />
through the following areas:<br />
<strong>Education</strong> and training beyond Year 10 is provided through<br />
the Tasmanian Polytechnic and the eight colleges<br />
of the Tasmanian Academy 1 , which deliver services<br />
to approximately 25,000 students. Some combined and<br />
regional secondary schools also provide education and<br />
training services beyond Year 10—either on their own<br />
or in partnership with the Tasmanian Polytechnic or<br />
Tasmanian Academy.<br />
The Tasmanian Polytechnic provides industryrelevant,<br />
applied learning opportunities for Tasmanians<br />
for the purposes of work preparation and career<br />
development. It delivers nationally recognised<br />
qualifications from Certificate 1 to Advanced Diploma<br />
across a wide range of industry areas. It supports students,<br />
particularly those re-engaging with learning, and wherever<br />
practical works with rural and regional communities<br />
to expand their access to education and training<br />
opportunities. During this reporting period the state<br />
government announced the establishment of TasTAFE<br />
utilising the combined resources of the Tasmanian<br />
Polytechnic and Tasmanian Skills Institute. The Tasmanian<br />
Polytechnic ceased operations on 30 June 2013. TasTAFE<br />
commenced operations on 1 July 2013.<br />
The Tasmanian Academy 1 provides Year 11 and Year<br />
12 education services to young students to support their<br />
achievement of the Tasmanian Certificate of <strong>Education</strong><br />
(TCE), and supported pathways for their entry into the<br />
workforce or further education and training. Through its<br />
eight colleges 2 , the Tasmanian Academy provides students<br />
with pastoral care together with a diverse selection of<br />
academic and vocational courses, the latter of which<br />
may be provided in partnership with the Tasmanian<br />
Polytechnic or other providers. During 2012–13 the<br />
administration of the Tasmanian Academy moved to the<br />
Early Years and Schools Division. This transition involved<br />
college principals and senior officers and was part of a<br />
strategy to support curriculum continuity for Kindergarten<br />
to Year 12.<br />
1. The Tasmanian Academy, which was a collective name for the eight<br />
senior secondary colleges, is no longer in use (as of Term 1, 2013).<br />
2. Colleges are now referred to as senior secondary schools (as of<br />
Term 1, 2013).<br />
Government <strong>Education</strong> and Training<br />
International (GETI) represents Tasmanian<br />
Government education and training providers to the<br />
world. GETI specialises in connecting international students<br />
and businesses with flexible education and training<br />
development solutions, from Tasmanian Government<br />
education providers:<br />
• Tasmanian Government schools<br />
• The Tasmanian Polytechnic<br />
• The Tasmanian Skills Institute.<br />
GETI also has a strong partnership with the University<br />
of Tasmania, enabling pathways with credit towards<br />
university study for international students.<br />
The Pathways and Participation Unit 1 supports<br />
senior secondary students to continue in education and<br />
training beyond Year 10 through initiatives such as pathway<br />
planning, career awareness programs and Australian<br />
School-based Apprenticeships. Trade training centres and<br />
VET in Schools are also coordinated by this unit.<br />
1. As at 30 June 2013, management of the unit is progressively transitioning<br />
from the Further <strong>Education</strong> and Training Division to the Early Years and<br />
Schools Division.<br />
LINC Tasmania is a statewide network which<br />
provides Tasmanians with integrated access to library and<br />
information services, adult literacy support, community<br />
learning programs, online access and archive and heritage<br />
services. LINC Tasmania’s model of service delivery aims<br />
to extend services to more Tasmanians—particularly<br />
those who need to develop skills or need support to<br />
access information or use new technology or participate<br />
more fully in work and community life. The network<br />
comprises an online service channel (LINC Online<br />
www.linc.tas.gov.au), along with 89 physical service points<br />
in 69 locations across the state, including:<br />
• urban and regional Learning and Information Network<br />
Centres (LINCs), including Risdon Prison LINC<br />
• online access centres<br />
• branch libraries<br />
• the Hobart LINC, Tasmanian Archive and Heritage<br />
Office and State Library Service (located in the<br />
91 Murray Street building).<br />
As part of LINC Tasmania, the Tasmanian Archive and<br />
Heritage Office preserves and manages the cultural<br />
memory and documentary record of Tasmania, including<br />
the legal framework for government recordkeeping.<br />
Corporate Services<br />
The Corporate Services Division provides support to<br />
service delivery areas across the department through<br />
business units responsible for corporate support, policy<br />
development, regulation and assessment and review.<br />
The services provided by the division are delivered<br />
through the following areas:<br />
Communication Services manages internal and<br />
external communication and media, responds to enquiries<br />
from the media and issues media releases. The unit<br />
provides a media advisory service to the department,<br />
develops policy on communication strategies for<br />
education programs and initiatives, and assists with major<br />
education events.<br />
Employee Relations provides guidance, advice and<br />
support for Work Health and Safety, Injury and Risk<br />
Management, Workplace Relations Consultancy and<br />
Regional HR Services. Employee Relations provides<br />
advocacy services for matters before the Industrial<br />
14 Department at a Glance » Services
Commission and other Tribunals. The unit manages all<br />
internal employee grievances and formal investigations<br />
regarding suspected breaches of the State Service Code<br />
of Conduct or Inability. Employee Relations manages good<br />
character checks for department staff and safety screening<br />
checks for <strong>Education</strong> and Care (child care).<br />
Facility Services ensures that the department has high<br />
quality, accessible, functional, well maintained, safe and<br />
secure facilities for the appropriate and effective delivery<br />
of education, skills and LINC Tasmania services across the<br />
state. The unit provides support for innovative strategic<br />
asset management across the department.<br />
Finance and Business Services (FABS) ensures<br />
that the department has a strong financial and resource<br />
management focus and infrastructure to enable the<br />
appropriate and effective delivery of education, skills and<br />
LINC Tasmania services across the state. The unit operates<br />
accounts payable and accounts receivable transaction<br />
processing services as well as essential accounting and<br />
budget management services. FABS provides guidance in<br />
financial and budget management for the department and<br />
fosters an environment which supports strong financial<br />
management within the department, whilst enabling<br />
innovation and improvements to resource management<br />
across all areas of the department.<br />
Human Resource Services (HRS) provides<br />
advice and assistance in human resources (HR) policy<br />
development, implementation and support; general HR<br />
consultancy; payroll and employee benefits; staffing,<br />
vacancy and recruitment procedures; HR systems and<br />
reporting services; and in workers compensation and<br />
general injury management processes.<br />
Information and Technology Services (ITS)<br />
provides information and communications technology<br />
related services and support to schools, the Tasmanian<br />
Polytechnic, libraries and corporate units within the<br />
department. These services include the provision and<br />
maintenance of information technology infrastructure<br />
hardware and network services, the identification<br />
of opportunities for business improvement through<br />
technology, and the development and maintenance of<br />
standards and processes for information technology issues<br />
across the department. ITS is responsible for information<br />
and document management systems and processes<br />
including archiving and disposal schedules.<br />
Marketing Services is responsible for managing the<br />
department’s websites, developing publications such as<br />
enrolment guides and other information for parents and<br />
students, undertaking graphic design for publications and<br />
handling copyright for the department.<br />
department and the Ministers’ offices. The unit<br />
also assists with policy and administrative matters for<br />
the department.<br />
Legal Services provides support to school and<br />
non-school areas within the department on legal issues.<br />
Legal Services manages the department’s responsibilities<br />
under the Right to Information Act 2009 (previously the<br />
Freedom of Information Act 1991).<br />
Internal Audit provides the Secretary with reports<br />
on the administrative effectiveness and efficiency of<br />
programs conducted by the department and conducts<br />
special investigations as required.<br />
New arrangements<br />
• Andrews Creek Primary School established in 2013<br />
– an amalgamation of Wesley Vale and Moriarty<br />
primary schools.<br />
• Early Years and Schools Division took responsibility<br />
in 2013 for:<br />
º º senior secondary schools<br />
º º the Pathways and Participation unit.<br />
• Geeveston District High School became<br />
Geeveston Primary School (Kinder–Year 6) in 2013.<br />
• Jordan River Learning Federation became five<br />
separate schools in 2013.<br />
• Maydena Primary School was amalgamated into<br />
Westerway Primary School in 2013.<br />
• Port Sorell School was opened in 2013.<br />
• Timsbury Road School merged with the<br />
Southern Support School in 2013.<br />
Office of the Secretary<br />
The Office of the Secretary provides support to the<br />
Secretary, high level policy, administrative and legal<br />
services across the department, and liaison between the<br />
department and Ministers’ offices.<br />
Ministerial Services is the primary point of<br />
contact between the department and the office of the<br />
Minister for <strong>Education</strong> and Skills and the office of the<br />
Minister for Children, and is responsible for managing the<br />
flow of information, advice and documents between the<br />
Department at a Glance » Services<br />
15
Department of <strong>Education</strong> Organisation Chart<br />
This chart is current as at 30 June 2013. The chart is updated from time-to-time and the most recent version is available from<br />
http://www.education.tas.gov.au/About_us/Pages/Our-Structure.aspx . This chart represents the department’s reporting lines only;<br />
it does not portray functional relationships for some units.<br />
Early Years and<br />
Schools<br />
General Manager<br />
Alan Green<br />
Aboriginal <strong>Education</strong><br />
Services<br />
Manager<br />
Greg Phair<br />
Curriculum Services<br />
Director<br />
Judy Hebblethwaite<br />
Manager<br />
Sue Tolbert<br />
State Support<br />
Services<br />
Manager<br />
Lynne James<br />
Early Years<br />
Principal Project Officer<br />
Cheryl Larcombe<br />
<strong>Education</strong> and Care<br />
Manager<br />
Lyn Chapman<br />
eLearning<br />
Principal Leader<br />
Phillip Walker<br />
English as an<br />
Additional Language<br />
(EAL)<br />
Principal Review Officer<br />
Jenny Barclay<br />
Secretary<br />
Colin Pettit<br />
Early Years and<br />
Schools<br />
Deputy Secretary<br />
Liz Banks<br />
Learning Services<br />
(South)<br />
General Manager<br />
Judy Travers<br />
Senior Secondary<br />
General Manager<br />
Graeme Young<br />
<strong>Education</strong>al<br />
Performance Services<br />
Director<br />
Tony Luttrell<br />
Principal Network<br />
Leaders<br />
Schools<br />
(South)<br />
Pathways and<br />
Participation<br />
Manager<br />
Pam Baker<br />
Professional Learning<br />
Institute<br />
Principal Leader<br />
John Ewington<br />
Learning Services<br />
(North-West)<br />
General Manager<br />
Bruce Cameron<br />
Strategic Policy<br />
and Planning 1<br />
Principal Network<br />
Leaders<br />
Schools<br />
(North-West)<br />
Learning Services<br />
(North)<br />
General Manager<br />
Laurie Andrew<br />
Principal Network<br />
Leaders<br />
Schools<br />
(North)<br />
1 The reporting line for Strategic Policy and Planning has changed – as shown above (post February 2013).<br />
Further <strong>Education</strong><br />
and Training<br />
Deputy Secretary<br />
Malcolm Wells<br />
Tasmanian<br />
Polytechnic<br />
General Manager<br />
Paul Murphy<br />
LINC Tasmania<br />
Director<br />
Jenny Rayner<br />
Government<br />
<strong>Education</strong> and<br />
Training International<br />
Executive Manager<br />
Anne Ripper<br />
Corporate Services<br />
Deputy Secretary<br />
Andrew Finch<br />
Finance and<br />
Business Services<br />
A/Director<br />
Nick May<br />
Human Resources<br />
Services<br />
Director<br />
Paul Gourlay<br />
Employee Relations<br />
Manager<br />
Mark Watson<br />
Facility Services<br />
Director<br />
Michelle Foster<br />
Information<br />
Technology Services<br />
Director<br />
Trevor Hill<br />
Communication<br />
Services Unit<br />
Manager<br />
Irena Blissenden<br />
Marketing Services<br />
Manager<br />
Katharine ODonnell<br />
Ministerial Services<br />
Manager<br />
Kirsty Henderson<br />
Legal Services<br />
Internal Audit<br />
Manager<br />
Mat Moore<br />
16<br />
Department at a Glance » Organisation Chart
Clients<br />
Number of education and child services in Tasmania 1<br />
April 2013<br />
Services in<br />
government<br />
school sites<br />
Total<br />
number of<br />
services<br />
Number of education and care services 2 70 224 3<br />
Number of licensed child care services 4 4 40<br />
Total 74 264<br />
1. This data is not comparable with data provided prior to the 2011–12 report as it<br />
reflects the number of services, rather than the service types (e.g. after school care,<br />
before school, long day care) reported previously.<br />
2. Number of services and places approved under the <strong>Education</strong> and Care National Law<br />
Act (Tasmania) 2011.<br />
3. There has been a reduction in services since 2011–12, largely because, under the<br />
national regulations, services provided on the same or adjacent site/s can have one<br />
service approval.<br />
4. Number of services and places licensed under the Child Care Act 2001. These services<br />
may transition to education and care services over time.<br />
Students 1<br />
as at August 2012<br />
School Type FTE Number<br />
Primary 2 30,645.8 32,442<br />
Secondary 14,263.5 14,276<br />
Combined 7,222.0 7,490<br />
Senior secondary 3 7,045.7 7,602<br />
Polytechnic 1,235.1 1,671<br />
Special 419.6 792<br />
Total 60,831.7 64,273<br />
1. Mid-year 2012 census data.<br />
2. The primary school FTE student count includes Kindergarten students who attend<br />
school on a part-time basis.<br />
3. Senior secondary schools were previously referred to as colleges.<br />
Class sizes (average number of students) 1, 2<br />
Sector 2011 2012 2013<br />
Kindergarten 19.2 19.3 19.5<br />
Primary 23.0 23.2 23.4<br />
Secondary 3 22.7 23.4 23.4<br />
1. First term 2013 census data.<br />
2. Class size is based on FTE for Prep to Year 10 and headcount for Kinder. The FTE<br />
of students in classes containing the relevant year levels is divided by the number of<br />
classes containing those year levels.<br />
3. Secondary school students are not organised into classes which exclusively undertake a<br />
complete education program, therefore the department has adopted the English class<br />
size as a proxy measure.<br />
School students in each<br />
Learning Service<br />
as at August 2012<br />
North-West<br />
Primary 7,702<br />
Secondary 3,958<br />
North-<br />
West<br />
North<br />
North<br />
Primary 9,184<br />
Secondary 4,184<br />
Combined 1,252<br />
Combined 2,940<br />
Senior secondary 1 1,687<br />
Senior secondary 1 2,126<br />
Special 203<br />
South<br />
Special 231<br />
South<br />
1. Senior secondary schools were previously referred to as colleges.<br />
Primary 15,556<br />
Secondary 6,134<br />
Combined 3,298<br />
Senior secondary 1 3,789<br />
Special 358<br />
Department at a Glance » Clients<br />
17
Proportion of active registered library users 1 by region<br />
as at 30 June 2013<br />
North-West<br />
28,786<br />
21.5%<br />
South<br />
70,364<br />
52.7%<br />
Percentage of active registered library users by gender<br />
as at 30 June 2013<br />
Male<br />
36.5%<br />
Unknown<br />
0.1%<br />
North<br />
34,489<br />
25.8%<br />
Female<br />
63.4%<br />
1. An active registered library user is a person who has a current library card and has<br />
used it in the last two years.<br />
Record retrievals for clients<br />
For use in the History Room at 91 Murray Street<br />
2010–11 2011–12 2012–13<br />
For public clients 12,717 10,538 11,636<br />
For government clients 1,377 1,337 1,286<br />
Total 14,094 11,875 12,922<br />
Visits to LINCs 1<br />
2012–13<br />
North-West<br />
686,201<br />
South<br />
1,696,187<br />
North<br />
767,465<br />
1. Includes physical visits to all LINCs, branch libraries, online access centres across<br />
the LINC Tasmania network and the 91 Murray Street complex incorporating the<br />
State Library and Tasmania Archive and Heritage Office.<br />
18 Department at a Glance » Clients
Active registered library users by age group<br />
as at 30 June 2013<br />
20,000<br />
15,000<br />
Count<br />
10,000<br />
5,000<br />
0<br />
No code 0-4 5-9 10-14 15-19 20-24 25-29 30-39 40-49 50-59 60-69 70-79 80-89 90-99<br />
Age Group<br />
99+<br />
Age Group Count<br />
No code 1,496<br />
0-4 6,884<br />
5-9 12,582<br />
10-14 12,511<br />
15-19 8,716<br />
20-24 7,236<br />
25-29 6,562<br />
30-39 14,461<br />
40-49 15,877<br />
50-59 15,538<br />
60-69 16,561<br />
70-79 9,898<br />
80-89 4,490<br />
90-99 779<br />
99+ 48<br />
Total 133,639<br />
Participation in LearnXpress courses by age group<br />
2012–13<br />
800<br />
700<br />
600<br />
Count<br />
500<br />
400<br />
300<br />
200<br />
100<br />
Age Group Count %<br />
0-9 15 0.47%<br />
10-19 32 1.00%<br />
20-29 260 8.10%<br />
30-39 289 9.01%<br />
40-49 410 12.78%<br />
50-59 620 19.33%<br />
60-69 621 19.36%<br />
70-79 363 11.32%<br />
80+ 198 6.17%<br />
not stated 400 12.47%<br />
Total 3,208 100.00%<br />
0<br />
0 - 9<br />
10-19<br />
20 - 29<br />
30-39<br />
40-49<br />
50-59<br />
Age Group<br />
60-69<br />
70-79<br />
80+<br />
not stated<br />
Department at a Glance » Clients<br />
19
Workforce<br />
Employment summary by departmental division<br />
full-time equivalent as at 30 June 2013<br />
Employment status of teachers<br />
as at 30 June 2013<br />
Corporate Services and<br />
Office of the Secretary<br />
390<br />
5%<br />
Part-time<br />
permanent<br />
33.3%<br />
Full-time<br />
fixed term<br />
4.8%<br />
Further <strong>Education</strong><br />
and Training<br />
812<br />
10%<br />
Early Years<br />
and Schools<br />
7,024<br />
85%<br />
Part-time<br />
fixed term<br />
6.9%<br />
Full-time<br />
permanent<br />
55.0%<br />
School employees – teaching and non-teaching<br />
full-time equivalent as at 30 June 2013<br />
Teachers employed<br />
full-time equivalent as at 30 June 2013<br />
Senior<br />
Secondary<br />
11%<br />
Polytechnic<br />
7%<br />
Primary<br />
schools<br />
45%<br />
Principals and<br />
assistant principals<br />
497<br />
10%<br />
Special<br />
schools<br />
3%<br />
Advanced<br />
skills teachers<br />
525<br />
11%<br />
Secondary<br />
schools<br />
23%<br />
Combined<br />
schools<br />
11%<br />
Teachers<br />
3,801<br />
79%<br />
20 Department at a Glance » Workforce
Average age of teachers (years)<br />
as at 30 June 2013<br />
51<br />
50<br />
49<br />
48<br />
Female<br />
50.0<br />
Male<br />
49.6<br />
Age (years)<br />
47<br />
46<br />
45<br />
44<br />
43<br />
Female<br />
44.6<br />
Male<br />
44.4<br />
Female<br />
46.9<br />
Male<br />
46.8<br />
42<br />
41<br />
Base grade teachers<br />
Advanced skills teachers<br />
Principals and assistant principals<br />
Age groups of principals and assistant principals<br />
as at 30 June 2013<br />
180<br />
160<br />
140<br />
120<br />
Count<br />
100<br />
80<br />
60<br />
40<br />
20<br />
0<br />
25-29<br />
30–34<br />
35–39<br />
40–44<br />
45–49<br />
50–54<br />
55–59<br />
60–64<br />
65+<br />
Age Group<br />
Gender distribution in promoted positions<br />
2012–13<br />
400<br />
350<br />
300<br />
250<br />
Female<br />
374<br />
Female<br />
306<br />
Count<br />
200<br />
150<br />
100<br />
Male<br />
183<br />
Male<br />
187<br />
50<br />
0<br />
Advanced skills teachers<br />
Principals and assistant principals<br />
Aboriginals and/or Torres Strait Islanders employed<br />
At 30 June 2013 there were 185 individuals identifying as Aboriginals and/or Torres Strait Islanders employed within the department,<br />
representing 1.7% of the total workforce.<br />
Department at a Glance » Workforce<br />
21
Expenditure Summary 2012–13 1<br />
Expenditure<br />
$’000<br />
• OUTPUT GROUP 1: Pre-Compulsory and Compulsory <strong>Education</strong> 786,818<br />
• OUTPUT GROUP 2: Post-Compulsory <strong>Education</strong> and Skills Development 219,798<br />
• OUTPUT GROUP 3: LINC Tasmania 35,413<br />
• Administered Payments 236,403<br />
• Capital Investment Program ** 3,375<br />
Total 1,281,807<br />
1. Expenditure figures are accrual based as reported in the department’s financial statements.<br />
** Actual expenditure $24,574m – adjustment made for capitalisation of building works to the Statement of Comprehensive Income.<br />
61+17+3+18+1+A<br />
22 Department at a Glance » Expenditure Summary
Pre-Compulsory<br />
and Compulsory<br />
<strong>Education</strong><br />
OUTPUT GROUP 1
Early Years<br />
Direction<br />
Reflecting the Bright Beginnings early years priorities in<br />
the department's Learners First Strategy, the department<br />
is committed to schools developing strong relationships<br />
with parents and community services, including strategies<br />
and programs that promote and support the importance<br />
of the early years for children’s successful learning and<br />
development. This commitment extends to supporting<br />
education and care services to implement appropriate<br />
strategies that reflect the same priorities. These priorities<br />
are strengthened with the ongoing implementation of<br />
the Council of Australian Governments’ (COAG) National Early<br />
Childhood Development Strategy and the National Partnership<br />
Agreements on Early Childhood <strong>Education</strong>.<br />
There are ten child and family centres (CFCs), which are<br />
funded and administered by the department, operating<br />
around the state. Construction of nine of the centres is now<br />
fully complete. In addition there are two Indigenous CFCs<br />
funded through the COAG National Partnership Agreement<br />
on Indigenous Early Childhood Development. Child and<br />
family centres provide a holistic and cohesive approach to<br />
supporting families and their young children.<br />
The state government’s Launching into Learning initiative<br />
began in 2006 as a four year, $12.6 million commitment to<br />
families and young children aged from birth to four years.<br />
In 2008, the government committed a further $4.25 million<br />
in annual funding until 2013, and in 2012 an additional<br />
$1.6 million was committed making this an annual<br />
commitment of $5.85 million.<br />
<strong>Education</strong> and care<br />
The <strong>Education</strong> and Care Unit (ECU) is integral to<br />
maintaining the provision of quality education and care in<br />
Tasmania by:<br />
• implementing nationally consistent regulation under<br />
the National Partnership Agreement on the National<br />
Quality Agenda for Early Childhood <strong>Education</strong> and Care,<br />
including the <strong>Education</strong> and Care Services National Law<br />
(Tasmania) 2011<br />
• providing related support and advice regarding<br />
the quality of early childhood education and care<br />
and outside school hours care services to parents,<br />
educators, carers and the general public<br />
• communicating the importance of implementing the<br />
approved learning frameworks, The Early Years Learning<br />
Framework and the Framework for School Aged Care to<br />
driving quality outcomes for children<br />
• funding eligible services through specific programs<br />
• participating, as applicable, in strategies to build a<br />
skilled workforce<br />
• providing a system of licensing under the<br />
Child Care Act 2001.<br />
The most significant issues continuing to affect the<br />
education and care sector are the challenges associated<br />
with the recruitment and retention of educators,<br />
particularly qualified staff. The ECU is working with the<br />
sector and the Minister’s <strong>Education</strong> and Care Advisory<br />
Council to address this issue and has developed and<br />
facilitated a number of strategies to increase the number<br />
of qualified staff.<br />
From 1 January 2012, the implementation of the COAG<br />
National Quality Agenda has required a significant change<br />
in roles and responsibilities for the ECU. The most<br />
significant of these relate to the commencement of quality<br />
assessment and rating of services from mid-2012 and the<br />
need to operate within a nationally consistent framework,<br />
which is overseen by the Australian Children’s <strong>Education</strong><br />
and Care Quality Authority (ACECQA).<br />
Major Initiatives<br />
Launching into<br />
Learning (LiL)<br />
The LiL initiative aims to:<br />
• give Tasmania’s youngest children the best possible<br />
start in life<br />
• support parents as their child’s first and most<br />
influential teacher<br />
• reach families that find it hardest to access services<br />
and those with the highest need.<br />
LiL provides resources to all primary and combined<br />
schools to develop and lead programs in their local<br />
community to support young children and their families.<br />
LiL aims to give Tasmania’s youngest children the best<br />
possible start in life through support and intervention in<br />
the years prior to Kindergarten, with a particular emphasis<br />
on improving educational outcomes for children from<br />
socially and economically disadvantaged backgrounds.<br />
There is a focus on young children’s learning across all<br />
aspects of their development including early literacy<br />
and numeracy, social and emotional development and<br />
creativity. All schools use Belonging, Being and Becoming<br />
– the Early Years Learning Framework for Australia (EYLF)<br />
to underpin planning. A statewide Early Years team<br />
supports the development of consistent approaches<br />
to implementing the EYLF and working in partnership<br />
with families. In 2012, based on the principle of ‘ongoing<br />
learning and reflective practice’ from the EYLF, the<br />
Early Years team ran a professional learning program<br />
that included support group programs and action<br />
research projects, together with support for individuals<br />
and schools. A total of 94% of schools engaged in two<br />
core professional learning days.<br />
24 Pre-Compulsory and Compulsory <strong>Education</strong> » Early Years
LiL acknowledges the important role of parents as their<br />
child’s first and often most influential teacher and seeks<br />
to work in partnership with them to ensure a positive<br />
transition for their child into Kindergarten.<br />
Children are born ready to learn and engage in the world<br />
around them and their early experiences are critical in<br />
their ongoing development. A child’s early experiences can<br />
either provide a solid or fragile foundation and influence<br />
the extent to which they can reach their full potential.<br />
Providing support and intervention for children prior to<br />
commencement of school is more likely to be effective<br />
than interventions later in life.<br />
LiL provides opportunities for teachers, parents and<br />
children to play and learn together in a variety of ways<br />
such as music sessions, water awareness programs,<br />
baby massage, out and about in their local community,<br />
Parents and Children Together playgroups and physical<br />
activities such as baby and toddler ‘gym’.<br />
LiL continues to strengthen partnerships with other<br />
agencies as schools seek to meet the needs of families in<br />
their local community. Partnerships continue to be built<br />
between schools, child and family centres, Child Health<br />
and Parenting Services, Housing Tasmania, Child and<br />
Adolescent Mental Health Services and Centrelink.<br />
Launching into Learning good practice example<br />
Partnerships at<br />
Ravenswood<br />
Heights<br />
Primary<br />
School and<br />
Ravenswood<br />
Child and<br />
Family Centre<br />
The Ravenswood Child and Family Centre and<br />
Ravenswood Heights Primary School have strengthened<br />
their ties through a new initiative in 2012 called<br />
Parents and Children Together (PACT).<br />
Early years staff from the school and the centre<br />
participated in the Parents as Active Companions in<br />
Children’s Learning (PaAC) training. The training course<br />
was developed by the state Early Years team following<br />
their involvement in professional learning supported by<br />
the Tasmanian Early Years Foundation (delivered by staff<br />
from The Pen Green Centre in the UK in 2012). PaAC<br />
provides a framework for working in partnership with<br />
parents to deepen understandings about young children’s<br />
learning and development. It is a way of working which<br />
involves respecting the knowledge of parents about their<br />
own children and working with parents in a ‘knowledge<br />
sharing approach’. It is designed to promote a culture of<br />
parents and staff working together as co-educators and<br />
strongly connects with Belonging, Being and Becoming:<br />
the Early Years Learning Framework for Australia.<br />
In particular, it connects with the principles of secure,<br />
respectful and reciprocal relationships; and partnerships.<br />
At the Ravenswood Child and Family Centre the<br />
Launching into Learning teacher, assistant principal,<br />
centre leader, teacher assistant, parents and children<br />
come together at a weekly playgroup called PACT.<br />
At PACT individual children are videoed by one of the<br />
staff while they are playing and interacting with others<br />
and the learning environment. The following week the<br />
footage is viewed with the parents. The staff member<br />
and parent/s talk together about what they notice in<br />
the video focusing on the child’s level of involvement<br />
or wellbeing; the relationship between the parent and<br />
child and/or learning resources. The parent/s then<br />
select some photos from the video and record their<br />
thoughts from the conversation. This is subsequently<br />
developed into a portfolio which the parents<br />
take home.<br />
Working this way has strengthened relationships<br />
between staff and parents. The PACT group is growing<br />
and seems particularly effective in engaging families<br />
who are not so involved in other groups in the centre.<br />
The conversations about children’s learning are deeper<br />
and more focused with a common language and<br />
understanding developing about children’s wellbeing,<br />
involvement and relationships. This two-way sharing<br />
allows for more individualised planning for children.<br />
This includes talking with parents about what the child<br />
is like at home and how they can be supported in<br />
providing other play experiences both at home and<br />
during playgroup.<br />
Whilst PACT is a new initiative, the enjoyment of<br />
talking about young children and their learning is<br />
spreading to other parts of the school and child and<br />
family centre communities in Ravenswood.<br />
Pre-Compulsory and Compulsory <strong>Education</strong> » Early Years<br />
25
Child and<br />
family centres<br />
In 2012–13, the state government allocated further capital<br />
funding to enable the construction and operations of<br />
additional child and family centres (CFCs) statewide.<br />
The purpose of CFCs is to improve the learning,<br />
health and wellbeing of Tasmania’s very young children by<br />
supporting parents and enhancing accessibility of services<br />
in the local community.<br />
The vision for CFCs is that all Tasmanian children will have<br />
the best possible start in life; are healthy, safe and curious<br />
learners; and nurtured by confident, capable families living<br />
in strong and supportive communities.<br />
The centres bring together and offer a range of services<br />
which are based on community need and make the most<br />
difference in the early years of a child’s life, providing access<br />
for children and their families within their local community.<br />
All CFCs strive to cultivate partnerships with a range<br />
of services, which commit to developing respectful<br />
relationships with families. The centres have a child-focused<br />
approach combined with support and opportunities.<br />
A further three state government funded CFCs have<br />
been opened in 2012–13 at Burnie, Chigwell and Derwent<br />
Valley. Six other centres at Beaconsfield, Clarence Plains,<br />
Ravenswood, East Devonport, Break O’Day (St Helens)<br />
and the West Coast (Queenstown) are all operating.<br />
Planning for construction of the centre at George Town is<br />
awaiting approval.<br />
Through the Council of Australian Governments (COAG)<br />
Partnership for Indigenous Early Childhood Development,<br />
the Australian Government has also provided the state<br />
government with $8.09 million to establish and operate two<br />
CFCs in Bridgewater and Geeveston. tagara lia (Bridgewater)<br />
opened in July 2012 and services continued to be provided<br />
by wayraparattee (Geeveston) as the second stage of the<br />
building was being constructed. This was planned to be<br />
completed in July 2013 with an official opening in August.<br />
Assessment<br />
and rating of<br />
education and<br />
care services<br />
From mid-2012, assessment and rating of long day care,<br />
family day care and outside school hours care services<br />
commenced under National Law in Tasmania.<br />
To determine a rating for a service the 58 elements<br />
that relate to the National Quality Standard are assessed<br />
as ‘met’ or ‘not met’; followed by assessment of the<br />
18 standards within seven Quality Areas.<br />
There are four possible rating levels applied through<br />
this process:<br />
• Significant Improvement Required<br />
• Working Towards National Quality Standard<br />
• Meeting National Quality Standard<br />
• Exceeding National Quality Standard.<br />
From 1 May 2013, the ratings of services have been<br />
published and are available nationally on both the<br />
ACECQA website and the Australian Government’s<br />
MyChild website.<br />
Authorised officers have been provided with nationally<br />
consistent training in assessment and rating under National<br />
Law. Tasmanian officers undertaking service assessments<br />
have been tested and confirmed to be reliable under a<br />
nationally administered process.<br />
Assessment visit under the National Quality Framework – a service snapshot<br />
Discovery<br />
Early Learning<br />
Centre,<br />
adjacent to<br />
Lauderdale<br />
Primary<br />
School,<br />
share their<br />
experience of<br />
assessment<br />
under the<br />
National<br />
Quality<br />
Framework<br />
The assessment went for three days, which included the<br />
76 place centre-based long day care centre, the 20 place<br />
after Kindergarten care and 60 place outside school hours<br />
care programs which are facilitated onsite at Lauderdale<br />
Primary School, which is next door to the centre.<br />
The service developed a Quality Improvement Plan (QIP)<br />
which is viewed and acted upon as a living document.<br />
It is freely available to all staff and is updated on a regular<br />
basis based on educator reflections. All stakeholders<br />
were involved in the development of the service’s selfassessment<br />
and its QIP including the children, families,<br />
community, school community and educators.<br />
The assessment day commenced with a tour of the<br />
service where the educators and children were<br />
introduced to the authorised officers undertaking the<br />
assessment. This provided the opportunity to talk about<br />
centre processes, people and curriculum. The educators<br />
relaxed into the process as they were encouraged to<br />
‘do what they normally do’ and to be confident in their<br />
practice. It was also important to understand that this<br />
is a continual improvement process with reflection<br />
on everyday practice central to the goal of improved<br />
practice.<br />
The officers visited each of the program areas,<br />
including before school care and two outside school<br />
hours care sessions. During the visit educators<br />
articulated the planning process and spoke about the<br />
context of the room’s curriculum and planning cycle<br />
with the assessors. This was a positive experience and<br />
enabled the educator to celebrate what was happening<br />
each and every day for children and families within the<br />
education and care environment.<br />
The centre supports and is committed to continuous<br />
improvement and ongoing learning. The assessment<br />
process has assisted in building on strengths and<br />
critically reflecting on areas for development. It was a<br />
great team building experience.<br />
26<br />
Pre-Compulsory and Compulsory <strong>Education</strong> » Early Years
Australian<br />
Early<br />
Development<br />
Index<br />
The Australian Early Development Index (AEDI) is a<br />
Commonwealth funded population measure of early<br />
years development. Research shows that investing<br />
resources and energy into children’s early years brings<br />
lifelong benefits to the whole community and the<br />
Department of <strong>Education</strong> is the host agency for this<br />
data set in Tasmania.<br />
The AEDI data are collected nationally through all<br />
education sectors on children in their first full-time year<br />
of formal schooling (Prep in Tasmania) through a teacher<br />
completed checklist. The index includes five domains<br />
of early childhood development – physical health and<br />
wellbeing; social competence; emotional maturity;<br />
language and cognitive skills (school-based domain);<br />
communication skills and general knowledge.<br />
The AEDI results help communities understand how their<br />
children are doing at a local level and in comparison with<br />
other children nationally, therefore assisting communities<br />
to understand where their strengths and vulnerabilities<br />
lie and encourage partnerships and initiatives that help to<br />
give their children the best start in life. The AEDI School<br />
Profiles provide confidential summary information for use<br />
by schools, while the publicly available AEDI Community<br />
Profiles offer an overview for child and family centres and<br />
those working in the early years to further understand the<br />
community in which they work.<br />
Performance<br />
Launching into<br />
Learning (LiL)<br />
data findings<br />
in 2012 from<br />
the 2010<br />
program<br />
Through interventions in children’s early development<br />
from birth to just before Kindergarten, the LiL program<br />
aims to improve the educational outcomes for all children<br />
and especially those from socioeconomically disadvantaged<br />
backgrounds.<br />
The department is conducting the Launching into Learning<br />
Longitudinal Study 2007–2014. The 2012 Progress Report<br />
collected information on 1,524 students who regularly<br />
attended 1 LiL in 2010 across 114 schools. The report<br />
examined the effect participation in LiL had on student<br />
performance as measured by the Kindergarten<br />
Development Check (KDC) and Performance Indicators<br />
in Primary Schools (PIPS) assessments. These students are<br />
referred to as the LiL students. (The longer term impact<br />
of LiL will be further evaluated in the future through<br />
NAPLAN results for these LiL cohorts).<br />
The 2010 LiL program significantly improved the<br />
educational outcomes for participants across all main<br />
performance measures (see Figure 1.1). The number<br />
of LiL students scoring below minimum standards on<br />
the Prep on-entry assessment (PIPS) has been reduced<br />
for both reading and maths. In addition, the number<br />
of LiL participants achieving all markers on the KDC<br />
has increased.<br />
Students from all socioeconomic backgrounds made<br />
significant gains in educational performance from regular<br />
participation in LiL. The program helped students to<br />
meet minimum standards and to achieve at the top of<br />
the PIPS performance scale.<br />
1. Defined as attendance of 75% or more LiL sessions for the year.<br />
Improvement<br />
due to LiL<br />
in all main<br />
performance<br />
measures<br />
The following results were derived for the 2010<br />
LiL cohort:<br />
• The percentage of LiL students below minimum<br />
standard in reading (10.0%) on PIPS first assessment<br />
was about half that of non-LiL students 1 (19.6%), an<br />
improvement of 9.6 percentage points.<br />
• The percentage of LiL students below minimum<br />
standard in maths (11.4%) on PIPS first assessment was<br />
about two thirds that of non-LiL students (17.8%), an<br />
improvement of 6.4 percentage points.<br />
• A greater proportion of LiL students performed at<br />
the highest level on PIPS first assessment (at well above<br />
minimum standard) than non-LiL students (10.7 and<br />
8.7 percentage points more in reading and maths<br />
respectively).<br />
• The proportion of children who achieved all KDC<br />
second assessment developmental markers was<br />
9.8 percentage points higher for LiL students when<br />
compared to non-LiL students (from 66.7% for<br />
non-LiL to 76.5% for LiL).<br />
• The biggest performance gains in meeting minimum<br />
standards on PIPS first assessment occurred for<br />
children from more disadvantaged socioeconomic<br />
backgrounds (the same occurred for the previous<br />
LiL cohort).<br />
• The observed improvements in performance for<br />
the LiL cohort are sustained when the results are<br />
disaggregated by gender and Aboriginality. This has<br />
occurred for all previous LiL cohorts.<br />
• Follow up analyses for previous LiL groups, 2007,<br />
2008 and 2009 LiL, show that the improvements in<br />
PIPS first assessment performance are consistently<br />
maintained into PIPS second assessment.<br />
• On average, LiL students attended two more school<br />
days in Prep in 2012 than the non-LiL group (five and<br />
three days for the previous two LiL cohorts).<br />
• On average, children from higher socioeconomic<br />
backgrounds had greater regular participation rates<br />
in 2010 LiL than those from lower socioeconomic<br />
backgrounds.<br />
1. Prep 2012 children who attended schools that offered LiL in 2010 but did<br />
not participate in LiL regularly.<br />
Pre-Compulsory and Compulsory <strong>Education</strong> » Early Years<br />
27
Figure 1.1: Prep 2012 reading performance for the 2010 LiL cohort<br />
100%<br />
Students at or above expected standard<br />
90%<br />
80%<br />
70%<br />
60%<br />
Students who participated in LiL<br />
Students who did NOT participate in LiL<br />
Students who participated in<br />
LiL continue to outperform<br />
non-participants across all<br />
socioeconomic backgrounds<br />
50%<br />
Socioeconomic status<br />
The graph shows the percentage of students who achieved 2012 PIPS first assessment scores at or above the expected<br />
standard. The results for children who participated in the 2010 LiL program are compared to those at the same schools<br />
who did not participate in LiL. Improvements in performance occur for children from all socioeconomic backgrounds.<br />
Figure 1.2: The correlation of improving performance and introduction of LiL programs<br />
Students achieving expected PIPS reading standards in Tasmanian Government schools<br />
90%<br />
89%<br />
2007 LiL cohort enters Prep<br />
88%<br />
87%<br />
86%<br />
85%<br />
84%<br />
83%<br />
Improving Performance<br />
82%<br />
81%<br />
80%<br />
2005 2006 2007 2008 2009 2010 2011 2012<br />
Prep Year<br />
The graph shows the percentage of students who achieved PIPS first assessment reading scores at or above the<br />
expected standard at government schools. The historical pattern of results is represented by a moving average line.<br />
Tasmania’s performance started improving around the time when the LiL programs were introduced. The results of<br />
PIPS maths assessment show a similar pattern.<br />
28<br />
Pre-Compulsory and Compulsory <strong>Education</strong> » Early Years
Early years<br />
school<br />
improvement<br />
measures<br />
Performance<br />
measure<br />
Measurement 2010 2011 2012<br />
Readiness for school Percentage of Kindergarten students achieving expected outcomes 1 76.0% 75.5% 75.9%<br />
Early literacy Percentage of Prep students achieving expected literacy outcomes 2, 3 84.3% 85.3% 85.3%<br />
Early numeracy Percentage of Prep students achieving expected numeracy outcomes 2, 3 84.8% 86.3% 86.4%<br />
1. This measure is the percentage of Kindergarten students achieving all 21 markers of the Kindergarten Development Check (KDC) by the end of the year.<br />
The KDC is an assessment administered by Kindergarten teachers during first and fourth term for the early identification of Kindergarten students at risk<br />
of not achieving expected developmental outcomes.<br />
2. This measure is the percentage of Prep students achieving a set score by the end of the year. The score is determined using the Performance Indicators in<br />
Primary Schools (PIPS) test. PIPS is an assessment of early literacy and numeracy for Prep students and is administered in two assessments for each Prep<br />
student at the beginning and end of the year. This data is from the second assessment.<br />
3. Launching into Learning (LiL) program cohorts enter Prep two years after their involvement in LiL. Therefore the influences of the 2012 LiL cohort will not<br />
be reflected in the PIPS results (as above) until 2014.<br />
Approved<br />
education and<br />
care services<br />
in Tasmania<br />
as at 30 June 2013<br />
Centre-based services 213<br />
Family day care services 13<br />
Total 226<br />
Assessment<br />
and rating of<br />
education and<br />
care services<br />
as at 30 June 2013<br />
Number of services<br />
with a final rating<br />
Percentage of services<br />
at rating level<br />
Significant<br />
Improvement<br />
Required<br />
Working Towards<br />
National Quality<br />
Standard<br />
Rating levels<br />
Meeting National<br />
Quality Standard<br />
Exceeding<br />
National Quality<br />
Standard<br />
Total<br />
0 28 4 8 40<br />
0% 70% 10% 20% 100%<br />
Commentary<br />
18% of Tasmanian services had a quality rating by 30 June 2013. Across Australia the average percentage of services with<br />
a quality rating at this time was 19%.<br />
The National Quality Standard sets a higher benchmark than the previous system for all children’s education and care<br />
services. At this early stage in the assessment and rating process a rating of ‘Working Towards National Quality<br />
Standard’ is expected for many, as services continue to implement quality improvement strategies to achieve even<br />
better outcomes for children.<br />
Of the 30% of Tasmanian services that have been assessed as meeting the standard, it is encouraging to note that 20%<br />
are rated as ‘Exceeding the Standard’. Ratings for all services can be viewed in the <strong>Education</strong> and Care section of the<br />
Department of <strong>Education</strong> website.<br />
Australian<br />
Early<br />
Development<br />
Index<br />
Tasmania achieved an AEDI checklist completion rate<br />
of 98.4% of schools during the data collection period<br />
(1 May – 31 July 2012).<br />
The results of the 2012 AEDI data capture were released<br />
in April 2013. The results showed that in Tasmania in 2012,<br />
the proportion of children developmentally vulnerable on<br />
one or more of the AEDI domain/s was 21.5%, compared<br />
to 21.8% in 2009. These Tasmanian AEDI results indicate<br />
that the department’s early years programs, including<br />
Launching into Learning offered in all government schools,<br />
are helping to reduce the level of vulnerability.<br />
Pre-Compulsory and Compulsory <strong>Education</strong> » Early Years<br />
29
Literacy and Numeracy<br />
Direction<br />
Our Learners First Strategy is the foundational source<br />
of direction for improvement in literacy and numeracy<br />
performance, which continues to be one of the<br />
department’s highest priorities.<br />
In particular, the ‘School <strong>Education</strong>: Great Schools… Great<br />
Communities’ section of the plan details the priorities for<br />
improving the literacy and numeracy performance of<br />
all Tasmanians. In 2012–13, the department has further<br />
implemented comprehensive reforms to address<br />
these priorities, with a strong emphasis on literacy and<br />
numeracy achievement in the early years, schools, further<br />
education and training, and in adult learning.<br />
Tasmanian Government schools are currently<br />
implementing the Australian Curriculum from Prep to<br />
Year 10. In 2013, all students in these year levels are<br />
being assessed against the Australian Curriculum in English,<br />
Mathematics, Science and History. Assessment in all other<br />
learning areas remains under the Tasmanian Curriculum<br />
Framework. Australian Curriculum: Geography is planned<br />
for implementation in 2014. All other areas will be<br />
progressively implemented from 2015 onwards.<br />
Literacy and Numeracy are General Capabilities under<br />
the Australian Curriculum and are expected to be taught<br />
across all curriculum areas. However, English and<br />
Mathematics remain key areas of study for teaching and<br />
learning in literacy and numeracy. The knowledge, skills,<br />
understandings and capacities that children develop are<br />
central to learning and necessary for success in all areas of<br />
the curriculum.<br />
The early years are a critical time for all learning and<br />
laying down the foundations for success in literacy and<br />
numeracy. Belonging, Being and Becoming: The Early Years<br />
Learning Framework for Australia guides teachers working<br />
with children from birth to five years and is used in<br />
Tasmania to support all early years programs including<br />
Launching into Learning programs, child and family centres<br />
and Kindergartens. The framework and supporting<br />
resources highlight many important practices to support<br />
children in becoming effective and confident learners,<br />
communicators and thinkers: noting the importance<br />
of adult interaction and conversation with children.<br />
A play-based approach to learning is advocated as best<br />
practice for young children to build literacy and numeracy<br />
capability and make sense of their world through<br />
interactions with people, objects and representations.<br />
The Raising the Bar (RTB) initiative supports Tasmania’s<br />
literacy and numeracy improvement strategy and aims<br />
to increase the number of children finishing primary<br />
school with functional literacy and numeracy skills.<br />
Full implementation of RTB was achieved with the<br />
extension of the program into selected secondary<br />
schools from 2011–12.<br />
The implementation of the Tasmanian Literacy and<br />
Numeracy Framework 2012–2015 explicitly sets out the<br />
priorities, intentions, and approaches to teaching and<br />
learning as well as progress measures, reflecting a statewide<br />
approach to improving learning outcomes for all students.<br />
Schools have an explicit literacy and numeracy strategy as<br />
part of their school improvement plan so that every child’s<br />
literacy and numeracy learning needs can be supported.<br />
Major Initiatives<br />
The department’s direction and literacy and numeracy goals are supported by a range of targeted initiatives.<br />
The progress and influence of these initiatives are generally reflected in literacy and numeracy performance over time –<br />
see ‘Performance’ (next section).<br />
Early Years<br />
In the early years, literacy and numeracy experiences in<br />
the Launching into Learning (LiL) initiative are guided by<br />
Belonging, Being and Becoming – The Early Years Learning<br />
Framework for Australia (EYLF). Literacy and numeracy<br />
capabilities are important aspects of EYLF outcome<br />
number five: ‘Children are effective Communicators’.<br />
The importance of early literacy and numeracy<br />
experiences were highlighted by the inclusion of the early<br />
years in ‘Snapshots of the Practices and Strategies in<br />
Action’ section in the department’s publication Supporting<br />
Literacy and Numeracy Success – A teacher’s resource for<br />
Early Years to Year 12.<br />
The involvement of parents in the early years is critical<br />
for children to be effective communicators and positive<br />
partnerships between schools and parents help to build a<br />
strong foundation for future learning.<br />
The latest results from the longitudinal analysis of LiL<br />
demonstrate the continued effectiveness in boosting<br />
educational outcomes for participating students, and<br />
particularly those from lower socioeconomic backgrounds.<br />
30 Pre-Compulsory and Compulsory <strong>Education</strong> » Literacy and Numeracy
Lead School/<br />
Lead Teacher<br />
strategy<br />
The Tasmanian Literacy and Numeracy Framework 2012–<br />
2015 was introduced to support schools within a broad<br />
framework to enable the development of their whole<br />
school approach, and, to provide systemic direction for<br />
the future.<br />
• The Literacy and Numeracy Framework outlines the<br />
priorities and approaches for government schools to<br />
ensure that students develop the skills required for<br />
participation and growth throughout their education.<br />
The emphasis on effective leadership and teaching is<br />
underpinned by the importance of utilising evidence<br />
based approaches. The Lead School/Lead Teacher<br />
strategy also supports reflective practice and sharing<br />
of best practice.<br />
• Network lead schools (one per network) provide<br />
leadership in learning and share good practice across<br />
all schools in their networks. Network lead teachers<br />
based in each lead school provide leadership, direction<br />
and high level support to all principals and schools<br />
across the network in the implementation of the<br />
Literacy and Numeracy Framework.<br />
• A Principal <strong>Education</strong>al Officer – Literacy and<br />
Numeracy has been funded to coordinate the<br />
implementation of the Literacy and Numeracy<br />
Framework with support from <strong>Education</strong>al<br />
Performance Services. Officers work in close<br />
cooperation to provide a coordinated approach to<br />
literacy and numeracy data collection and analysis at<br />
school and state levels.<br />
• Principal network leaders work with network lead<br />
teachers and network lead school principals to provide<br />
support in:<br />
º º prioritising areas of need and recipients of support<br />
º º following-up on desired outcomes from<br />
professional learning delivery<br />
º º developing the culture of shared responsibility<br />
between schools<br />
º º making recommendations regarding professional<br />
learning needs at local and state level.<br />
Supporting<br />
Literacy and<br />
Numeracy<br />
Success: A<br />
teacher’s<br />
resource for<br />
Early Years to<br />
Year 12<br />
The Supporting Literacy and Numeracy Success booklet was<br />
produced to support the significant work of all teachers,<br />
leaders and principals from Early Years to Year 12 in<br />
improving literacy and numeracy outcomes for students.<br />
It is designed to be a practical resource to support the<br />
implementation of the Tasmanian Literacy and Numeracy<br />
Framework 2012–2015 and the Australian Curriculum.<br />
This document was developed in consultation, and with<br />
contributions from, teachers, principals and leaders.<br />
It was distributed to teachers and early years educators<br />
at the start of the 2013 school year. Further support for<br />
implementing the key actions outlined in the resource<br />
has been provided through the work of network<br />
lead teachers.<br />
Raising the<br />
Bar (RTB)<br />
The goal of the Raising the Bar (RTB) initiative is to<br />
have more children finish primary school and start<br />
their secondary education with functional literacy and<br />
numeracy skills.<br />
The department committed $8 million to this initiative in<br />
2012–13 and a further $8 million in 2013–14 to continue<br />
the program. An additional $3 million was committed<br />
in 2013–14 to provide support to a wider group of<br />
secondary schools.<br />
Additional RTB funding of $3 million in 2011–12 was<br />
provided to extend the RTB initiative into government<br />
secondary schools (RTB 7+). This funding initially targeted<br />
students in Years 7 and 8, but has since broadened to<br />
encompass students from Years 7–10. This strategy will<br />
result in an increased number of students finishing secondary<br />
school with functional literacy and numeracy skills. The<br />
implementation of this initiative has provided additional<br />
staffing to selected secondary schools whilst building teacher<br />
capability and a whole-of-school improvement approach.<br />
The 5–8<br />
Project:<br />
Supporting<br />
Literacy and<br />
Numeracy<br />
across Years<br />
5 to 8<br />
The department is working with the UTAS Faculty of<br />
<strong>Education</strong> on a project to improve literacy and numeracy<br />
across Years 5 to 8. The project targets the transition<br />
from primary to secondary school – in response to the<br />
outcomes of NAPLAN results in Years 7 and 8.<br />
The purpose of the action research is to explore issues,<br />
share best pedagogy, beliefs and practices to investigate<br />
how the performance of students in Year 7 and 9 can<br />
be improved. The focus of the research will be on<br />
engagement, transition and retention through common<br />
approaches to literacy, numeracy and attendance. The aim<br />
is to develop and trial a number of ideas and initiatives that<br />
may be transferable to all Tasmanian Government schools.<br />
Five secondary schools and one combined school are<br />
working with their associated primary schools as clusters<br />
in action-based research – with a strong focus on teacher<br />
professional learning. The schools and their clusters are<br />
located in various regions with each location representing an<br />
opportunity to explore a related but varied challenge.<br />
Participating schools are:<br />
• Scottsdale Cluster – Scottsdale High School,<br />
Scottsdale Primary School, Ringarooma Primary School,<br />
Bridport Primary School<br />
• Penguin Cluster – Penguin High School,<br />
Penguin Primary School, Riana Primary School<br />
• Ogilvie/New Town Cluster – Ogilvie High School,<br />
New Town High School, New Town Primary School,<br />
Lenah Valley Primary School, Bowen Road Primary School<br />
• Tasman Cluster – Tasman District School.<br />
The project commenced in January 2013 and will operate for<br />
12 months initially, with the view to extend beyond this time.<br />
Pre-Compulsory and Compulsory <strong>Education</strong> » Literacy and Numeracy<br />
31
Closing the<br />
Gap on<br />
Aboriginal<br />
<strong>Education</strong><br />
Outcomes<br />
The Tasmanian Closing the Gap in Aboriginal <strong>Education</strong>al<br />
Outcomes (2010-2014) Strategy complements work through<br />
the Smarter Schools National Partnership for Literacy and<br />
Numeracy to lift the performance of Aboriginal students.<br />
The Tasmanian Closing the Gap Strategy reflects the priority<br />
actions of the National Aboriginal and Torres Strait Islander<br />
<strong>Education</strong> Action Plan (NATSIEAP) which aims to build<br />
the capacity of schools to meet the educational needs of<br />
Aboriginal students and accelerate performance through<br />
whole of school approaches to personalised learning,<br />
literacy and numeracy improvement and community<br />
engagement.<br />
A feature of the strategy is the identification of 61 focus<br />
schools, based on high Aboriginal student enrolment and<br />
high educational need, which receive additional support<br />
from the department through Aboriginal <strong>Education</strong><br />
Services (AES). Focus schools are receiving specialised<br />
support from AES to support inclusive teaching and<br />
improve community engagement. In 2012, all focus schools<br />
were recipients of additional funding to provide targeted<br />
programs and support for Aboriginal students.<br />
While Tasmanian schools compare well, Aboriginal<br />
students achieve lower learning outcomes than their<br />
non-Aboriginal peers. Strategies designed to close this<br />
gap include: in-class tuition, personalised mentoring and<br />
tutoring, and support for speech and hearing. Professional<br />
learning for tutors and cultural awareness is also provided.<br />
The NATSIEAP enabled extension funding of $1.9 million<br />
to support five NATSIEAP focus schools to incorporate<br />
the Raising the Bar Closing the Gap strategy into their<br />
schools—Raising the Bar Closing the Gap Indigenous<br />
extension. This program concluded at the end of 2012.<br />
Further funding in late 2011 of $1 million over two years<br />
through the Next Steps program has enabled another<br />
five focus schools to support their Aboriginal students.<br />
In June 2012, a new partnership agreement titled<br />
Investing in Focus Schools was signed. A further eight focus<br />
schools receive funds totalling $1.2 million to support the<br />
improvement of Aboriginal student outcomes through<br />
this program.<br />
Literacy and<br />
Numeracy<br />
National<br />
Partnership<br />
schools<br />
Whilst funding for the Smarter Schools National Partnership<br />
for Literacy and Numeracy finished at the end of 2011,<br />
literacy and numeracy remain departmental priorities<br />
and both National Partnership (NP) and non-NP schools<br />
continue to implement strategies to improve the literacy<br />
and numeracy outcomes of all students. The department’s<br />
Literacy and Numeracy Framework introduced in 2012<br />
supports improved student outcomes in literacy and<br />
numeracy. Based on the framework, every school has an<br />
explicit literacy and numeracy strategy as part of their<br />
school improvement plan so that every child’s literacy and<br />
numeracy learning needs can be supported.<br />
To empower inspiring leaders within networks to enhance<br />
literacy and numeracy teaching, the department initiated<br />
a Lead School/Lead Teacher strategy in 2012. Network lead<br />
teachers, based in each lead school, provide leadership,<br />
direction and high level support to all principals and<br />
schools across the network in the implementation of<br />
the Literacy and Numeracy Framework. Lead schools and<br />
lead teachers of literacy and numeracy work across the<br />
networks of schools to mentor and coach and to build the<br />
capacity of teachers to teach literacy and numeracy.<br />
Building the capacity of teachers to effectively use data<br />
to inform their planning and deliver quality literacy and<br />
numeracy opportunities for students has continued<br />
to increase. In 2013, ‘Working with Data’ professional<br />
learning opportunities are provided to principals and<br />
teachers through the Professional Learning Institute<br />
(PLI). The NAPLAN Toolkit, a resource for classroom<br />
teachers, developed by the department, allows classroom<br />
teachers to view, sort and analyse students’ NAPLAN<br />
data and to access links to relevant teaching strategies<br />
to support improved student performance. Relevant<br />
reports and data provided to schools through <strong>Education</strong>al<br />
Performance Services (EPS) assist schools to better<br />
determine targets for whole school improvement and<br />
student performance.<br />
In 2013, 51 government schools are participating in the<br />
Improving Literacy and Numeracy National Partnership.<br />
Participating schools are implementing the Raising the Bar<br />
strategy. Teachers are focusing on collaborative planning<br />
and effective evidence-based practice to inform their<br />
planning and delivery of quality literacy and numeracy<br />
opportunities to improve student outcomes.<br />
32 Pre-Compulsory and Compulsory <strong>Education</strong> » Literacy and Numeracy
School<br />
improvement<br />
planning –<br />
incorporating<br />
literacy and<br />
numeracy<br />
plans<br />
The department is supporting improvement in schools<br />
through the closer alignment of assessment data with<br />
targeted curriculum planning. Schools have been provided<br />
with comprehensive data on the performance of their<br />
students in the 2012 NAPLAN. During 2013, teachers<br />
were further supported in this with access to an improved<br />
online resource—the NAPLAN Toolkit.<br />
In addition, Curriculum Services and <strong>Education</strong>al<br />
Performance Services are providing further school-level<br />
support, including help desk assistance to aid their data<br />
analysis and planning.<br />
Principals and teachers are translating their findings into<br />
revised literacy and numeracy plans (as part of school<br />
improvement plans) at the school level, and implementing<br />
teaching and learning strategies to address the identified<br />
areas of future action. The plans are consistent with the<br />
expectations set in the department’s School Support and<br />
Expectations document. Under the literacy and numeracy<br />
section, areas for schools to focus on are:<br />
• development of whole-school approaches to literacy<br />
and numeracy<br />
• actively engaging with departmental support<br />
• use of data to support good teaching practice.<br />
Lead teachers and lead schools, in partnership with<br />
principal network leaders support schools in aligning<br />
their identified areas of future action with professional<br />
learning support. The Professional Learning Institute<br />
has been funded to support professional learning as a<br />
response to identified statewide needs, utilising data at<br />
the statewide level.<br />
Professional<br />
learning to<br />
support<br />
literacy and<br />
numeracy<br />
The Professional Learning Institute and Curriculum<br />
Services have identified, developed and delivered a range<br />
of professional learning opportunities over the course of<br />
2012–13 to ensure that school leaders have the requisite<br />
knowledge and skills as instructional leaders. Professional<br />
learning programs, with a focus on literacy and numeracy<br />
achievement, are:<br />
• Principals as Literacy Leaders<br />
• Secondary Principals as Literacy Leaders<br />
• Literacy for Learning<br />
• Numeracy Initiative Inquiry.<br />
These key professional learning opportunities for school<br />
leaders are further supported by network based literacy<br />
and numeracy inquiries that are coordinated by network<br />
lead teachers.<br />
Data informed teaching practice and school leadership<br />
have been further supported though the ‘Working with<br />
Data’ professional learning program. Using data to inform<br />
strategic school improvement planning and understanding<br />
how data translates into effective pedagogy were two of<br />
the key objectives for participants.<br />
Transition to<br />
the Australian<br />
Curriculum<br />
During 2013, Australian Curriculum English, Mathematics,<br />
Science and History are being taught, assessed and<br />
reported against in all schools from Prep to Year 10.<br />
Geography will be implemented from Prep to Year 8<br />
in 2014 and other subjects progressively from 2015.<br />
Literacy and numeracy are General Capabilities under the<br />
Australian Curriculum and are expected to be taught across<br />
all subjects and learning areas.<br />
<strong>Education</strong> Ministers agreed to use Australian Curriculum,<br />
Assessment and Reporting Authority (ACARA) content<br />
statements for senior secondary English, Mathematics,<br />
Science and History (14 subjects in total) ‘as the common<br />
base for developing local courses’ in December 2012.<br />
Eight curriculum teacher leaders with specific learning<br />
area responsibility across Years 9–12 have been<br />
appointed to provide direct school-based support for<br />
the Australian Curriculum.<br />
Other<br />
literacy and<br />
numeracy<br />
initiatives<br />
The following funded literacy and numeracy initiatives<br />
occurred in 2012–13:<br />
• Literacy Grants ($2.39 million) – literacy intervention<br />
support was provided to schools with the highest<br />
<strong>Education</strong>al Needs Index (ENI). General Literacy<br />
Grants ($4 million total) were allocated across<br />
all schools.<br />
• Reading Recovery ($340,550) – a school-based literacy<br />
intervention for Year 1 was a funded improvement<br />
strategy with 30 schools participating in 2012.<br />
• Flying Start ($10.99 million) – a staffing allocation made<br />
to primary and combined schools to support literacy<br />
teaching and learning from Kindergarten to Year 2.<br />
All primary and combined schools provided this early<br />
intervention in literacy.<br />
• Premier’s Reading Challenge – is a 10 week program<br />
offering all Tasmanian students and schools a range<br />
of incentives to read more often and more widely.<br />
Students from Prep to Year 6 are challenged to read<br />
at least one book in each week of the program.<br />
The Challenge aims to improve the reading and<br />
literacy skills of students, raise parent and community<br />
awareness about the importance of reading with<br />
children and give young students a pathway to a<br />
lifelong love of books and reading. In 2012, 11,623<br />
primary school students and 156 schools completed<br />
the Premier’s Reading Challenge, with more than<br />
116,000 books read and over 1,800 book reviews<br />
submitted.<br />
• Partnerships in Teaching Excellence (PiTE) – this<br />
pre-service training program is in part used to better<br />
prepare beginning teachers as literacy and numeracy<br />
teachers. Twenty-two university students were part<br />
of this initiative in 2012 and 20 of those students are<br />
now employed in government schools. There are<br />
16 students in the program in 2013.<br />
Pre-Compulsory and Compulsory <strong>Education</strong> » Literacy and Numeracy<br />
33
Performance<br />
The department is responsible for monitoring and<br />
accountability. <strong>Education</strong>al Performance Services (EPS)<br />
provides schools with data from international, national<br />
and statewide assessments to assist schools to tailor<br />
programs to help each student to improve his/her<br />
performance. These literacy and numeracy assessments<br />
include Performance Indicators in Primary Schools (PIPS),<br />
The National Assessment Program – Literacy and Numeracy<br />
(NAPLAN), Trends in International Mathematics and<br />
Science Study (TIMSS), Progress in International Reading<br />
Literacy Study (PIRLS) and Programme for International<br />
Student Assessment (PISA).<br />
The state government remains firmly committed to<br />
transparency and accountability for ongoing school<br />
improvement. The government strongly supports<br />
the effective assessment and reporting of student<br />
achievement, including the diagnostic value of NAPLAN.<br />
National<br />
Assessment<br />
Program –<br />
Literacy and<br />
Numeracy<br />
(NAPLAN)<br />
In May each year, Years 3, 5, 7 and 9 students across<br />
Australia are tested on aspects of literacy and numeracy<br />
using a common test in Reading, Writing, Language<br />
Conventions (spelling, grammar and punctuation)<br />
and Numeracy.<br />
Results from these tests are used at school and state<br />
level to evaluate the effectiveness of teaching and learning<br />
initiatives and programs in place, and to confirm current<br />
and future directions for continued improvement in<br />
literacy and numeracy performance. The NAPLAN<br />
testing and reporting assists the department to address<br />
educational disadvantage and to direct resources to where<br />
they are most needed.<br />
Student results in NAPLAN tests are reported against a<br />
continuous reporting scale for each test type, described by<br />
ten achievement bands that enable individual achievement<br />
to be compared to the national average. The achievement<br />
scale for each year level is described using six of the ten<br />
achievement bands; the first band being the lower level of<br />
knowledge and skills attained; and the top band describing<br />
higher level knowledge and skills. One band is designated<br />
as the national minimum standard (NMS) for each test<br />
and year level.<br />
Source: ACARA – http://www.nap.edu.au<br />
34 Pre-Compulsory and Compulsory <strong>Education</strong> » Literacy and Numeracy
NAPLAN 2013 performance – general commentary<br />
Overall, Tasmania’s 2013 results represent a consolidation<br />
of the good progress made since 2011 and highlight that<br />
Tasmanian students are increasingly demonstrating the<br />
literacy and numeracy skills necessary to participate<br />
successfully throughout their school years and beyond.<br />
Percentage At or Above National Minimum Standard<br />
(AANMS) results<br />
• Tasmania improved its percentages of students<br />
AANMS on 14 out of the 20 tests between 2011<br />
and 2013. These included improvements across all<br />
year levels in Reading and Spelling.<br />
• On average across all domains Tasmania improved<br />
by a 0.4% greater margin than Australia between<br />
2011 and 2013 1 .<br />
• Tasmania improved on the percentages of students<br />
AANMS between 2011 and 2013 by a greater margin<br />
than Australia on 10 out of the 20 tests.<br />
• Tasmania improved its percentages of students<br />
AANMS by a greater margin than Australia across<br />
all year levels in Reading between 2011 and 2013<br />
(from 0.4% in Year 9 though to 1.3% in Year 7).<br />
• In total, Tasmania improved its percentages of<br />
students AANMS from 2012 in 10 of the 20<br />
assessments. The improvements ranged from 0.1%<br />
(Year 7 Reading) to 4.7% (Year 5 Reading).<br />
Participation in testing<br />
• Overall, Tasmania’s participation data confirms<br />
inclusive and supportive practice is occurring in our<br />
schools in relation to the NAPLAN assessments.<br />
• For Years 3 and 5, Tasmania’s participation rates<br />
marginally exceed the Australian figures for every<br />
domain, by figures ranging from 0.3% to 1.0%.<br />
• Our participation rates fall behind the Australian<br />
figures in Years 7 and 9 for every domain by figures<br />
ranging from 0.3% to 0.9%.<br />
• Tasmania’s exemption rates are lower than Australian<br />
figures for every year level and domain by an average<br />
of approximately 0.3%.<br />
• Tasmania’s withdrawal rates are lower than the<br />
Australian figures for all domains in Years 3, 5, 7 and 9<br />
by an average of approximately 0.4%.<br />
1. This figure is the difference between the Australian average change from<br />
all assessments and the Tasmanian average change from all assessments.<br />
Mean score results<br />
• Tasmania’s best results for mean scores in 2013 were<br />
in Years 3, 5, 7 and 9 Reading where mean scores<br />
were within 6 points (or less than one question on the<br />
test) of the Australian figures.<br />
• For Spelling, Grammar and Punctuation and Years 5,<br />
7 and 9 Numeracy, the extent of the gaps to<br />
Australia in 2013 is equivalent to between one and<br />
two questions on the test. The largest gaps were in<br />
Year 9 Numeracy (-18.7 points) and Years 3 and 9<br />
Spelling (-17.6 and -17.9 points respectively).<br />
• The strongest domain for improvement from 2011 to<br />
2013 is Reading with mean score improvements across<br />
all year levels (from 1.8 points in Year 9 through to<br />
10.4 points in Year 5).<br />
• The largest improvement from 2011 to 2013 was in<br />
Year 5 Reading (10.4 score points).<br />
• Tasmania improved its mean score results from<br />
2012 to 2013 in 7 of the 20 assessments.<br />
• A statistically significant decline since 2012 was<br />
observed in Year 7 Grammar and Punctuation<br />
(16.4 points). However, this decline was mirrored<br />
nationally with the Australian figure dropping by<br />
10.8 points from 2012.<br />
• Tasmania’s results for the 12 remaining assessments<br />
were not statistically significantly different from its<br />
2012 results.<br />
• During the period 2008 to 2013, Tasmania’s results<br />
for Year 5 Reading have improved significantly and for<br />
all other year levels and assessments, our results have<br />
remained comparable.<br />
Pre-Compulsory and Compulsory <strong>Education</strong> » Literacy and Numeracy<br />
35
Performance in NAPLAN – Reading<br />
Legend<br />
Exempt<br />
1 band<br />
below NMS<br />
AT NMS<br />
1 band<br />
above NMS<br />
2 bands<br />
above NMS<br />
3 bands<br />
above NMS<br />
4 bands<br />
above NMS<br />
NMS = National<br />
Minimum Standard<br />
Achievement of Year 3 Students<br />
Percentage of Students<br />
0% 10% 20% 30% 40% 50% 60% 70% 80% 90% 100%<br />
TAS 2011<br />
2<br />
6<br />
12<br />
18<br />
20<br />
18<br />
24<br />
TAS 2012<br />
1<br />
6<br />
10<br />
16<br />
20<br />
20<br />
27<br />
TAS 2013<br />
2<br />
4<br />
11<br />
18<br />
21<br />
21<br />
24<br />
AUS 2013<br />
2<br />
3<br />
9<br />
17<br />
24<br />
23<br />
23<br />
Achievement of Year 5 Students<br />
Percentage of Students<br />
0% 10% 20% 30% 40% 50% 60% 70% 80% 90% 100%<br />
TAS 2011<br />
1<br />
9<br />
15<br />
22<br />
23<br />
17<br />
12<br />
TAS 2012<br />
1<br />
8<br />
12<br />
21<br />
25<br />
19<br />
13<br />
TAS 2013<br />
2<br />
3<br />
13<br />
24<br />
28<br />
20<br />
11<br />
AUS 2013<br />
2 2<br />
10<br />
23<br />
30<br />
22<br />
11<br />
Achievement of Year 7 Students<br />
Percentage of Students<br />
0% 10% 20% 30% 40% 50% 60% 70% 80% 90% 100%<br />
TAS 2011<br />
2<br />
5<br />
16<br />
26<br />
26<br />
17<br />
8<br />
TAS 2012<br />
1<br />
5<br />
15<br />
24<br />
27<br />
19<br />
9<br />
TAS 2013<br />
1<br />
5<br />
15<br />
26<br />
27<br />
18<br />
8<br />
AUS 2013<br />
2<br />
4<br />
13<br />
26<br />
30<br />
18<br />
8<br />
Achievement of Year 9 Students<br />
Percentage of Students<br />
0% 10% 20% 30% 40% 50% 60% 70% 80% 90% 100%<br />
TAS 2011<br />
1<br />
8<br />
19<br />
27<br />
26<br />
14<br />
5<br />
TAS 2012<br />
1<br />
9<br />
19<br />
28<br />
25<br />
13<br />
5<br />
TAS 2013<br />
1<br />
7<br />
18<br />
28<br />
27<br />
14<br />
5<br />
AUS 2013<br />
2<br />
5<br />
17<br />
29<br />
28<br />
15<br />
5<br />
36 Pre-Compulsory and Compulsory <strong>Education</strong> » Literacy and Numeracy
Commentary<br />
• Tasmania improved on its 2012 mean score results<br />
for Reading in both Year 5 and Year 9 (4.6 and<br />
5.3 points respectively).<br />
• Tasmania’s best results for 2013 were in Years 3, 5,<br />
7 and 9 Reading where mean scores were within<br />
6 points (or less than one question on the test)<br />
of the Australian figures.<br />
• For the percentage of students at or above national<br />
minimum standard, Tasmania also improved on its<br />
2012 results in every year level. The improvements<br />
ranged from 0.1% (Year 7) to 4.7% (Year 5).<br />
• Together, these achievements indicate that Reading<br />
continues to be an area of strength for Tasmania.<br />
Explanatory<br />
notes to the<br />
charts<br />
• Literacy performance is represented by<br />
achievement on the Reading tests, because<br />
Reading is generally considered the most reliable<br />
measure of overall literacy achievement.<br />
• All figures are inclusive of government and<br />
non-government schools.<br />
• The percentages of students represented have<br />
been rounded and may not sum to 100.<br />
• Exempt students were counted as assessed,<br />
are deemed not to have met the national minimum<br />
standard and are included in the result for each<br />
test at jurisdictional and national levels. They are<br />
not included in school level calculations for mean<br />
scores and the percentages of students below<br />
national minimum standard, but are reported.<br />
• These measures have been sourced from the<br />
national website for NAPLAN –<br />
http://www.nap.edu.au/naplan/naplan.html<br />
• The 2011 and 2012 measures are taken from the<br />
Stage 2 release of those results.<br />
• The 2013 measures are taken from the Stage 1<br />
(preliminary) release of the 2013 results. Some minor<br />
changes can occur between the Stage 1 and Stage 2<br />
reporting due to be released in December 2013.<br />
Pre-Compulsory and Compulsory <strong>Education</strong> » Literacy and Numeracy<br />
37
Performance in NAPLAN – Numeracy<br />
Legend<br />
Exempt<br />
1 band<br />
below NMS<br />
AT NMS<br />
1 band<br />
above NMS<br />
2 bands<br />
above NMS<br />
3 bands<br />
above NMS<br />
4 bands<br />
above NMS<br />
NMS = National<br />
Minimum Standard<br />
Achievement of Year 3 Students<br />
Percentage of Students<br />
0% 10% 20% 30% 40% 50% 60% 70% 80% 90% 100%<br />
TAS 2011<br />
2<br />
3<br />
13<br />
25<br />
26<br />
18<br />
12<br />
TAS 2012<br />
1<br />
5<br />
12<br />
23<br />
27<br />
20<br />
11<br />
TAS 2013<br />
2<br />
3<br />
13<br />
25<br />
28<br />
20<br />
10<br />
AUS 2013<br />
2<br />
2<br />
10<br />
24<br />
30<br />
21<br />
11<br />
Achievement of Year 5 Students<br />
Percentage of Students<br />
0% 10% 20% 30% 40% 50% 60% 70% 80% 90% 100%<br />
TAS 2011<br />
1<br />
5<br />
16<br />
30<br />
27<br />
14<br />
6<br />
TAS 2012<br />
1<br />
6<br />
16<br />
26<br />
27<br />
17<br />
7<br />
TAS 2013<br />
2<br />
6<br />
20<br />
30<br />
25<br />
13<br />
6<br />
AUS 2013<br />
2<br />
5<br />
15<br />
26<br />
27<br />
16<br />
9<br />
Achievement of Year 7 Students<br />
Percentage of Students<br />
0% 10% 20% 30% 40% 50% 60% 70% 80% 90% 100%<br />
TAS 2011<br />
2<br />
6<br />
17<br />
28<br />
25<br />
15<br />
8<br />
TAS 2012<br />
1<br />
6<br />
19<br />
29<br />
25<br />
13<br />
7<br />
TAS 2013<br />
1<br />
4<br />
19<br />
31<br />
25<br />
14<br />
6<br />
AUS 2013<br />
2<br />
3<br />
15<br />
28<br />
26<br />
16<br />
11<br />
Achievement of Year 9 Students<br />
Percentage of Students<br />
0% 10% 20% 30% 40% 50% 60% 70% 80% 90% 100%<br />
TAS 2011<br />
1<br />
8<br />
23<br />
29<br />
23<br />
12<br />
5<br />
TAS 2012<br />
1<br />
7<br />
24<br />
31<br />
22<br />
11<br />
5<br />
TAS 2013<br />
2<br />
11<br />
23<br />
27<br />
21<br />
11<br />
6<br />
AUS 2013<br />
2<br />
8<br />
18<br />
26<br />
22<br />
14<br />
11<br />
38 Pre-Compulsory and Compulsory <strong>Education</strong> » Literacy and Numeracy
Commentary<br />
• Tasmania improved on its 2012 mean score results in<br />
Year 7 by 1.8 points.<br />
• For the percentage of students at or above national<br />
minimum standard, Year 3 improved on its 2012 result<br />
by 1.6% and Year 7 by 1.4%.<br />
• During the period 2008 to 2013, Tasmania’s mean<br />
score results for Numeracy at all year levels have<br />
remained statistically comparable.<br />
Explanatory<br />
notes to the<br />
charts<br />
• All figures are inclusive of government and<br />
non-government schools.<br />
• The percentages of students represented have<br />
been rounded and may not sum to 100.<br />
• Exempt students were counted as assessed,<br />
are deemed not to have met the national minimum<br />
standard and are included in the result for each test<br />
at jurisdictional and national levels. They are not<br />
included in school level calculations for mean scores<br />
and the percentages of students below national<br />
minimum standard, but are reported.<br />
• These measures have been sourced from the<br />
national website for NAPLAN –<br />
http://www.nap.edu.au/naplan/naplan.html<br />
• The 2011 and 2012 measures are taken from the<br />
Stage 2 release of those results.<br />
• The 2013 measures are taken from the Stage 1<br />
(preliminary) release of the 2013 results. Some minor<br />
changes can occur between the Stage 1 and Stage 2<br />
reporting due to be released in December 2013.<br />
Closing the Gap on Aboriginal <strong>Education</strong> Outcomes<br />
Performance measure 1,2 Measurement 2009–11<br />
(3 year average)<br />
Indigenous equity<br />
2011 2012<br />
Percentage gap in Indigenous students<br />
8.3% 7.9% 7.3%<br />
achieving expected outcomes 1,2<br />
In terms of a national comparison, Tasmania has the smallest differences in mean score results between Aboriginal<br />
and non-Aboriginal students for all tests and year levels in NAPLAN. On average, the gap between Aboriginal and<br />
non-Aboriginal students in Tasmania is less than half of the national figure.<br />
1. This measure is the average percentage point gap between non-Indigenous and Indigenous students in achievement of expected standards in<br />
Reading and Numeracy tests for Years 3, 5, 7 and 9.<br />
2. A smaller value denotes greater equity.<br />
Pre-Compulsory and Compulsory <strong>Education</strong> » Literacy and Numeracy<br />
39
40 Pre-Compulsory and Compulsory <strong>Education</strong>
Post-Compulsory <strong>Education</strong><br />
and Skills Development<br />
OUTPUT GROUP 2
Direction<br />
The Department of <strong>Education</strong>’s focus for further<br />
education and training is to engage all Tasmanians in<br />
learning opportunities that will enable them to gain<br />
the skills and qualifications they need to contribute<br />
productively to our globalised community and economy.<br />
The priorities for the Further <strong>Education</strong> and Training<br />
Division are to:<br />
• promote higher education, vocational and adult<br />
learning throughout the community to encourage<br />
participation and create fulfilled and enriched<br />
Tasmanians<br />
• provide supported and relevant learning, knowledge<br />
and training opportunities to adult learners to ensure<br />
they are equipped with the skills to contribute<br />
productively to our community and economy<br />
• provide students with tangible pathways to further<br />
education and employment.<br />
During the 2012–13 reporting period through the<br />
Tasmanian Polytechnic, colleges 1 and some combined and<br />
regional schools, the department has provided further<br />
education and training opportunities to enable every<br />
Tasmanian to reach their potential at any stage of life.<br />
Improving the transition of students from Year 10,<br />
their engagement in programs in Year 11 and beyond,<br />
and their attainment of meaningful qualifications remains a<br />
significant focus for the department.<br />
Through the provision of a wide range of programs and<br />
delivery options including Guaranteeing Futures (pathway<br />
planning), Trade Training Centres and Australian schoolbased<br />
Apprenticeships, the department supports students<br />
to achieve a Year 12 qualification or equivalent, and a<br />
purposeful pathway into further education, training or work.<br />
Tasmania’s target is for 81.6% of students to attain Year 12<br />
or equivalent qualifications by 2015. This target represents<br />
Tasmania’s contribution to the national target of 90%<br />
Year 12 or equivalent attainment by 2015 set through the<br />
National Partnership Agreement on Youth Attainment and<br />
Transitions. Tasmania’s current attainment rate is 78.35% 2 .<br />
Government <strong>Education</strong> and Training International<br />
provides local and international students with an enriching<br />
educational experience while increasing enrolment<br />
numbers to benefit Tasmanian education providers and<br />
the community.<br />
In December 2011, the Minister for <strong>Education</strong> and Skills,<br />
the Hon. Nick McKim MP announced a review into<br />
the role and function of Tasmania’s public Vocational<br />
<strong>Education</strong> and Training (VET) providers, by independent<br />
consultant Virginia Simmons AO. As a result of the review,<br />
a new single entity, TasTAFE has been established using<br />
the combined resources of the Tasmanian Polytechnic<br />
and Tasmanian Skills Institute. TasTAFE, is covered under<br />
one piece of contemporary legislation and came into<br />
effect from 1 July 2013. This improved arrangement for<br />
the public provision of VET will result in quality training,<br />
improved outcomes and ease of access for learners.<br />
Further to the outcomes of the review, Skills Tasmania<br />
has now become a business unit of the Department<br />
of <strong>Education</strong>. This new arrangement will continue to<br />
maintain the strong links between the department and<br />
the Tasmanian business community to ensure that the<br />
skills and training needs of business enterprises are met<br />
appropriately, and will also facilitate a more streamlined<br />
alignment between Skills Tasmania and other business<br />
units of the department.<br />
1. Colleges were part of the Further <strong>Education</strong> and Training Division until<br />
the end of 2012. From 2013, colleges became part of the Early Years and<br />
Schools Division and are now referred to as senior secondary schools.<br />
2. COAG Reform Council’s report on the assessment of the National<br />
Partnership Agreement on Youth Attainment and Transitions attainment<br />
targets (August 2013).<br />
42 Post-Compulsory <strong>Education</strong> and Skills Development
Major Initiatives<br />
Implementation<br />
of the<br />
Recommendations<br />
of the<br />
Review into<br />
the Role and<br />
Function of<br />
Tasmania’s<br />
Public VET<br />
Providers<br />
An independent review of the role and function of<br />
Tasmania’s public VET providers was completed during<br />
the 2011–12 financial year. The implementation of the<br />
recommendations from the review formed a significant<br />
part of the division’s work during the 2012–13 financial year.<br />
The review made 60 recommendations, the<br />
overwhelming majority of which were accepted. All of<br />
the recommendations that related to the establishment<br />
of a single entity for the delivery of publicly funded VET in<br />
Tasmania have been actioned. The new entity, TasTAFE,<br />
commenced on 1 July 2013.<br />
The process undertaken to establish TasTAFE was<br />
overseen by a high level steering committee and managed<br />
by a specifically established project management team.<br />
It was actioned by a large number of working groups,<br />
each established to achieve specific outcomes relative<br />
to individual components of the new TasTAFE structure.<br />
A feature of these working groups was that they involved,<br />
in total, the active participation of over 150 staff<br />
members from the Tasmanian Polytechnic and<br />
Tasmanian Skills Institute.<br />
The process also involved the successful development<br />
and implementation of the legislative framework<br />
necessary to facilitate the establishment of the appropriate<br />
governance framework within which the new organisation<br />
would function. This objective was achieved with the<br />
passage of the relevant legislation, the Training and<br />
Workforce Development Bill 2013, the Training and Workforce<br />
Development (Transitional Provisions) Bill 2013 and the Training<br />
and Workforce Development (Repeals and Consequential<br />
Amendments) Bill 2013 through the Tasmanian Parliament<br />
in May 2013.<br />
Retention and<br />
Attainment<br />
Strategy<br />
The Retention and Attainment Strategy Years 10–12 guides<br />
the work of the Department of <strong>Education</strong> in improving<br />
the transition of students from Year 10 to further<br />
education and training, engaging students so they gain a<br />
meaningful Year 12 or equivalent qualification.<br />
A key initiative of the strategy is the introduction of<br />
a tracking system for students from Year 10 to the<br />
completion of Year 12 or equivalent. This is incorporated<br />
in 2013 into the Student Support System (SSS). As a<br />
result of this data collection, there is an extensive process<br />
of following up at-risk and disengaged students and<br />
supporting their re-engagement. This year saw the further<br />
refinement of the support model with the appointment of<br />
four Youth Transition Officers (YTOs).<br />
The student tracking system involves all colleges and<br />
the Tasmanian Polytechnic following up on Year 11 and<br />
12 leavers. The YTOs from Guaranteeing Futures teams<br />
are integral to this process. Reports on progress are<br />
submitted on 1 May, 1 September and 30 November.<br />
The strategy focuses on a range of areas to support<br />
transition, engagement and achievement of qualifications<br />
including:<br />
• high quality pathway planning<br />
• open and consistent communication between schools,<br />
colleges, the Tasmanian Polytechnic and (more<br />
recently) TasTAFE<br />
• a coordinated approach to course offerings<br />
• quality information available to and accessible by<br />
students, parents and teachers<br />
• quality teaching<br />
• quality learning support and learning environments<br />
• relevant and flexible programs.<br />
In line with the strategy, a focal point for the Guaranteeing<br />
Futures teams is to work with all Year 10 students to<br />
ensure they are well informed about choices for their<br />
future options. This encompasses supported transition<br />
processes including:<br />
• the ‘2014 Your Guide to <strong>Education</strong> and Training in Years<br />
11 and 12’; a statewide guide outlining programs and<br />
courses available in different regions across the state<br />
• suitability processes for VET programs to ensure<br />
students are in appropriate learning options<br />
• enrolments into Year 11 courses informed by a<br />
student’s transition profile.<br />
As noted earlier, Tasmania’s target is for 81.6% of students<br />
to attain Year 12 or equivalent qualifications by 2015.<br />
Tasmania’s most recently measured attainment rate is<br />
78.35%¹.<br />
1. COAG Reform Council’s report on the assessment of the National<br />
Partnership Agreement on Youth Attainment and Transitions attainment<br />
targets (August 2013).<br />
Student<br />
Retention<br />
Beyond the<br />
Compulsory<br />
Years in Rural,<br />
Regional and<br />
Disadvantaged<br />
Communities<br />
Project<br />
The Australian Research Council (ARC) Linkage Project is<br />
a collaborative longitudinal study being undertaken by the<br />
University of Tasmania and the Department of <strong>Education</strong>,<br />
which commenced in July 2011.<br />
The project is investigating the nature, impact and efficacy<br />
of a range of intervention strategies at primary school,<br />
secondary school and college levels aimed at enhancing<br />
student retention in education beyond the compulsory<br />
years of schooling. It will build knowledge of the ways in<br />
which factors known to influence retention interact with<br />
one another and other relevant but under-researched<br />
variables. This three year study will be located in rural,<br />
regional and lower socioeconomic areas of Tasmania.<br />
Post-Compulsory <strong>Education</strong> and Skills Development<br />
43
Guaranteeing<br />
Futures<br />
Guaranteeing Futures is the Department of <strong>Education</strong>’s<br />
long term initiative in which programs and activities are<br />
provided to support students in making a successful<br />
transition from compulsory schooling to further<br />
education, training or employment.<br />
Guaranteeing Futures teams operate in each region to<br />
provide pathway planning and transition support that<br />
assists young people to explore their unique set of needs<br />
and capabilities by identifying their strengths, interests,<br />
goals and aspirations.<br />
The work of Guaranteeing Futures is informed by:<br />
• the Retention and Attainment Strategy Years 10–12<br />
• the Pathways and Participation: Guaranteeing Futures<br />
Strategic Plan 2013–2015: working with students 9–12.<br />
Our key priorities are:<br />
1. To ensure all Year 10 students participate in a pathway<br />
planning process and complete a transition profile.<br />
Supportive strategies will include:<br />
º º identifying and implementing best practice<br />
º º finding opportunities to engage with industry<br />
to ensure contemporary knowledge<br />
º º liaising with Learning Services to ensure all<br />
students are included.<br />
2. To ensure smooth transition processes for students<br />
from Year 10 to Year 11.<br />
Supportive strategies will include:<br />
º º breaking down barriers for regional and<br />
rural students<br />
º º fostering and strengthening relationships<br />
with Year 11 providers to better support<br />
student transition<br />
º º liaising with Learning Services to ensure<br />
integrated support for at-risk students.<br />
3. To raise awareness of career pathways in schools –<br />
including senior secondary schools.<br />
Supportive strategies will include:<br />
º º promoting career awareness raising activities<br />
across Years 7–12<br />
º º engaging school staff, families and communities<br />
in promoting and valuing options for students’<br />
futures<br />
º º promoting completion of Year 12 or a recognised<br />
vocational education pathway.<br />
Our priorities are implemented by Pathway Planning<br />
Officers (PPOs):<br />
• working with individual students to support them to<br />
make informed choices about Year 11<br />
• conversing with students about realistic pathways<br />
• providing students with opportunities to participate in<br />
related career awareness activities<br />
• ascertaining students’ intended destinations<br />
• communicating with key senior secondary staff and<br />
a number of follow up visits to senior secondary<br />
campuses.<br />
Underpinning this network are Youth Learning Officers<br />
(YLOs) and Youth Transition Officers (YTOs) who<br />
provide intensive support to a group of identified young<br />
people as they transition into further education, training<br />
or employment, with particular focus on those students<br />
who have multiple barriers to completing education<br />
and training.<br />
Career Programs Coordinators (CPCs) facilitate a broad<br />
range of career awareness programs for the students to<br />
explore a variety of pathways.<br />
The department has developed and will maintain<br />
valuable resources to support students to plan meaningful<br />
pathways.<br />
Career Awareness Programs (CAPs) continue to be<br />
developed to provide authentic, informative experiences<br />
to broaden students’ understandings of various career<br />
pathways. Some of these initiatives are statewide and<br />
others are regionally based.<br />
Guaranteeing Futures collaborates with a range of<br />
education and industry providers to develop programs<br />
that raise students’ aspirations and broaden their<br />
knowledge of pathways.<br />
Taste of Polytechnic programs are a partnership with<br />
TasTAFE and involve approximately 800 students<br />
statewide in approximately 40 programs. The programs<br />
vary in length but all offer experiences in an adult learning<br />
environment gaining industry specific skills.<br />
An audit was completed on 2012 CAPs against the<br />
Tasmanian skills shortage list, and PPOs provide input<br />
around students’ interests to ensure both of these aspects<br />
are included in program development.<br />
44 Post-Compulsory <strong>Education</strong> and Skills Development
Australian<br />
School-based<br />
Apprenticeships<br />
Over the past two years the department has undertaken<br />
considerable work to repackage and reposition Australian<br />
School-based Apprenticeships and Traineeships to<br />
support retention and attainment, skills development of<br />
young people and improve industry workforce planning<br />
and development to support economic growth.<br />
This work has included a major review and analysis of<br />
the delivery and management of Australian School-based<br />
Apprenticeships (ASbA) in Tasmania from 2001–11.<br />
The review has informed and driven the development<br />
of the Department of <strong>Education</strong> Smart Workforce<br />
Development, A Tasmanian Strategy 2013–2015.<br />
The implementation of this strategy is underpinned by the<br />
following four key action areas:<br />
Action Area 1: ASbA Support Skills Growth<br />
Growing the quality and quantity of ASbA across a range<br />
of targeted industry sectors is the key objective of the<br />
Tasmanian ASbA Strategy Action Plan. Specifically, the plan<br />
aims to increase the engagement of industry sectors<br />
that have been identified in the Tasmanian Economic<br />
Development Plan. The department is working closely with<br />
the transport and logistics, aquaculture, construction,<br />
hospitality and tourism industry sectors on the<br />
development of ASbA workforce development initiatives<br />
for each of these industry sectors.<br />
Action Area 2: Marketing and Promotion<br />
of ASbA<br />
There are a broad range of stakeholders involved in<br />
ASbA, however, for many of them, access to accurate<br />
and high quality information and advice on ASbA has<br />
not always been easy to find. To address this issue the<br />
department has undertaken the initial mapping for the<br />
development of an ASbA information portal. This portal<br />
will provide a centralised point of information which<br />
promotes ASbA to students, schools, parents and<br />
employers, providing them with access to high quality<br />
information on ASbA initiatives, requirements and<br />
approved pathways.<br />
Action Area 3: Improved Quality of<br />
ASbA Delivery and Management<br />
An ASbA program is most effective when all stakeholders<br />
work collaboratively to support young people and<br />
employers, however, many ASbA stakeholders have<br />
differing roles and responsibilities. Some stakeholders are<br />
easily identified while others work behind the scenes to<br />
provide support and maintain quality standards.<br />
The department has been working collaboratively with<br />
ASbA stakeholders to identify and implement a best<br />
practice approach towards coordination, management<br />
and support of ASbA.<br />
Action Area 4: ASbA Quality Assurance<br />
and Continuous Improvement<br />
Although the Tasmanian ASbA strategy targets the<br />
development of key actions to improve both the quality<br />
and outcomes of ASbA programs in Tasmania, it is<br />
critical that we remain open to the possibility of further<br />
improvement. It is for this reason that systems and<br />
procedures are being developed to ensure all aspects of<br />
ASbA programs are monitored, reviewed and improved.<br />
This will ensure that they are able to operate within<br />
the requirements of any future educational, social,<br />
employment or economic changes that may occur.<br />
Post-Compulsory <strong>Education</strong> and Skills Development<br />
45
Trade Training<br />
Centres<br />
The Tasmanian Government has accessed the Australian<br />
Government’s Trade Training Centres in Schools Program<br />
as part of its strategy to increase vocational training<br />
opportunities for people living in rural and remote areas.<br />
The aim has been to establish skill hubs in regional areas,<br />
involving as many schools in the area as possible.<br />
Schools and the Tasmanian Polytechnic have collaborated<br />
with local communities to develop and submit applications<br />
for projects on behalf of the government sector in<br />
the state.<br />
The centres are designed to deliver a number of trade<br />
competencies (not all at each site) covering auto-electric,<br />
electro technology, bricklaying and plastering, roofing and<br />
general plumbing, metals, carpentry and joinery, welding,<br />
floor tiling, cookery, aged care, agriculture, aquaculture<br />
and horticulture. The competencies are generally up to<br />
Certificate II level qualifications which will articulate to<br />
Certificate III.<br />
The Tasmanian Government has a sectoral plan for Trade<br />
Training Centres and works closely with stakeholders<br />
from independent and catholic schools to identify<br />
opportunities to collaborate. Future projects will include<br />
the refurbishment of existing facilities to bring them up to<br />
industry standard and to offer training in traditional trade<br />
areas and emerging industries.<br />
The first three centres were constructed at George<br />
Town, Dorset and Bridgewater and began operation in<br />
2011. They offer a suite of VET programs for students<br />
enrolled in Years 11 and 12, as well as pre-employment<br />
VET programs for young people and adults preparing to<br />
undertake apprenticeship employment. Students in Years<br />
9 and 10 also access VET programs at these centres.<br />
Additional centres at Huonville, St Helens/St Marys and<br />
Smithton were completed in 2012 and have been offering<br />
programs for the past 12 months to students in Years<br />
9–12 as well as mature aged students.<br />
The Deloraine centre was completed in January 2013 and<br />
is offering aged care and commercial cookery. The South<br />
East Trade Training Centre at Sorell/Triabunna is planned<br />
for completion in July with trials beginning in late 2013,<br />
with full operation in commercial cookery and horticulture<br />
expected in 2014.<br />
Applications have been submitted to the Australian<br />
Government under funding round five for centres at<br />
Queenstown/Rosebery and the Tasman.<br />
46 Post-Compulsory <strong>Education</strong> and Skills Development
Year 11 and<br />
12 <strong>Education</strong><br />
in Rural and<br />
Regional<br />
Areas<br />
The Department of <strong>Education</strong> is committed to providing<br />
high quality education and training to Year 11 and 12<br />
students in rural and regional areas that is aligned to<br />
employment opportunities, attainment of qualifications,<br />
or pathways to higher or further education.<br />
In 2012–13, the department continued to consult and<br />
work towards improving the provision and quality of<br />
education in rural and remote communities.<br />
Options for Year 11 and 12 students include:<br />
• enrolling on-campus in a senior secondary school for the<br />
full-range of academic, general and vocational courses<br />
• accessing the Flexible Learning Network (FLN) that<br />
allows courses to be delivered through a senior<br />
secondary school via distance education<br />
• a combination of traditional study on-campus and<br />
study by distance through the FLN to benefit from<br />
both options<br />
• accessing Year 11 and 12 programs through combined<br />
schools’ programs<br />
• enrolment through the Tasmanian eSchool, which<br />
provides learning in real-time regardless of the<br />
student’s geographic location<br />
• accessing VET through the Tasmanian Polytechnic,<br />
which provides services to most individual and<br />
combined schools’ programs and colleges<br />
• accessing industry aligned VET qualifications through<br />
the new and innovative trade training centres located<br />
in many rural and regional areas of Tasmania.<br />
Tasmanian<br />
Polytechnic<br />
The Tasmanian Polytechnic continued to focus its efforts on<br />
providing VET for adults, and in partnerships with senior<br />
secondary and combined schools—VET in Schools programs<br />
for young Tasmanians between 16 and 19 years of age.<br />
The Tasmanian Polytechnic enrolled 16,500 students<br />
during the 2012 academic year and this enrolment<br />
pattern has continued into 2013. Of these enrolments<br />
44% represent enrolments in qualifications at Certificate<br />
III or higher, 47% represent enrolments in qualifications<br />
at Certificate I or Certificate II and the balance are<br />
enrolments in programs that lead to a Statement of<br />
Attainment or are in a non-award course. These students<br />
were enrolled in over 300 qualifications and resulted in<br />
the delivery of 5.2 million student contact hours.<br />
During 2012, the Tasmanian Polytechnic issued 5,206<br />
qualifications, a figure that is comparable with achievements<br />
in 2011 and 2010. Over half of these qualifications (53.7%)<br />
were awarded at Certificate III or higher.<br />
Quality assurance of training delivery has been a key focus<br />
of the Tasmanian Polytechnic’s activities in 2012. This is<br />
evidenced by:<br />
• the continuing implementation of the partnership<br />
between the Tasmanian Polytechnic and the University<br />
of Tasmania (UTAS) that includes over 120 Tasmanian<br />
Polytechnic teachers enrolling in the Bachelor of<br />
<strong>Education</strong> (Applied Learning) Degree program<br />
offered by UTAS<br />
• the ongoing enthusiasm with which learning teams<br />
have engaged in the Tasmanian Polytechnic team<br />
quality profile management model for quality<br />
improvement<br />
• the completion by the due date (30 June 2013) of<br />
a project that ensured all Tasmanian Polytechnic<br />
teaching staff met the new quality standard of<br />
teaching qualifications required by the National Skills<br />
Standards Council.<br />
Further evidence of quality improvement within<br />
the Tasmanian Polytechnic is provided through a 2%<br />
improvement in the student satisfaction survey result in<br />
2012 when compared with 2011 – which was in turn a 3%<br />
improvement on the 2010 figure.<br />
The Tasmanian Polytechnic continued, during the 2012–13<br />
financial year, its focus on establishing a strong sustainable<br />
platform upon which future development could be<br />
based. This activity is evidenced through the significantly<br />
improved financial situation of the Tasmanian Polytechnic<br />
which, at the end of the 2012 academic year, reported a<br />
small surplus of revenue over expenditure. This focus has<br />
continued into 2013.<br />
Government<br />
<strong>Education</strong><br />
and Training<br />
International<br />
(GETI)<br />
GETI provides Tasmanian students with an enriching<br />
educational experience by attracting students from over<br />
46 countries to study in Tasmania for full-time school<br />
and vocational qualifications, short-term study abroad<br />
programs and English language courses.<br />
GETI also develops and manages the provision of<br />
Tasmanian Government education services to offshore<br />
students in a number of countries including China<br />
and Kuwait.<br />
International students bring cultural understanding,<br />
global connections and revenue to benefit our education<br />
institutions and the broader Tasmanian community.<br />
GETI’s strategic objectives are to increase international<br />
student enrolments in Tasmanian Government schools<br />
and TasTAFE.<br />
To achieve this objective, the following initiatives were<br />
implemented over 2012–13:<br />
• Several international student events to welcome and<br />
recognise our international students – sponsored by<br />
the Minister’s International <strong>Education</strong> Roundtable.<br />
• Manage Tasmania’s international education brand<br />
including a new student-focused website and updated<br />
recruitment materials focusing on the key benefits of<br />
studying in Tasmania.<br />
• A rewards-based incentive program for international<br />
education agents who provide more than 75% of<br />
international students to Tasmania.<br />
• Consolidating marketing and recruitment investment<br />
on key markets, based on statistical evidence and<br />
return on investment.<br />
• Continuing development of education programs<br />
including pathways between sectors to ensure<br />
Tasmania remains a viable option for international<br />
education as markets evolve.<br />
Post-Compulsory <strong>Education</strong> and Skills Development<br />
47
Performance<br />
Performance Measure 2010–11 2011–12 2012–13<br />
Actual 1 Actual 1 Target<br />
Attainment measures for 15–19 year-olds, achieving:<br />
2013–14<br />
Target<br />
120 credit points in education and training 4,178 4,438 4,395 4,595<br />
some vocational education and training 2 5,591 7,634 7,600 7,900<br />
a Tasmanian Certificate of <strong>Education</strong> 2,878 3,179 3,075 3,404<br />
a tertiary entrance rank 2,224 2,237 2,428 2,382<br />
NSSC Census 3 8,470 8,592 8,200 8,300<br />
Apparent retention rate Years 10–12 4 70.4 67.0 71.0 71.0<br />
Full year training equivalents 5 14,600 N/A 14,600 14,700<br />
Training participation rate 5 14.1 N/A 14.3 14.5<br />
Student Satisfaction – Graduates 6 90.6 90.3 90.0 91.0<br />
Student Satisfaction – Module Completers 6 79.2 90.9 87.0 91.0<br />
Sources: Tasmanian Qualifications Authority, National Schools Statistics Collection (NSSC), Australian Bureau of Statistics (ABS) Schools, Australia (cat. no. 4221.0),<br />
NCVER Student Outcomes Survey 2012, Annual National Report of the Australian Vocational <strong>Education</strong> and Training System 2011.<br />
Notes:<br />
1. Actual performance measures are based on calendar years. The<br />
measures for the 2010–11 Actual are based on the 2011 calendar year,<br />
while the measures for 2011–12 Actual are based on the 2012 calendar<br />
year. Completion and participation rates are affected by economic<br />
circumstances and targets assume these circumstances, especially<br />
youth employment opportunities, will remain stable over this period.<br />
Some figures vary from figures published in the department’s budget<br />
papers (2012–13) due to a more recent data set being available for<br />
this report.<br />
2. From 2012–13, this measure includes Vocational <strong>Education</strong> and Training<br />
(VET) data sourced from all non-government registered training<br />
authorities.<br />
3. Actuals are the total full-time equivalent (FTE) for further education<br />
students regardless of age, at the Mid-Year Census. The 2012–13 and<br />
2013–14 targets represent a slight reduction associated with forecasts of<br />
student cohort size.<br />
4. Apparent Retention Rate is a measure of the number of school students<br />
in a designated year of education expressed as a percentage of their<br />
respective cohort group in a base year. Figures relate to full-time<br />
government school students. Retention improved significantly in 2010<br />
due to a combination of many factors, most notably students studying<br />
longer, new entrants to the Further <strong>Education</strong> and Training system who<br />
had not previously been enrolled in a Tasmanian Government school<br />
and adults returning to the sector after breaks in education. For small<br />
populations like Tasmania, the ABS notes that relatively small changes<br />
in student numbers can create large movements in apparent retention<br />
rates. ABS also notes that care should be exercised in the interpretation<br />
of apparent retention rates as the method of calculation does not take<br />
into account a range of factors such as:<br />
• students progressing at a faster or slower than expected rate of<br />
one grade-level a year<br />
• interstate/international migration<br />
• movement between government and non-government sectors<br />
• enrolment policies<br />
• students enrolled in alternative education and training pathways,<br />
such as vocational education and training.<br />
Sustained improvement in retention is long term in nature and will be<br />
subject to variations from year to year.<br />
5. Participation (age 15–64) in all publicly funded VET and commercial<br />
activity by government providers. Participation rates are derived by<br />
calculating total student numbers in the age group as a percentage of the<br />
estimated residential population in that age group. The participation rate<br />
is sensitive to enrolments in short courses.<br />
6. The 2011–12 actual data is not available at the time of publication.<br />
Preliminary 2011–12 data was planned to be available in late May 2013<br />
and published on the Skills Tasmania website. These figures will be<br />
verified with National Centre for Vocational <strong>Education</strong> Research<br />
(NCVER) data in July.<br />
7. Student satisfaction is the percentage of a sample of students surveyed<br />
by the NCVER who reported that they were satisfied with the overall<br />
quality of training.<br />
48 Post-Compulsory <strong>Education</strong> and Skills Development
LINC Tasmania<br />
OUTPUT GROUP 3
Direction<br />
LINC Tasmania’s statewide network gives Tasmanians<br />
integrated access to library services, research and<br />
information, adult literacy support, community learning,<br />
online access and archive and heritage services.<br />
The strategic direction of LINC Tasmania centres on:<br />
• informed Tasmanians: high quality information services<br />
accessible to all Tasmanians<br />
• skilled Tasmanians: improving skills through adult<br />
literacy and community learning programs<br />
• connected Tasmanians: opportunities, spaces and<br />
resources for interaction and connection.<br />
LINC Tasmania aligns with the Department of <strong>Education</strong>’s<br />
overall vision and mission by supporting learning for all<br />
Tasmanians in a variety of settings across its extensive<br />
network, with libraries, LINCs and online access centres<br />
established in 69 locations throughout the state.<br />
Extending services to more Tasmanians – particularly<br />
those who need greater information and technology<br />
access, skills and support to participate in work and<br />
community life – was a key focus for LINC Tasmania in<br />
2012–13. Achievements this year included:<br />
• launch and development of the 26TEN adult<br />
literacy strategy<br />
• establishment of a new regional LINC at Scottsdale<br />
• consultation process to start updating the existing<br />
legislative framework under which LINC Tasmania<br />
operates<br />
• achieving Re-imagining Reference Services Project<br />
milestones including reshaping collections<br />
• rollout of free public Wi-Fi to all major LINC Tasmania<br />
service locations<br />
• celebrating reading and literacy throughout 2012,<br />
the National Year of Reading.<br />
LINC Tasmania contributes to the department’s<br />
Purposeful Pathways priority through its adult literacy<br />
support and community learning programs. LINCs offer<br />
a range of formal, informal, and recreational courses and<br />
activities to encourage adults, and particularly those who<br />
are marginalised, to reconnect with education, build their<br />
confidence and participate more fully in community life.<br />
The majority of government and private records are now<br />
created in digital format. The Tasmanian Archive and<br />
Heritage Office (TAHO) faces significant challenges to<br />
enable the long term secure preservation and accessibility<br />
of Tasmania’s digital information assets. TAHO has<br />
identified a critical need to develop and implement<br />
a Digital Preservation Strategy and establish a Digital<br />
Repository to ensure the long-term preservation and<br />
accessibility of Tasmanian information.<br />
LINC Tasmania hosted national meetings for two<br />
key professional bodies, National and State Libraries<br />
Australasia (NSLA) and the Council of Australasian<br />
Archives and Records Authorities (CAARA) in<br />
March 2013. This was a valuable opportunity for<br />
LINC Tasmania to engage with key leaders from all<br />
major Australasian library and archival institutions.<br />
Volunteers continue to provide essential support for the<br />
delivery of core services in LINC Tasmania. Traditionally<br />
volunteers have provided support as couriers for the<br />
Home Library Service, in basic customer service tasks and<br />
for ‘one-to-one’ client assistance in online access centres.<br />
As LINC Tasmania has evolved, volunteering opportunities<br />
have expanded to include a training program for adult<br />
and family literacy tutors to provide one-to-one support<br />
in a range of community settings. LINC Tasmania<br />
volunteer numbers have increased significantly. In 2012–13<br />
volunteers contributed 112,517 hours to LINC Tasmania,<br />
which is equivalent to 59 full-time positions. This is an<br />
11% increase on the previous year of 101,015 hours or<br />
53 full-time positions.<br />
50 LINC Tasmania
Major Initiatives<br />
New Regional<br />
Learning and<br />
Information<br />
Network<br />
Centres<br />
(LINCs)<br />
As part of the government’s Capital Investment Program,<br />
LINC Tasmania was allocated funding of $6.4 million in<br />
2012–13 towards the establishment of LINCs in Scottsdale<br />
and George Town. This was the fourth year of a $14.6<br />
million capital investment to establish regional LINCs<br />
in high priority areas of Bridgewater, George Town,<br />
Scottsdale, Sorell and Queenstown.<br />
Completed during 2012–13, Scottsdale LINC follows<br />
the principle of integrated services, which has been a<br />
priority for LINC Tasmania since its establishment, and is<br />
co-located with other key service providers –<br />
Service Tasmania and the Dorset <strong>Education</strong> and<br />
Training service.<br />
Scottsdale LINC provides clients with seamless access to<br />
a range of government services in the one place including<br />
library and information, computers, adult literacy support,<br />
training and skills development, and over-the-counter<br />
transactions with government via Service Tasmania.<br />
Most services are free or low-cost to enable full<br />
community participation.<br />
A total of 1,100 people came through the doors of<br />
the new LINC in the first week of opening – which is<br />
equivalent to 50% of the population of Scottsdale. The<br />
demographic of users is varied with a significant number<br />
of young people making use of Wi-Fi and other facilities.<br />
As with other regional LINCs, it is planned to establish a<br />
community advisory group at Scottsdale to provide advice<br />
and feedback on service developments.<br />
The opening of the Scottsdale LINC followed the<br />
Queenstown and Bridgewater LINCs that were opened<br />
in 2011–12. The George Town hub has been delayed by<br />
planning issues and the Sorell LINC was deferred as part<br />
of the 2011–12 Tasmanian Government budget savings.<br />
LINC Tasmania was proud to have one of its new<br />
regional LINC buildings recognised in the 2013 Tasmanian<br />
Architecture Awards. Liminal Architecture was awarded<br />
the ‘Alan C Walker’ award for public architecture by<br />
the Australian Institute of Architects for the new<br />
Bridgewater LINC and Child and Family Centre on<br />
15 June 2013.<br />
26TEN<br />
The 26TEN Strategy<br />
was launched on<br />
26 October 2012, as an<br />
action of the Tasmanian<br />
Adult Literacy Action Plan<br />
2010–2015. The name<br />
and logo were developed<br />
through a consultative<br />
process involving literacy<br />
support providers and<br />
adults with low literacy<br />
skills. 26TEN represents<br />
the 26 letters of the alphabet and the 10 base digits of the<br />
numerical system – the fundamental building blocks of<br />
literacy and numeracy skills.<br />
26TEN aims to raise community awareness of adult<br />
literacy issues and encourage organisations and individuals<br />
to work together to improve outcomes in Tasmania.<br />
The 26TEN members' program continues to grow with<br />
40 launch members developing action plans and working<br />
collaboratively to address adult literacy issues.<br />
Tasmania’s 26TEN Strategy includes:<br />
• a members’ program to help build the network and<br />
extend the range of programs, services and support<br />
available to Tasmanians<br />
• the 26TEN website to inform Tasmanians about<br />
adult literacy programs and services and to give the<br />
network a home<br />
• the ‘1300 002 610’ phone service to guide and refer<br />
Tasmanians seeking help<br />
• free literacy awareness and plain English workshops to<br />
raise awareness and promote action<br />
• a public awareness campaign to inform Tasmanians of<br />
the benefits of literacy skills and convey the message<br />
that the 26TEN network is ready and available to help<br />
• the 26TEN Grants Program to fund projects to improve<br />
the literacy skills of Tasmanians in workplaces and<br />
communities.<br />
The 26TEN Strategy has the capacity to raise community<br />
awareness of adult literacy issues and to remove the<br />
stigma associated with low literacy skills, especially in<br />
regional and remote communities.<br />
LINC Tasmania<br />
51
Literacy<br />
services<br />
A key strategy of the Tasmanian Adult Literacy Action Plan<br />
2010–2015 is the establishment of a statewide network<br />
of literacy coordinators and trained volunteer literacy<br />
tutors. In 2012–13, LINC Tasmania’s literacy coordinator<br />
network saw 23 coordinators and more than 600 trained<br />
volunteers assisting many hundreds of Tasmanians with low<br />
literacy skills.<br />
Literacy coordinators and volunteers are located in urban<br />
and regional communities across Tasmania including<br />
Bridgewater, Burnie, Deloraine, Devonport, George Town,<br />
Glenorchy, Hobart, Huonville, Kingston, Launceston,<br />
New Norfolk, Rosny, Scottsdale, Smithton, Sorell, St Helens<br />
and Queenstown. Three literacy coordinators work<br />
with the Department of Justice to support prisoners and<br />
offenders, with one coordinator based at Risdon Prison and<br />
two coordinators working with Community Corrections in<br />
Launceston and Hobart.<br />
LINC Tasmania literacy clients have diverse literacy learning<br />
needs and requirements and engage in a range of support<br />
services and programs, including one-to-one support,<br />
small group activities and skills development programs.<br />
Typically, adults seek literacy learning support through<br />
LINC Tasmania because they wish to develop their core<br />
skills (and confidence) in informal contexts that are relevant<br />
to their everyday lives – in order to improve their quality of<br />
life, their social connections and/or their capacity to access<br />
employment, education, and training opportunities.<br />
A large proportion of LINC Tasmania literacy clients (73%<br />
in 2012–13) have skill levels assessed at pre-level 1 (25%)<br />
or level 1 (48%) in one or more of the five core skills<br />
of reading, writing, numeracy, oral communication and<br />
learning. Many LINC Tasmania clients are also from culturally<br />
and linguistically diverse backgrounds, with limited literacy<br />
skills in their first language. A number of clients also have<br />
a learning disability. These client characteristics can make<br />
learner retention in literacy support services and programs<br />
problematic and pathways and transitions into employment,<br />
education and training difficult. They can also result in slow<br />
progress towards the achievement of learner goals and<br />
outcomes, and can pose significant challenges for a service<br />
network that relies largely on a volunteer workforce to<br />
achieve its performance targets.<br />
Successfully addressing the needs and requirements of<br />
literacy learners takes time, resources and innovative<br />
approaches. It requires a broad understanding and<br />
acceptance that there are no “quick fixes” and that some<br />
level of uncertainty around the solutions to the challenges<br />
of adult literacy, for individuals and their communities,<br />
is to be accepted.<br />
One of the emerging challenges associated with<br />
LINC Tasmania’s statewide provision of literacy services is<br />
that client engagement in regional areas lags considerably<br />
behind levels in urban centres. For example, in 2012–13<br />
LINC Tasmania urban services achieved, on average,<br />
81% of their performance targets, compared with 39% for<br />
services in regional areas. This variation supports existing<br />
evidence and research showing that adults with low level<br />
literacy skills living in regional and remote areas continue to<br />
experience significant barriers to literacy learning and are<br />
reluctant to seek support.<br />
Literacy Skills Development Program<br />
The LINC Tasmania Literacy Skills Development Program,<br />
part of the Tasmanian Adult Literacy Action Plan’s $1 million<br />
Investment Fund, provides $300,000 per annum to deliver<br />
practical and personal learning outcomes through learning<br />
strategies designed specifically for adults. Programs focus<br />
on building participants’ reading, writing, numeracy, oral<br />
communication and learning skills in particular contexts.<br />
Adult Literacy Coalition of Interest<br />
An Adult Literacy Coalition of Interest was established by<br />
the Minister for <strong>Education</strong> and Skills in 2011. Comprising<br />
business and community representatives, the coalition has<br />
been established to champion Tasmania’s Adult Literacy<br />
Network and oversee the implementation of the Action<br />
Plan. The Coalition assists in maximising the involvement<br />
of business and community sectors in the implementation<br />
of the Action Plan and actively promotes participation<br />
by community, business and government organisations in<br />
the network.<br />
Resource<br />
Description<br />
and Access<br />
implementation<br />
LINC Tasmania has started a process of enhancing<br />
records in its library catalogues through adoption of a new<br />
international standard – RDA (Resource Description and<br />
Access). RDA makes searching more intuitive and user<br />
friendly, and will allow for easier integration with records<br />
from other institutions such as museums and archives.<br />
In 2013, LINC Tasmania staff are conducting training<br />
sessions across the state for over 150 participants from<br />
schools, TasTAFE and LINC Tasmania, who are all partners<br />
in the TALIS catalogue.<br />
52 LINC Tasmania
Wireless<br />
access for<br />
clients<br />
Following a successful pilot in Hobart, free public Wi-Fi<br />
has now been rolled out to 12 urban and regional LINCs.<br />
Planning is underway to extend Wi-Fi to additional<br />
LINC Tasmania service points in 2013–14. The provision<br />
of wireless access is a key priority for LINC Tasmania,<br />
enabling the provision of more flexible and convenient<br />
access to the internet and web-based services.<br />
Modernising<br />
Tasmania’s<br />
archives<br />
and libraries<br />
legislation<br />
LINC Tasmania operates within a legislative framework<br />
encompassing the Libraries Act 1984, the Archives Act 1983,<br />
and associated subordinate legislation.<br />
A review of existing legislative framework began in 2012.<br />
The review aims to ensure that Tasmania has a legislative<br />
framework that reflects contemporary practices in an<br />
increasingly digital environment. The areas under review<br />
relate principally to administrative processes and updating<br />
definitions. Recommended changes have no impact on the<br />
provision of services to clients. A consultation process was<br />
undertaken in May 2013 to seek comments and feedback<br />
from key organisations and stakeholders. Responses will<br />
help to shape final recommendations for new legislation.<br />
Re-imagining<br />
LINC<br />
Tasmania<br />
reference<br />
services<br />
New technologies and the internet continue to have a<br />
growing impact on traditional reference services.<br />
Re-shaping statewide reference services has been a<br />
strategic priority for LINC Tasmania for a number of years<br />
to ensure that reference services, collections and staffing<br />
models are efficient and relevant to the needs of clients.<br />
Significant achievements have been made towards realising<br />
a contemporary reference service for Tasmanians.<br />
In 2012–13 the main emphasis has been on developing an<br />
integrated service for all clients needing access to archival<br />
and reference services in the Reading Room in Hobart and<br />
statewide via LINC Online. A web-based online chat service<br />
has been launched to assist clients with their information<br />
and research queries. This service enables clients anywhere<br />
to ask questions and get answers and research guidance in<br />
real-time from information professionals.<br />
National Year<br />
of Reading<br />
2012<br />
National Year of Reading 2012 initiatives encouraged more<br />
Tasmanians to engage with LINC Tasmania and its services<br />
in 2012–13. LINC Tasmania was a founding partner in the<br />
National Year of Reading, a year to celebrate and promote<br />
books, reading and literacy through inspirational programs<br />
and events.<br />
LINCs, branch libraries and the State Library marked the<br />
year with a comprehensive program of statewide events<br />
and activities to support the program’s aims, including:<br />
• National Year of Reading author events held across<br />
the network in the second half of 2012<br />
• hosting the national touring exhibition for ‘Are we there<br />
yet?’, based on Alison Lester’s book of the same title<br />
• Reading Tasmanians: an interpretation exhibition hosted<br />
in the Allport Gallery featuring prints by Tasmanian<br />
printmakers from Hunter Island Press, with works<br />
inspired by Tasmanian literature<br />
• the trial of a Six Book Challenge by LINC Tasmania<br />
in August to December to engage emerging adult<br />
readers in National Year of Reading activities.<br />
Based on a UK program run by the Reading Agency,<br />
the trial ran across the LINC network and with<br />
partner organisations and proved very popular as a<br />
motivation for people trying to build their literacy skills<br />
• the Tasmanian Department of Premier and Cabinet’s<br />
National Year of Reading ‘reading corner’ as part of<br />
its 2012 government show exhibit, which travelled the<br />
show circuit of Burnie, Launceston and Hobart during<br />
October 2012.<br />
LINC Tasmania<br />
53
LINC Online<br />
LINC Online is a core service delivery channel for<br />
LINC Tasmania and is a key enabler for building<br />
community engagement and providing online access to<br />
LINC Tasmania’s collections and services, including the<br />
state’s unique holdings of Tasmanian publications.<br />
A year after its 2011 launch, a reformatted LINC<br />
Online homepage (www.linc.tas.gov.au) went live in<br />
November 2012. Incorporating client feedback, the site<br />
now includes improved search functionality and dynamic<br />
content highlighting events, exhibitions and other<br />
LINC Tasmania services. LINC Tasmania is increasingly<br />
using social media channels to increase discoverability,<br />
client access and engagement with its holdings of digitised<br />
and online resources.<br />
LINC Tasmania has developed a strategy to enhance the<br />
digital literacy skills of its employees. This will enable staff<br />
to support the development of LINC Online and to assist<br />
clients in a rapidly evolving digital environment.<br />
eBooks Plus service<br />
LINC Tasmania’s eBooks Plus service provides a statewide,<br />
fully integrated lending collection of eBooks and eAudio<br />
available 24/7. Launched in November 2010, eBook<br />
issues for 2012–13 reached 62,142, an 82% increase on<br />
2011–12 issues.<br />
eBooks Plus gives clients the ability to download titles<br />
anytime, anywhere; all that is required is an internet<br />
connection and a LINC Tasmania library card. Titles are<br />
automatically returned at the end of the loan period so<br />
there are no late fees or invoices. LINC Tasmania aims<br />
to continue to improve the quality and range of the<br />
eBooks Plus collection and the service delivery to<br />
our clients.<br />
Annual Digitisation Program<br />
It is the strategic aim of LINC Tasmania’s Tasmanian<br />
Archive and Heritage Office (TAHO) Annual Digitisation<br />
Program to make Tasmania’s heritage and archival<br />
collections more accessible.<br />
The program has an annual plan to identify high-demand<br />
material and make it available online. The plan centres<br />
on items that are frequently used by family and local<br />
historians and on photographs, maps and plans of interest<br />
to researchers.<br />
Once scanned, digitised collections can be searched and<br />
accessed through a range of discovery services, including<br />
the online catalogues, nominal and subject indexes,<br />
guides and special pages dedicated to digitised formats<br />
such as films and images. Browsing and searching of<br />
the digitised collections is also available through the<br />
‘Digitised Content’ section of LINC Online.<br />
A total of 100,905 items from the TAHO collection were<br />
proactively digitised during 2012–13. Significant collections<br />
digitised during the year included:<br />
• fifty volumes of nominal immigration records<br />
created by the Immigration Agents Department<br />
and Immigration Board listing assisted and bounty<br />
immigrant arrivals during 1841–1886<br />
• Hobart Gaol Records including photographic records<br />
and descriptions of prisoners 1895–1902 and physical<br />
descriptions of prisoners received 1888–1891<br />
• Royal Derwent Hospital patient case books 1845–1854<br />
• Inward correspondence received by the school<br />
teacher for Cape Barren Island 1929–1935 (includes<br />
police, public health, lands and works, and electoral<br />
records)<br />
• votes and proceedings of the Legislative Council<br />
1837–1855<br />
• Illustrated Tasmanian News 1873–1877<br />
• plans of the Launceston General Hospital<br />
• stills from the film Manganinnie.<br />
Allport Library and Museum of Fine Arts online<br />
In May 2013, LINC Tasmania launched a new<br />
Allport Library and Museum of Fine Arts feature on<br />
LINC Online. This new resource brings together different<br />
aspects of the broad and fascinating content of this unique<br />
Tasmanian collection. A key feature is Gould’s Sketchbook<br />
of Fishes, including an animation of the book, and<br />
information on its inclusion in the Australian Memory of<br />
the World Register. A new Facebook page that provides<br />
event notifications and newsfeeds to clients complements<br />
the website.<br />
54 LINC Tasmania
Tasmanian<br />
Archive and<br />
Heritage<br />
Office<br />
The Tasmanian Archive and Heritage Office (TAHO) is a<br />
key service in the LINC Tasmania Network. TAHO leads<br />
the capture and preservation of Tasmania’s cultural and<br />
documentary heritage to give Tasmanians a greater<br />
understanding of their heritage and the contemporary<br />
issues which may affect them.<br />
Under the leadership of the State Archivist, TAHO also<br />
regulates the creation, preservation and disposition of<br />
Tasmanian state and local government records as required<br />
under the Archives Act 1983.<br />
Collection development<br />
The TAHO collection is the pre-eminent collection<br />
of Tasmania’s documentary heritage and information<br />
resources. Millions of items in many formats make up the<br />
collection, occupying approximately 21 linear kilometres<br />
of shelving. The collection dates from early European<br />
settlement (and pre-settlement exploration) to the<br />
present day and is acquired by legal deposit, transfer from<br />
government agencies, purchase, donation or bequest.<br />
A notable transfer from a state agency in 2012–13 was<br />
a collection of iconic 19 th century charts and maps of<br />
Tasmania from the Department of Primary Industries,<br />
Parks, Water and Environment. These plans and charts<br />
provide a fascinating glimpse into Tasmania’s history and<br />
development.<br />
While state records make up the bulk of the collection,<br />
TAHO also seeks to acquire private records which have<br />
long-term value to the community and best document the<br />
political, social, cultural, economic and natural history of<br />
Tasmania. A total of 62 private deposits were made during<br />
the year to add to the non-government component of<br />
the TAHO collection. Of these, a collection of historical<br />
records relating to the publication of The Mercury and<br />
related Tasmanian newspapers from 1854 onwards, was a<br />
large and significant addition. This collection includes<br />
the complete series of photographic negatives created<br />
by The Mercury and its related publications since 1854,<br />
as well as pictorial and article indexes. Davies Brothers’<br />
decision to transfer the collection to TAHO sees this<br />
valuable collection retained and preserved locally for the<br />
information and use of current and future generations.<br />
Other significant deposits and acquisitions in<br />
2012–13 include:<br />
• records relating to the Lake Pedder Action<br />
Committee<br />
• a collection of 1940’s/50’s photographic slides<br />
(primarily of Hobart, Launceston and Queenstown)<br />
by amateur photographer Jack Wrightson<br />
• Greg Hind glass plate negative collection<br />
• a small collection of early Antarctic novels.<br />
A review of Launceston LINC stack collections began<br />
in June 2011 and was completed in mid-December 2012.<br />
The review included a rigorous assessment by<br />
LINC Tasmania professional staff and has resulted<br />
in enhanced storage and accessibility to valuable<br />
Tasmanian information.<br />
Collection promotion<br />
The range of Theatre Royal items held within TAHO<br />
was showcased this year, enhancing the 175 th anniversary<br />
celebrations of Hobart’s Theatre Royal, Australia’s oldest<br />
working theatre.<br />
The wealth of family history resources available to<br />
Tasmanians and visitors was highlighted through a<br />
contribution to an episode in series five of the<br />
SBS television series ‘Who Do You Think You Are?’.<br />
The Australian actor Lex Marinos paid an extended<br />
visit to TAHO during the filming of the episode.<br />
An exhibition and promotion of TAHO collection material<br />
relating to the North Lyell mine disaster of 1912 was<br />
developed to commemorate the 100 th anniversary and<br />
items were displayed in the Allport Gallery and at the<br />
West Coast Community Hub in Queenstown. The voices<br />
and experiences of the community were remembered<br />
in the exhibition through photographs, film footage and<br />
sound recordings of original letters.<br />
Government recordkeeping<br />
To enable consistent application of good practice in<br />
recordkeeping across state and local government<br />
agencies in accordance with the requirements of the<br />
Archives Act 1983, TAHO provides the Tasmanian<br />
Government with a framework of advices, policy<br />
and guidance to support the creation, disposition<br />
and management of state records.<br />
This year TAHO released nine Information Management<br />
Advices, four State Records Guidelines, and six Records<br />
Disposal Schedules.<br />
During 2012–13, TAHO released a statement clarifying<br />
Tasmanian Government Agency recordkeeping obligations<br />
to the Royal Commission into Institutional Responses to<br />
Instances and Allegations of Child Sexual Abuse in Australia.<br />
The inaugural TAHO Information Manager’s Forum was<br />
conducted in Hobart on 23 November 2012, attracting<br />
50 attendees from state and local government agencies<br />
and the private sector.<br />
LINC Tasmania<br />
55
Community<br />
learning<br />
Comprising the Work and Life Skills and the<br />
Leisure and Lifestyle programs, community learning<br />
delivers a range of learning programs in LINCs, libraries,<br />
online access centres and other facilities – that aim to<br />
develop the social, cultural, intellectual and economic<br />
potential of individuals and the broader Tasmanian<br />
community.<br />
Responding to the recommendations of the Review of the<br />
Role and Function of Tasmania’s Public VET Providers in 2012,<br />
LINC Tasmania continued to operate as a gateway for<br />
adults into vocational education and training (VET) and<br />
other educational pathways.<br />
Through the Work and Life Skills program, LINC Tasmania:<br />
• ensured that programs gave priority to adults pursuing<br />
qualifications for work<br />
• strengthened relationships with registered training<br />
organisations<br />
• provided access and support to adults requiring<br />
foundation skills in their pathways to formal education,<br />
training and employment<br />
• provided learning opportunities as a means of<br />
enriching everyday life.<br />
LINC Tasmania provides accredited training in partnership<br />
with registered training organisations (RTOs), informal<br />
learning opportunities, and non-accredited courses.<br />
During 2012–13 there were 9,619 unit enrolments in<br />
education and training programs offered in LINC sites,<br />
exceeding the annual target of 8,250 by 17%.<br />
LINC Tasmania has developed partnerships with the<br />
Tasmanian Polytechnic, University of Tasmania (UTAS) and<br />
other RTOs to promote and support learning, particularly<br />
in regional and rural locations, and to strengthen formal<br />
learning pathways.<br />
Learner support is being provided to an increasing<br />
number of clients through a trained volunteer program.<br />
Under a trial arrangement with UTAS, LINC Tasmania<br />
staff and volunteers in regional LINCs provide support to<br />
participants in the University Preparation Program (UPP).<br />
The trial will be evaluated in December 2013.<br />
Leisure and Lifestyle courses continued to experience<br />
a downward trend in enrolments, putting increased<br />
pressure on the viability of the program. Significant<br />
re-engineering has been undertaken to align service<br />
delivery with the needs of communities and the<br />
government’s priorities, with Leisure and Lifestyle<br />
programs being offered on a full cost-recovery basis<br />
from August 2011. LINC Tasmania continues to look<br />
for more efficient ways to provide these types of<br />
courses in the face of increasing competition from a<br />
range of other providers.<br />
56 LINC Tasmania
Performance<br />
LINC Tasmania achieved 92% of its target for library issues<br />
in 2012–13, with a decline in borrowing of 5.5% over the<br />
previous year. The last major increase in library issues<br />
occurred in the period 2007–2009, following a boost to<br />
lending collections through a one-off increase in funding<br />
of $1.75 million over three years (2003–04 to 2006–07).<br />
With a static bookvote (library acquisition fund) allocation<br />
for the last 12 years and an increasingly diverse range of<br />
demands on the fund (e.g. literacy support, online services,<br />
eBooks), it is unlikely that library issues will increase unless<br />
more variety can be offered to clients.<br />
Total physical visitor numbers to LINC Tasmania sites<br />
in the 2012–13 financial year were higher than 2011–12<br />
numbers. However, visitor numbers were 5% or 170,147<br />
visitors short of the 2012–13 annual target of 3,320,000.<br />
Generally visits to LINC Online www.linc.tas.gov.au<br />
remain steady. The reported decline in visits against<br />
the 2012–13 target reflects a change in the way<br />
LINC Tasmania’s statistical tool, Google analytics,<br />
counts visits.<br />
In 2012–13 there were 9,619 unit enrolments in education<br />
and training programs offered in LINCs. The informal and<br />
formal opportunities to develop skills leading to purposeful<br />
pathways have continued to grow from a base of 5,625<br />
enrolments in 2009–10 and represent an increasing focus<br />
of LINC Tasmania activity.<br />
Leisure and Lifestyle program enrolments have been<br />
decreasing for a number of years. Changing demographics,<br />
competition from low cost and other providers, a difficult<br />
financial climate, and increased fees, are all contributing<br />
to the decline. The department continues to explore<br />
strategies to improve the viability of the program.<br />
In 2012–13, LINC Tasmania provided literacy support to<br />
863 adult Tasmanians, reaching 52% of its performance<br />
target for the financial year. Of these, 193 clients (22%)<br />
increased at least one level in one skill on the Australian<br />
Core Skills Framework (ACSF), 206 clients (24%) moved<br />
on to further education or training, 75 (9%) commenced<br />
paid employment, and 22 (3%) took up volunteer or<br />
unpaid work.<br />
LINC Tasmania’s Literacy Skills Development Program<br />
supported the delivery of 63 projects in 2012–13 involving<br />
the provision of learning opportunities to a total of 1,006<br />
participants – an increase of 129% on the previous year.<br />
A total of 180,882 Tasmanian library and archival items<br />
have been made newly available this last financial year,<br />
which is more than quadruple the target of 40,000.<br />
This figure includes new acquisitions (purchase and legal<br />
deposit) and completed transfers of Tasmanian records,<br />
as well as retrospective data entry. The increase in<br />
2012–13 is attributed to the import of a large amount<br />
of data describing Public Works Department drawings.<br />
At the end of June 2013, the archives database provided<br />
access to 2,984,087 items.<br />
In 2012–13, LINC Tasmania saw a significant increase<br />
in the number of images produced from the proactive<br />
Annual Digitisation Program. This is largely attributed to<br />
the productive partnership between LINC Tasmania<br />
and Family Search volunteers. The production of images<br />
on demand in response to digital orders has reduced,<br />
enabling resources to be directed towards proactive<br />
digitisation. As of the end of the 2012–13, 236,242 heritage<br />
items were available via LINC Online in a digital format.<br />
Although 100,905 items were digitised during this period,<br />
the majority of these items will become publically available<br />
in 2013–14, allowing for various data and quality assurance<br />
processes to be undertaken.<br />
Performance measure 2010–11 2011–12 2012–13<br />
Target<br />
2012–13<br />
% of<br />
Target<br />
reached<br />
Number of in-person visits to LINCs (all LINC Tasmania) 3,354,483 3,075,654 3,149,853 3,320,000 95%<br />
Number of visits to LINC Online 2,787,583 2,377,201 2,519,306 3,150,000 80%<br />
Number of people accessing education and<br />
training programs (number of enrolments):<br />
Work and Life Skills 6,754 9,095 9,619 8,250 117%<br />
Leisure and Lifestyle 1 15,080 5,413 3,319 11,000 30%<br />
Library items issues (including eBook issues) 5,015,518 4,755,821 2 4,494,194 4,900,000 92%<br />
Number of people accessing literacy<br />
support services through LINCs<br />
500 988 863 1,660 52%<br />
Number of volunteer hours contributed to LINC services 94,396 101,015 112,517 94,000 120%<br />
Number of Tasmanian items newly available 47,320 92,416 180,882 40,000 452%<br />
Number of heritage documents and artefacts<br />
publicly available in digital format<br />
201,722 211,525 236,242 300,000 79%<br />
1. The Leisure and Lifestyle program commenced operating on a full cost-recovery basis from 20 August 2011. The 2012–13 target reflects the number of<br />
enrolments required to achieve full cost-recovery.<br />
2. This is an amended figure. A data error saw this figure reported in the 2011–12 annual report as 4,814,947.<br />
LINC Tasmania<br />
57
58 LINC Tasmania
Required Reporting
Employment<br />
Workforce in<br />
summary<br />
The Department of <strong>Education</strong> has approximately 13,700<br />
full-time, part-time and casual staff working in locations<br />
throughout Tasmania undertaking a wide range of duties.<br />
Human Resources Services and Employee Relations units<br />
provide human resource consultancy services, advice and<br />
develop systems that enable employees and managers to<br />
achieve the department’s outcomes.<br />
Employment<br />
status<br />
Full-time equivalents (FTE) 1 Number 2<br />
Employment status Female Male Total Female Male Total<br />
Full-time fixed term 290.70 130.10 420.80 293 132 425<br />
Full-time permanent 2,972.46 1,638.27 4,610.73 2,984 1,642 4,626<br />
Part-time fixed term 454.45 132.79 587.24 878 258 1,136<br />
Part-time permanent 2,257.05 350.98 2,608.03 3,720 538 4,258<br />
Total 5,974.66 2,252.14 8,226.80 7,875 2,570 10,445<br />
1. Where staff proceed on unpaid leave (i.e. maternity leave without pay, sick leave without pay, leave without pay) as at the reporting date the FTE will be<br />
reduced accordingly. The paid FTE figures reported for the last pay in June 2013 are higher than in 2012 as all staff received full salary compared to 2012<br />
when the Term 2 school holidays impacted on the paid FTE (i.e. in 2012 a number of employees do not receive salary of 8 days) but this is not the case in<br />
2013 as the 4 term school year results in different holiday periods.<br />
2. These figures do not include casual staff working in the department.<br />
60 Required Reporting » Employment
Staff<br />
employed<br />
as at 30 June 2013<br />
Services 1,2 FTE Number<br />
Early Years and Schools Division<br />
Primary schools 3,144.61 4,209<br />
Combined schools 809.44 1,055<br />
Secondary schools 1,627.68 1,931<br />
Senior secondary schools 757.87 934<br />
Special schools 203.61 302<br />
Learning Services North-West 3 60.60 72<br />
Learning Services North 3 62.65 76<br />
Learning Services South 3 107.85 139<br />
Office of the Deputy Secretary Early Years and Schools 25.50 26<br />
Office of the General Manager Early Years and Schools 3 131.65 157<br />
<strong>Education</strong>al Performance Services 30.20 32<br />
Pathways and Participation 48.83 55<br />
Professional Learning Institute 9.80 10<br />
Strategic Policy and Planning 3.80 4<br />
Further <strong>Education</strong> and Training Division<br />
Government <strong>Education</strong> and Training International 13.81 16<br />
LINC Tasmania 275.33 383<br />
Office of the Deputy Secretary Further <strong>Education</strong> and Training 10.20 10<br />
Tasmanian Polytechnic 513.09 615<br />
Corporate Services Division<br />
Communication Services 4.40 5<br />
Employee Relations 26.64 29<br />
Facility Services 106.48 117<br />
Finance and Business Services 49.18 53<br />
Human Resources Services 47.67 51<br />
Information and Technology Services 129.71 135<br />
Marketing Services 5.80 8<br />
Office of the Deputy Secretary Corporate Services 3.00 3<br />
Office of the Secretary<br />
Internal Audit 5.80 6<br />
Legal Services 2.00 2<br />
Ministerial Services 7.60 8<br />
Office of the Secretary 2.00 2<br />
Total 8,226.80 10,445 4<br />
1. As per the department’s organisation chart as at 30 June 2013.<br />
2. Detailed information on these services and related business units is provided in the ‘Department at a Glance’ chapter.<br />
3. A number of business units that previously reported to General Managers in the three Learning Services now report to the General Manager<br />
Early Years and Schools, as of January 2013.<br />
4. The total number of staff is exclusive of the following statutory authorities counted in annual reports prior to 2011–12: Skills Tasmania,<br />
Tasmanian Qualifications Authority (TQA) and the Teachers Registration Board (TRB).<br />
Required Reporting » Employment<br />
61
Teachers (Includes all schools and Polytechnic)<br />
Teachers<br />
employed<br />
Position FTE Number<br />
Base grade teachers 3,801.39 4,668<br />
Advanced skills teachers 524.99 557<br />
Principals and assistant principals 497.45 493<br />
Total 4,823.83 5,718<br />
Employment<br />
status of<br />
teachers<br />
Employment status Average age Number<br />
Female<br />
Full-time fixed term 33.84 189<br />
Full-time permanent 45.70 2,105<br />
Part-time fixed term 42.27 278<br />
Part-time permanent 46.31 1,633<br />
All female 45.18 4,205<br />
Male<br />
Full-time fixed term 36.35 86<br />
Full-time permanent 45.43 1,042<br />
Part-time fixed term 40.96 117<br />
Part-time permanent 46.36 268<br />
All male 44.76 1,513<br />
All teachers 45.07 5,718<br />
Average age<br />
of teachers<br />
2011 2012 2013<br />
Position F M F M F M<br />
Base grade teachers 44.0 44.1 44.6 44.1 44.57 44.39<br />
Advanced skills teachers 46.9 45.8 47.3 45.6 46.87 46.79<br />
Principals and assistant principals 50.5 49.6 49.9 49.5 50.03 49.60<br />
Age<br />
distribution<br />
of principals<br />
and assistant<br />
principals<br />
Age group Number<br />
25–29 3<br />
30–34 22<br />
35–39 27<br />
40–44 58<br />
Gender<br />
distribution<br />
in promoted<br />
positions<br />
Position F M Total<br />
Advanced skills teachers 374 183 557<br />
Principals and assistant principals 306 187 493<br />
Total 680 370 1,050<br />
45–49 66<br />
50–54 158<br />
55–59 134<br />
60–64 20<br />
65+ 5<br />
Total 493<br />
Qualifications of teachers and other professional staff 1<br />
Percentage of teachers and other professional staff who were four or five-year trained (based on the total number of<br />
base grade staff):<br />
2011 2012 2013<br />
4 year-trained 78% 77% 76%<br />
5 year-trained 18% 19% 20%<br />
1. This figure does not include Polytechnic teachers.<br />
62 Required Reporting » Employment
General workforce recruitment (Includes all schools and Polytechnic)<br />
Advertising<br />
and filling of<br />
2010–11 2011–12 2012–13<br />
Permanent jobs that were advertised 360 1 378 396<br />
Permanent jobs that were advertised and filled 401 1 349 297<br />
Permanent jobs that were advertised and filled<br />
by staff from within the department<br />
Permanent jobs that were advertised and filled by people<br />
outside the department but within the state public service<br />
Permanent jobs that were advertised and filled by<br />
people outside the state public service<br />
323 294 255<br />
12 9 10<br />
66 46 32<br />
jobs 1 2010–11 2011–12 2012–13<br />
1. Variation due to jobs being filled that were advertised late in the preceding reporting period.<br />
Appointment<br />
of part-time<br />
employees<br />
Part-time positions advertised 288 182 141<br />
Full-time employees who reduced their hours to part-time 391 351 546<br />
Part-time employees 5,593 5,244 5,394<br />
Separations<br />
2010–11 2011–12 2012–13<br />
Permanent employees who resigned from jobs 95 109 135<br />
Permanent employees who retired from jobs 230 203 334<br />
Secondments<br />
and interagency<br />
transfer<br />
2010–11 2011–12 2012–13<br />
Employees who participated in secondment 25 19 18<br />
Employees who participated in inter-agency transfer 25 9 21<br />
Appointment<br />
of permanent<br />
grade<br />
teachers<br />
Calendar year<br />
New graduates appointed<br />
through scholarship program<br />
Appointments through<br />
merit application<br />
Conversions to<br />
permanent status<br />
2010 18 70 183<br />
2011 24 40 118<br />
2012 22 16 122<br />
2013 (to 30 June) 19 9 164<br />
Teaching<br />
workforce<br />
recruitment<br />
Teachers employed as graduates in the department have<br />
graduated from university within the preceding 12 month<br />
period. In 2013, 19 graduates of the Partnerships in Teaching<br />
Excellence (PiTE) scholarship program began their teaching<br />
appointments in January 2013. One participant with a<br />
unit to complete this year has been placed in Term 2.<br />
One pre-service teacher from 2012 is completing their<br />
degree in the second half of this year, and one participant<br />
took up a position in a non-government school.<br />
In addition to the 16 PiTE graduates appointed in 2013,<br />
a further 82 UTAS 2012 graduates have been employed<br />
primarily through fixed-term arrangements in schools.<br />
These include 22 in the south of the state, 27 in the north,<br />
and 33 in the north-west.<br />
The 2013 PiTE program currently has 16 pre-service<br />
teachers in the group, comprised of 11 Master of Teaching<br />
students (one completing from 2012) and five Bachelor of<br />
<strong>Education</strong> students. This year, five pre-service teachers are<br />
from the north-west of the state, four from the north and<br />
seven from the south.<br />
The Graduate Recruitment Program and the Maths/Science<br />
HELP Scholarships are no longer operating as separate<br />
recruitment programs. Both of these programs have<br />
merged with the PiTE program, which is currently the<br />
department’s key graduate recruitment initiative.<br />
Required Reporting » Employment<br />
63
Workplace diversity programs<br />
Workplace diversity is well established within the<br />
department’s culture and management systems. Initiatives<br />
align with the key drivers of the department's Learners<br />
First Strategy – ‘an innovative workforce’ and ‘inspired<br />
leadership’. Workplace diversity strategies are aligned with<br />
planning and implementation activities within frontline<br />
service delivery areas and are drawn together through the<br />
overarching Workplace Diversity Program 2008–2012.<br />
A formal review of the department’s Workplace Diversity<br />
Program (WDP) was postponed pending a review of<br />
Commissioner’s Directions No. 3 (CD3). In March 2013,<br />
CD3 was reissued as Employment Direction No. 3<br />
without significant change. A departmental working group<br />
will be convened in late 2013 to undertake a formal review<br />
of program goals, strategies and initiatives.<br />
The program focuses on the following goals with some<br />
achievements highlighted below:<br />
Goal 1: Fair treatment and removal of barriers<br />
Workplace diversity, cultural awareness and anti-bullying<br />
and harassment training for new and existing managers<br />
and staff continues to be provided across the department.<br />
An information session is available to all managers and new<br />
employees as part of the online induction manual.<br />
Promotion of the Workplace Flexibility Arrangement Policy,<br />
the Right to Request parental leave provisions and the State<br />
Service Purchased Leave Scheme is ongoing.<br />
Goal 2: Implementation of special initiatives to<br />
achieve a workforce that is representative of<br />
the community it serves<br />
The Partnerships in Teaching Excellence scholarship program<br />
continues to offer specific opportunities for pre-service<br />
teachers who identify as Aboriginal and Torres Strait<br />
Islanders.<br />
A specific scholarship place for pre-service teachers with<br />
a disability was also introduced in 2011.<br />
Goal 3: Recognition of the diversity available<br />
in the workplace<br />
In accordance with the requirements of Employment<br />
Direction No. 26, the department developed a new<br />
Performance and Development Framework which was<br />
launched in September 2012. The framework allows for<br />
Performance and Development Plans to be tailored to the<br />
individual needs and learning styles of employees.<br />
Employee participation in industrial relations matters<br />
Unions and employees were represented on a range of<br />
departmental consultative committees and processes<br />
relating to professional, industrial and operational matters.<br />
The following agreements were negotiated and approved<br />
by the Tasmanian Industrial Commission:<br />
• Teaching Service (Tasmanian Public Sector) Salaries<br />
and Conditions of Employment Agreement 2012<br />
• Polytechnic and Skills Institute Teaching Staff Industrial<br />
Agreement 2012<br />
• Teaching Service (Tasmanian Public Sector) Principals<br />
Agreement 2013.<br />
Employees and unions were consulted regularly to ensure<br />
employees were fully informed on these matters as they<br />
progressed.<br />
64 Required Reporting » Employment
Internal grievances procedures<br />
Published grievance procedures were available to<br />
employees. During 2012–13, four new grievance cases<br />
were submitted to the Conduct and Investigations<br />
Unit of the Human Resources Management Branch.<br />
As at 30 June 2013, one case was still being resolved.<br />
The Conduct and Investigations Unit managed the process<br />
of good character clearances for schools and other<br />
areas of the department, together with safety screening<br />
applications for the childcare industry.<br />
Occupational health and safety<br />
The department proactively applied strategies aimed at<br />
preventing, mitigating and reducing workplace related<br />
injuries. A strong emphasis was also placed on rehabilitation,<br />
which included assisting stafff to return to work in the<br />
shortest possible time.<br />
Key statistics for workplace health, safety and welfare,<br />
and workers compensation for the reporting year were as<br />
follows – a total of 574 compensation claims were received<br />
for the year 2012–13, which is an increase on the previous<br />
two years.<br />
Occupational<br />
health, safety<br />
and welfare<br />
and workers<br />
compensation<br />
Number of claims<br />
Referrals for rehabilitation<br />
Injury type 2010–11 2011–12 2012–13 2010–11 2011–12 2012–13<br />
Back 82 74 74 29 18 16<br />
Head 43 44 54 5 4 3<br />
Lower limbs 113 130 130 25 22 27<br />
Multiple 27 65 85 7 13 24<br />
Neck 15 6 6 3 2 1<br />
Shoulder 37 41 24 22 12 11<br />
Stress 60 53 73 36 32 57<br />
Systemic 10 5 3 2 - 1<br />
Trunk 22 16 13 9 3 3<br />
Upper limbs 97 116 112 21 22 26<br />
Total 506 550 574 159 128 169<br />
Health and wellbeing programs<br />
The department is committed to supporting the<br />
improved health and wellbeing of all employees and has<br />
a range of policies and programs in place that relate to<br />
work, life and diversity; and work health and safety.<br />
In 2011, the department established the<br />
Healthy@Work Steering Committee comprising of<br />
employee representatives from key organisational units.<br />
The main function of the committee is to provide advice,<br />
support and assistance in the implementation of the<br />
department’s health and wellbeing program and its<br />
related activities.<br />
Surveys of staff in 2010 (undertaken by the Menzies<br />
Research Institute and the Public Sector Management<br />
Office) highlighted physical activity, nutrition and stress<br />
as being of particular concern for staff in relation to their<br />
health and wellbeing.<br />
In considering these results, and accordance with<br />
Employment Direction No. 23: Workplace Health and<br />
Wellbeing, the department launched the Healthy@Work –<br />
Health and Wellbeing Plan in July 2011.<br />
This plan represents the department's strong commitment<br />
to support all staff in improving their health and<br />
wellbeing across key aspects of their lives. The plan has<br />
been designed as a framework that allows individual<br />
work groups to expand and develop their own strategies,<br />
initiatives and actions. The key goals of the plan are to:<br />
• improve physical activity<br />
• improve nutrition<br />
• reduce psychological distress.<br />
The following initiatives and activities have been<br />
implemented in the past 12 months:<br />
Required Reporting » Employment<br />
65
The Global<br />
Corporate<br />
Challenge<br />
(GCC)<br />
The department provided a 50% subsidy for 602 staff<br />
(86 teams) to participate in a 16 week physical activity<br />
challenge commencing on 23 May 2013 and concluding<br />
on 12 September 2013. This is the largest ever number<br />
of department employees participating in the program.<br />
Participants use the technology provided to detect<br />
movements every day during the 16 week challenge and<br />
enter their steps or activity (such as cycling or swimming)<br />
in the GCC web portal. The aim of the challenge is<br />
for participants to do 10,000 steps a day which is the<br />
recommended daily average set by the World Health<br />
Organisation for a lifestyle to be considered active.<br />
Participants also receive access to the GCC website for<br />
12 months which provides valuable information on healthy<br />
eating, physical activity and general health and wellbeing.<br />
Bupa<br />
Corporate<br />
Health Plan,<br />
Health Kiosks<br />
and Site Visits<br />
The department has an agreement with Bupa to offer a<br />
Corporate Health Cover Plan to all employees. This plan<br />
provides staff, who elect to join, with a corporate rate<br />
of private health cover and access to a range of member<br />
benefits. Bupa is provided with access to worksites to<br />
provide information sessions to staff about the plan as<br />
well as occasional additional services such as ‘health kiosk’<br />
individual health assessments. Some 17 site visits were<br />
conducted around the state in this reporting period.<br />
The Bupa arrangement provides the opportunity for the<br />
department to access 1% of all contributions via a wellness<br />
fund that can be used to purchase Bupa health and<br />
wellbeing programs and activities.<br />
Employee<br />
Assistance<br />
Program<br />
(EAP)<br />
Positive Solutions (the department’s EAP provider)<br />
conducted awareness sessions across the state at the<br />
request of individual workplaces. It was found that<br />
where the session was requested, the workplace<br />
sometimes required onsite follow-up counselling or a<br />
group facilitation session.<br />
Flu<br />
vaccination<br />
program<br />
The department once again offered a free influenza<br />
vaccination program to all staff and a total of 4,584<br />
employees were vaccinated at 183 sites across Tasmania.<br />
This represents an increase of 15% in the number of staff<br />
vaccinated in the previous reporting period.<br />
Intranet<br />
resources<br />
The department’s ‘Healthy@Work’ Intranet page was<br />
redesigned providing access to a diverse range of health<br />
and wellbeing related resources to all staff.<br />
Workplace<br />
Toolkit<br />
Skills Tasmania, LINC Tasmania, the Polytechnic,<br />
Dodges Ferry Primary School and Norwood Primary<br />
School participated in the pilot program for the<br />
development of the Healthy Workers Toolkit Project in<br />
partnership with Population Health – Department of<br />
Health and Human Services. The toolkit will be launched<br />
across the department later in 2013.<br />
66 Required Reporting » Employment
Employee Performance and Development Programs<br />
This section describes the department-wide approach to managing performance and the provision of professional learning.<br />
Performance management<br />
The State Service Amendment (Performance) Act 2011, and<br />
Employment Direction No 26: Managing Performance<br />
in the State Service, require all agencies to implement a<br />
performance management system to facilitate the effective<br />
performance of employees.<br />
Throughout 2012, significant work was undertaken to<br />
develop a new performance management framework<br />
to replace the previously diverse range of performance<br />
management systems which had been in operation across<br />
the department since 2010. The new framework has<br />
been designed to ensure a consistency of approach to<br />
performance management throughout the department,<br />
and to ensure a structured and formal approach to<br />
performance management which fulfils all requirements<br />
of the Act and the Employment Direction.<br />
The new framework was established following an<br />
extensive consultation process. Reference groups<br />
incorporating school principals, K–12 teachers, school<br />
executive officers, Polytechnic staff and all non-school<br />
workplaces were conducted around the state.<br />
The Australian <strong>Education</strong> Union, Community and<br />
Public Sector Union, United Voice and Tasmanian Principals<br />
Association were also consulted throughout<br />
the development of the new arrangements.<br />
In September 2012, the department introduced the<br />
Performance and Development Framework, with formal<br />
implementation commencing in January 2013 following<br />
extensive communication to employees and the provision<br />
of formal training to managers.<br />
The Performance and Development Framework applies to all<br />
permanent employees (teaching and non-teaching) and<br />
all fixed-term non-teaching employees employed for a<br />
period greater than six months. Separate performance<br />
management arrangements apply to fixed-term teaching<br />
staff and probationary employees.<br />
The Performance and Development Framework includes a<br />
formal Policy, Performance and Development Procedure<br />
and Managing Underperformance Procedure. The key<br />
features of the framework include:<br />
• establishment of strong linkages and alignment<br />
between departmental strategic drivers and values,<br />
school and workplace improvement priorities and<br />
individual employee goals<br />
• the requirement for every employee to participate<br />
in formal performance management discussions with<br />
their manager to establish performance improvement<br />
goals, outcomes and measures of success, and<br />
professional development goals<br />
• documentation of the agreed outcomes of these<br />
discussions in the form of a Performance and<br />
Development Plan (PDP)<br />
• formal assessment of performance annually against a<br />
three-tier assessment model<br />
• early intervention and structured management of<br />
underperformance<br />
• alignment with the Australian Professional Standards<br />
for Teachers as the benchmark standard for teacher<br />
performance<br />
• introduction of Capability and Values Profiles and<br />
professional standards as the basis for establishing<br />
improvement goals and assessing performance.<br />
The department's Learners First Strategy provides<br />
the strong foundation for the new Performance and<br />
Development Framework. The key strategic drivers of ‘an<br />
innovative workforce’ and ‘inspired leadership’ provide the<br />
links to the new performance management arrangements,<br />
where the focus is on supporting a culture of effective<br />
performance and continuous improvement.<br />
The new performance management arrangements are<br />
also strongly linked to the department’s values of learning,<br />
excellence, equity, respect and relationships. The values<br />
are an integral part of the performance conversations<br />
and goal setting, and the values are directly reflected in<br />
the Capability and Values Framework and the professional<br />
standards that have been developed to support the new<br />
performance management arrangements.<br />
The performance management arrangements also create a<br />
strong alignment with the State Service Code of Conduct<br />
and State Service Principles. Employee responsibilities in<br />
accordance with these requirements and principles are<br />
an inherent part of the framework, and the Capability and<br />
Values Framework ensuring all employees are aware of, and<br />
assessed against, these responsibilities.<br />
The Australian Professional Standards for Teachers form<br />
the foundation for the establishment of performance<br />
improvement goals and assessment for teaching staff.<br />
The focus of performance management for teachers is on<br />
improving the overall quality of the teaching in Tasmanian<br />
schools and these professional standards describe the core<br />
aspects of quality teaching. The department’s Professional<br />
Learning Institute has a key ongoing role in delivering<br />
on identified professional learning needs to enhance<br />
quality teaching.<br />
For non-teaching staff, a Capability and Values Framework has<br />
been developed. This framework describes the standard<br />
of work and behaviour required at each classification level<br />
and for each type of work, and includes separate profiles<br />
for each Tasmanian State Service award classification band<br />
and for education facility attendants. This framework has<br />
been further expanded to include a range of professional<br />
standards and capability profiles for school psychologists,<br />
speech and language pathologists and social workers, which<br />
describe the standards of professional practice required of<br />
employees in these professional roles.<br />
The introduction of the framework has been supported by<br />
formal structured training for all managers, online training<br />
for employees and significant ongoing implementation<br />
support.<br />
Formal workshops have been delivered for all managers<br />
responsible for leading performance conversations<br />
and developing PDP’s with employees. The workshops<br />
were designed to ensure all managers became familiar<br />
with the new arrangements and to provide them with<br />
the knowledge and skills to effectively undertake their<br />
performance management responsibilities. These<br />
workshops were designed and delivered in conjunction<br />
Required Reporting » Employee Performance and Development Programs<br />
67
with Frameworks for Change, engaged through The Training Consortium. Workshops were tailored to meet the needs of<br />
the variety of different workplaces across the department. Specific workshops were designed and delivered for school<br />
principals and senior school leaders, school executive officers, Corporate Services Division managers, LINC managers,<br />
Polytechnic managers, speech and language pathology seniors, senior school psychologists and senior social workers.<br />
Between September 2012 and March 2013, a total of 52 workshops were delivered and total of 1,283 managers<br />
participated – as follows:<br />
Workshop audience<br />
Number of<br />
workshops<br />
Number of<br />
participants<br />
Principals/school leaders – south 10 276<br />
Principals/school leaders – north 6 245<br />
Principals/school leaders – north-west 6 145<br />
School executive officers 17 303<br />
Corporate Services managers 4 63<br />
LINC managers 3 60<br />
Polytechnic managers 4 66<br />
Mixed (mixed groups of managers from above groups, Early Years and Schools Division,<br />
Skills Tasmania, TQA and TRB).<br />
5 105<br />
Social work, speech and language pathology and school psychology seniors 2 20<br />
Principal network leaders have worked closely with<br />
principals across their networks to support the<br />
implementation of the Performance and Development<br />
Framework requirements and the alignment of the<br />
framework with school improvement planning and<br />
processes.<br />
Employees across schools and non-school workplaces have<br />
been provided with support and training to ensure their<br />
full and effective participation in the new performance<br />
management arrangements. Schools and workplaces have<br />
provided information and briefings to employees about<br />
the new arrangements. Data collected indicates over<br />
9,000 employees have been involved in these workplace<br />
familiarisation sessions.<br />
In addition, an online training module for employees was<br />
implemented in March 2013. The module is available to all<br />
employees and is designed for individual access, or to be<br />
used for a facilitated group discussion. The module provides<br />
a training path specific to each employment category,<br />
and takes employees through the PDP process with a focus<br />
on building confidence to prepare for and participate in the<br />
development of their PDP.<br />
Since implementation, the module has been accessed by<br />
2,198 individual employees, as well as being utilised by<br />
managers to introduce the new arrangements to their<br />
employees.<br />
The implementation target for the first year of the<br />
Performance and Development Framework was to ensure that<br />
all relevant employees had a PDP in place by 30 June 2013.<br />
This target has been achieved, with 98% of employees<br />
having a PDP in place at 30 June 2013. The majority of the<br />
remaining 2% are employees who are on long-term leave.<br />
Limited information regarding employee perceptions of<br />
the Performance and Development Framework has been<br />
obtained through the results of the Tasmanian State Service<br />
Workforce Survey. The survey was conducted during the<br />
implementation period and therefore not all employees<br />
had engaged in the PDP conversations with their manager<br />
at that stage. School-based employees did not participate<br />
in this survey and therefore only limited conclusions can be<br />
drawn from the results.<br />
The survey results were generally positive in respect of the<br />
Performance and Development Framework, even at this early<br />
stage. Results showed that 62% of respondents understand<br />
how the department’s performance management<br />
arrangements work. Approximately 70% of respondents<br />
agreed that the conversations they have with their<br />
manager provide constructive suggestions to improve their<br />
performance, and that they are able to raise any concerns<br />
they have about their performance with their manager.<br />
The results also showed a significant improvement on<br />
earlier survey results:<br />
• Approximately 20% more respondents agreed<br />
that performance reviews are focused on business<br />
outcomes compared to the 2011 survey. In addition,<br />
approximately 70% of respondents agreed that<br />
managers clearly communicate the goals and<br />
priorities of the organisation, compared to 58% in the<br />
2011 survey.<br />
• A positive aspect of the results was the high proportion<br />
of respondents who reported a good understanding of<br />
the skills and capabilities required of their role (86%),<br />
the ethical standards required of them (86%), and<br />
knowledge of the Code of Conduct (82%). In addition,<br />
62% of respondents agreed that the performance<br />
management system reinforces the State Service<br />
Principles, and the departmental values.<br />
• One of the negative aspects of the survey results<br />
was that only 36% of respondents considered that<br />
underperforming employees were managed well.<br />
This result should improve as awareness and utilisation<br />
of the managing underperformance procedures<br />
continues to grow.<br />
Overall, the survey results of employee perceptions provide<br />
an early indication that the Performance and Development<br />
Framework is providing employees with a positive<br />
opportunity to work with their manager to improve<br />
performance, and is establishing high levels of understanding<br />
of appropriate ethical and conduct standards.<br />
68 Required Reporting » Employee Performance and Development Programs
Professional learning<br />
The programs described in this section relate to the<br />
department-wide provision of professional learning.<br />
Further professional learning occurs within individual<br />
business units and schools.<br />
Responsibility and funding for the delivery of professional<br />
learning is devolved across the department. Professional<br />
learning for school-based employees is accessed through<br />
the School Resource Package. For other non-school<br />
employees, professional learning is funded within business<br />
unit budget allocations.<br />
Professional<br />
Learning<br />
Institute<br />
The Professional Learning Institute (PLI) is responsible<br />
for high quality professional learning for the department.<br />
PLI staff are developing, brokering and delivering<br />
professional learning and support to schools and increasingly<br />
supporting professional learning across the department.<br />
Professional learning programs for teachers and principals<br />
are based on the Australian Standard for Principals and<br />
Australian Standards for Teachers. Other policies, guidelines<br />
and frameworks such as the Melbourne Declaration on<br />
<strong>Education</strong>al Goals for Young Australians, the department's<br />
Learners First Strategy and the department’s Literacy and<br />
Numeracy Framework underpin professional learning for<br />
principals and teachers. Programs that focus on Aboriginal<br />
<strong>Education</strong> and that specifically address Standards 1.4 and 2.4<br />
have also been developed and delivered.<br />
The PLI delivers leadership programs for experienced<br />
and aspiring principals such as Leadership Starts from Within,<br />
Leading Teaching and Learning and Empowering Diversity.<br />
The Shadowing Program is an intensive spaced learning<br />
experience designed for aspiring principals.<br />
The Leadership Development Program was developed<br />
for principals new to a school.<br />
The Principals as Literacy Leaders (PALL) and Secondary<br />
Principals as Literacy Leaders (SPALL) programs support<br />
literacy leadership in schools. Other programs offered by<br />
the PLI that support literacy and numeracy teaching and<br />
learning include:<br />
• Secondary Schools Literacy Focus<br />
• Literacy for Learning Program<br />
• Peter Sullivan Numeracy Initiative<br />
• Network Inquiries that enable networks of schools to<br />
undertake a literacy and numeracy inquiry.<br />
Working with Data is a program offered by the PLI and<br />
co-facilitated with <strong>Education</strong>al Performance Services.<br />
This two staged program provides professional learning<br />
on how the department’s NAPLAN Toolkit can support<br />
school leaders and teachers to maximise the use of their<br />
data, and how to use data to inform school improvement.<br />
Many PLI programs incorporate the use of information<br />
technology to facilitate coaching, feedback on inquiries<br />
and engaging with international experts. Specific coaching<br />
programs are conducted and coaching is the main driver<br />
of Building Feedback Cultures which is being conducted in<br />
over 40 schools. The Adaptive Schools Program, designed<br />
to equip participants with an understanding of the<br />
complexity of working in a team, is also based on coaching<br />
principles. The six day spaced learning program, Leading a<br />
Digital School and the 21st Century Learning Design (21CLD)<br />
program are specific programs based on the use of<br />
information technology.<br />
Induction programs for beginning staff across the<br />
department are being co-constructed with the PLI and<br />
Corporate Services.<br />
Professional<br />
learning<br />
support<br />
for school<br />
administration<br />
staff<br />
School administration staff receive a range of professional<br />
learning support:<br />
• the Corporate Service Centre offers direct and online<br />
training and support for school administration staff<br />
• programs specifically designed for Corporate Service<br />
staff have been developed<br />
• the department provides sponsorship to the<br />
Tasmanian Schools Administrator Association (TSAA)<br />
Conference held in July/August each year<br />
• a pilot program for school administrative staff was<br />
conducted in the Learning Services North-West<br />
region in the first half of 2013 and will be further<br />
developed and made available across the state.<br />
Required Reporting » Employee Performance and Development Programs<br />
69
Ethical<br />
conduct<br />
training<br />
Section 32 of the Integrity Commission Act 2009 requires<br />
all public officers to be given education and training<br />
relating to ethical conduct.<br />
The department has ensured that applicable codes<br />
of conduct are widely disseminated to staff.<br />
The Tasmanian State Service Code of Conduct is referenced<br />
in all statements of duties and contextualised further<br />
in the department’s Conduct and Behaviour Standards<br />
published on the staff intranet.<br />
A recent departmental survey identified that an average<br />
of 20% of senior and middle managers from across the<br />
department have participated in workplace training<br />
activities relating to awareness raising and the prevention<br />
of misconduct.<br />
The Tasmanian State Service Workforce Survey also<br />
identified that 84.5% of the department’s respondents<br />
understood the department’s values, 93.1% are aware<br />
of the Tasmanian State Service Code of Conduct and how<br />
it applies to them, and 98.2% have a good understanding<br />
of the ethical standards expected of them.<br />
The department, upon approach from the Integrity<br />
Commission, has been involved in providing input into<br />
the development and delivery of module one of the<br />
Ethics and Integrity Training Program prior to its formal<br />
release by the Integrity Commission.<br />
Staff<br />
participation<br />
in<br />
professional<br />
learning<br />
Number<br />
Staff who participated in a structured professional development activity 1 6,856<br />
Staff who participated in structured leadership development programs provided by 1 :<br />
Professional Learning Institute 1,400<br />
LINC Tasmania 137<br />
Corporate Services Division 26<br />
Sub-total 1,563<br />
1. Source: department data collected for the State Service Management Office Agency Survey, 2013.<br />
70 Required Reporting » Employee Performance and Development Programs
Disability Framework for Action<br />
The state government’s original Disability Framework for<br />
Action 2005-2010 (DFA) required each agency to develop<br />
and implement a Disability Action Plan (DAP). The DFA sets<br />
out the government’s vision of Tasmania as an inclusive<br />
and caring community. It provides a whole-of-government<br />
approach to addressing the needs of people with disability<br />
in the design and delivery of all government policies,<br />
programs, services and facilities.<br />
A review of the DFA was undertaken by the Department<br />
of Premier and Cabinet (DPaC) in 2012 and the Premier<br />
launched the Disability Framework for Action 2013–2017.<br />
A review of the department’s DAP was delayed pending<br />
the DPaC review and was planned to commence in<br />
July 2013.<br />
The department’s Disability Action Plan 2008–2010 (DAP),<br />
which is available on the department’s website, includes<br />
measures to address issues identified in the framework as<br />
important to people with disability. This plan will remain<br />
in place until a full review is undertaken in line with the<br />
new DFA.<br />
The sections that follow describe some of the outcomes<br />
and achievements from the plan for 2012–13.<br />
Disability Standards for <strong>Education</strong> 2005<br />
The University of Canberra and education jurisdictions<br />
(including the department) commenced collaborative<br />
development of an eLearning resource to improve<br />
participants’ capacity to enact their obligations under the<br />
Disability Discrimination Act 1992 and the Disability Standards<br />
for <strong>Education</strong> (DSE) 2005 (“the Standards”).<br />
This eLearning is targeted to meet the different learning<br />
needs of key client groups (i.e. school teachers and<br />
administrative staff, educational leaders, and parents and<br />
caregivers) with a common core of content material.<br />
It is designed to develop the learner’s practical skills and<br />
strategies in regard to meeting the DSE through interactive,<br />
experiential learning, such as scenario-based problem<br />
solving. In each course participants will proceed through<br />
a series of compliance lessons and then work through<br />
the remaining material within the course to achieve<br />
desired learning outcomes. All learning material, including<br />
compliance lessons, will be presented in the following eight<br />
courses to reflect the learner’s specific context:<br />
1. Early childhood – prior to full-time school<br />
2. Early childhood – school<br />
3. Primary<br />
4. Junior secondary<br />
5. Senior secondary<br />
6. <strong>Education</strong>al leaders<br />
7. Parents and community<br />
8. <strong>Education</strong> assistants.<br />
More Support for Students with Disability National Partnership Agreement<br />
In the 2011 Federal Budget, funding was made available<br />
over two years to support programs for students with<br />
disability. The funding available to the state government<br />
system in Tasmania totalled $3.8 million, commencing in<br />
March 2012 and ceasing at the end of 2013.<br />
The funding was delivered through a national partnership<br />
agreement to ensure schools and teachers are better<br />
able to support students with disabilities, contributing<br />
to improved student learning experiences, educational<br />
outcomes and transitions to further education or work.<br />
The funding must be used to meet outputs devised at<br />
the commonwealth level within the advised timeline.<br />
Therefore consideration of sustainability is important and<br />
is addressed by focusing on building professional expertise,<br />
skills and knowledge through professional learning using<br />
train-the-trainer and cascade learning models.<br />
Components within the plan were developed in<br />
consultation with a range of key stakeholders including<br />
the Tasmanian Principals Association, the Special and<br />
Additional Needs Principal’s Reference Group,<br />
Managers–School Support, support staff and peak<br />
parent associations and disability groups.<br />
Project funding within Tasmanian Government schools is<br />
focused on achieving the following:<br />
1. Training for teachers to build their skills in<br />
special education<br />
A license has been purchased that allows all staff within<br />
the department to access a range of online professional<br />
learning modules across a range of disability areas.<br />
Twenty-three staff, including specialist support staff and<br />
class teachers, have been trained as facilitators to support<br />
the use of online disability modules within schools.<br />
The numbers of staff completing the modules are<br />
outlined below:<br />
Module<br />
Number<br />
of staff<br />
Motor Coordination Difficulties 48<br />
Managing Behaviour Difficulties 115<br />
Dyslexia 86<br />
Speech and Language Communication 57<br />
Autism Spectrum Disorder 122<br />
Vision and Hearing Loss 4<br />
Total 432<br />
Required Reporting » Disability Framework for Action<br />
71
2. Training for all school staff to improve<br />
understanding of their obligations under the<br />
DSE and how to meet those obligations<br />
Access to an online interactive learning module on the<br />
DSE outlining responsibilities and implications for school<br />
practice is currently under development in collaboration<br />
with other state jurisdictions and the University of<br />
Canberra. Upon completion, this module will be used<br />
through principal networks and with school staff.<br />
Through the Professional Learning Institute a four day<br />
spaced program titled Empowering Diversity in our Schools<br />
was offered in 2012 and again in 2013. The program<br />
utilises current research and practice that builds inclusive<br />
school cultures linked to the school improvement<br />
agenda; the implementation of the Disability Standards for<br />
<strong>Education</strong> 2005; the use of the tool The Index for Inclusion;<br />
and work relating to the effective use of support staff and<br />
paraprofessionals in inclusive schools.<br />
3. Assistive technologies to support the teaching<br />
and participation of students with disability<br />
The provision of current technologies supports students<br />
with disability in both special and mainstream schools to<br />
access and engage in the broader curriculum – especially in<br />
literacy learning and augmented communication.<br />
A total of 658 iPads, covers, and iTunes support was<br />
purchased and allocated for individual student use by<br />
June 2013. A total of 14 interactive whiteboards was<br />
allocated to special schools and a range of assistive<br />
technologies for students in mainstream schools with<br />
vision impairment including Braille display devices, portable<br />
magnification devices and upgraded JAWs (screen reader<br />
software) and Duxbury (Braille translation software)<br />
licenses.<br />
4. Training for teachers to strengthen their<br />
skills in the use of assistive technology within<br />
the classroom<br />
Professional learning has been provided for special<br />
education advisors, teachers and teacher assistants in<br />
the use of assistive technologies for communication<br />
and literacy development for students with disability.<br />
This includes a three day program (one day per term) for<br />
320 teachers statewide (with teaching relief provided)<br />
and 350 days across the two years for relief for teacher<br />
assistants to participate in professional learning in the use<br />
of assistive technologies.<br />
5. Additional support for students with<br />
disabilities to transition effectively between the<br />
stages of schooling and/or from schooling into<br />
further education, training or employment.<br />
To reduce problems and stress during transition for<br />
students with disability and their families, a set of materials<br />
and resources for use by schools and families is under<br />
development in collaboration with TASCARE to support<br />
effective transition between stages of schooling.<br />
Professional learning sessions have been delivered in<br />
each Learning Service and a series of forums for parents<br />
and community members have been developed and<br />
conducted throughout March 2013. Allocations have<br />
been made to school resource packages to support<br />
individual and small group transition plans for students<br />
with high-transition support needs from 2012 to 2013.<br />
Allocations were made to 74 schools (primary, secondary,<br />
senior-secondary and special schools) totalling $168,723<br />
in support of transition processes at the beginning of<br />
November 2012.<br />
Tasmanian Adult Literacy Action Plan 2010–2015<br />
The action plan includes the $1 million Adult Literacy<br />
Investment Fund which provides funding for literacy skills<br />
development projects across the LINC network, including<br />
projects targeting the needs of a particular community or<br />
client groups within Tasmania.<br />
A Literacy Coordinator Network has been established<br />
throughout the state and is supported by a pool of trained<br />
volunteer tutors to drive the Adult Literacy Network.<br />
LINC services work with disability service providers and<br />
community organisations to identify and support those<br />
who could benefit from core skills programs.<br />
Two specific grant programs under the action plan are<br />
administered by Skills Tasmania:<br />
1. The Employer Pledge Program funds projects where<br />
employers pledge to support the development of<br />
literacy skills for employees within their organisations<br />
by allowing employees to participate in literacy<br />
support projects and training during work hours.<br />
2. The Adult Literacy Community Grants Program funds<br />
projects with community partnerships and innovative<br />
approaches for specific target groups – including<br />
people with a disability – to improve the core skill<br />
levels of Tasmanian community members in order to<br />
facilitate improved access to education, training and<br />
employment.<br />
72 Required Reporting » Disability Framework for Action
Implementation of child and family centres<br />
Child and family centres (CFCs) provide a range of<br />
integrated services that support families with the health<br />
and wellbeing, learning and development of children<br />
from birth to school age, preparing them for a healthy life<br />
and success at school. The development and operation<br />
of CFCs includes support for children and families<br />
with disability.<br />
Nine state government funded CFCs are now operating,<br />
as of April 2013. A total of 10 centres are funded by the<br />
state government.<br />
The Tasmanian Planning Commission approved the<br />
development of the George Town Child and Family Centre<br />
as part of a HUB development on 26 July 2013.<br />
Submissions have now been prepared for the<br />
Parliamentary Standing Committee on Public Works<br />
for final approval.<br />
Two Indigenous CFCs at Bridgewater and Geeveston have<br />
been funded by the Commonwealth. The Aboriginal CFC<br />
that operates at Risdon Cove was supported by state<br />
government funding of $1 million for construction.<br />
Local Enabling Groups (LEGs) were formed to guide<br />
the service and development of each CFC. In some<br />
communities these are transitioning to advisory groups<br />
to support the ongoing development of the centres<br />
and implementation of integrated service delivery.<br />
Centre leaders and community inclusion workers are<br />
employed in all CFCs.<br />
Accessible facilities<br />
All building works and refurbishments are undertaken<br />
in accordance with Building Code of Australia and<br />
Disability Discrimination Act 1992 requirements. The<br />
department engaged a Professional Access Consultant to<br />
provide specialist advice on the design of the new child<br />
and family centres and substantial refurbishment works,<br />
in order to establish confidence that the new works comply<br />
with the standards.<br />
All facilities meet the appropriate standards in place at the<br />
time of construction. Retro-fitting occurs as facilities are<br />
reviewed to ensure all works remain fully compliant with<br />
current standards.<br />
Physical impairment coordinators work in conjunction<br />
with Facility Services to map the pathways for students<br />
with access issues and provision is made prior to the<br />
arrival of students where possible. Where higher level<br />
modifications are required for the needs of a specific<br />
individual these are also captured through the pathways<br />
mapping process.<br />
Where a student is relocated without notice to the<br />
department (from the mainland for example) temporary<br />
measures are put in place whilst permanent works are<br />
undertaken. The department has purchased a number<br />
of transportable ‘accessible bathroom pods’ that can be<br />
relocated from one school to another where unexpected<br />
circumstances arise and accessible bathroom facilities are<br />
required urgently.<br />
Required Reporting » Disability Framework for Action<br />
73
Public Access to the Department<br />
Community<br />
awareness<br />
of the<br />
department<br />
and its<br />
services 1<br />
A key role of the Communication Services unit is to<br />
keep the Tasmanian community and departmental staff<br />
informed about the department’s programs and initiatives<br />
and to promote public education in a positive light.<br />
Communication Services takes a proactive approach to<br />
promoting the achievements of state government schools<br />
in Tasmania.<br />
Advice and assistance is provided to departmental staff<br />
and schools in response to media enquiries.<br />
We actively seek media opportunities through<br />
newspapers, magazines, radio and television, write feature<br />
stories showcasing recent achievements, release good<br />
news stories and organise interviews with staff to<br />
promote targeted programs.<br />
Opportunities for media coverage promoting education<br />
and information services including launches and events,<br />
feature stories and interviews showcasing departmental<br />
programs and community engagement initiatives are<br />
proactively identified and managed.<br />
1. Lists of departmental publications are located in the appendices.<br />
Public interest<br />
disclosures<br />
The main objective of the Public Interest Disclosures Act 2002<br />
is to encourage and facilitate disclosures about improper<br />
conduct or detrimental action by public officers and public<br />
bodies. The department’s Public Interest Disclosures Policy and<br />
Model Procedures are available on the department’s website.<br />
From 1 July 2012 through to 30 June 2013, the department<br />
did not receive any public interest disclosures.<br />
Right to<br />
information<br />
(RTI)<br />
requests<br />
During the 2012–13 year, the department received<br />
requests under the Right to Information Act 2009.<br />
The number of requests has reduced from 40 in 2011–12,<br />
to 32 requests in 2012–13. Previous legislation (Freedom of<br />
Information) required personal information to be treated<br />
as an assessed disclosure. However, with the introduction<br />
of the Personal Information Protection Act 2004, applications<br />
for access to, or amendment of, personal information can<br />
be released without the need for analysis under the<br />
Right to Information Act. Under this Act, requests for<br />
information are more comprehensive in an effort to<br />
provide the public with greater access to departmental<br />
information.<br />
Of the 32 new applications for assessed disclosure received<br />
by 30 June 2013, 23 were accepted as assessed disclosures.<br />
Reasons for non-acceptance varied and included issues<br />
associated with fee waiver. Of the 23 accepted applications,<br />
5 remain undecided as at 30 June 2013.<br />
Of the 23 applications for assessed disclosure determined<br />
in 2012–13, 13 were provided within the time limit of<br />
20 days. Six requests were resolved outside the 20 day<br />
limit. Four requests were resolved with an extension<br />
permitted under the Act. A total of 16 of the determined<br />
applications were received from politicians or the media<br />
and were complex requests involving a large amount of<br />
information across various areas of the department.<br />
A breakdown for applications under the<br />
Right to Information Act determined in 2012–13<br />
is as follows:<br />
Right to information requests<br />
Number<br />
Total requests for assessed disclosure determined 23<br />
Requests for personal information 4<br />
Requests for other information 19<br />
Requests to amend documentation 0<br />
Granted in full 9<br />
Granted in part 10<br />
Refused/exempt/information – not held 4<br />
Withdrawn 0<br />
74 Required Reporting » Public Access to the Department
Legislation Administered, Enacted and Amended<br />
Legislation<br />
administered<br />
Allport Library and Museum of Fine Arts Agreement Act 1966<br />
Subordinate legislation: Allport Library and Museum of Fine Arts Regulations 2012<br />
Archives Act 1983<br />
Subordinate legislation: Archives Regulations 2004<br />
Building and Construction Industry Training Fund Act 1990<br />
Subordinate legislation: Building and Construction Industry Training Fund Regulations 2004 and Building and<br />
Construction Industry Training Fund Orders 1999 and 2001<br />
Child Care Act 2001<br />
Subordinate legislation: Child Care (Fees) Regulations 2013<br />
Christ College Act 1926<br />
<strong>Education</strong> Act 1994<br />
Subordinate legislation: <strong>Education</strong> Regulations 2005<br />
<strong>Education</strong> and Care Services National Law (Application) Act 2011<br />
Subordinate legislation: <strong>Education</strong> and Care Services National Regulations 2011<br />
<strong>Education</strong> and Training (Tasmanian Academy) Act 2008<br />
Subordinate legislation: <strong>Education</strong> and Training (Tasmanian Academy) Regulations 2011<br />
<strong>Education</strong> and Training (Tasmanian Polytechnic) Act 2008<br />
Subordinate legislation: <strong>Education</strong> and Training (Tasmanian Polytechnic) Regulations 2011<br />
<strong>Education</strong> and Training (Repeals and Transitional Provisions) 2008<br />
<strong>Education</strong> and Training (Tasmanian Skills Institute) Act 2008<br />
Subordinate legislation: <strong>Education</strong> and Training (Tasmanian Skills Institute) By-Laws 2010<br />
<strong>Education</strong> and Training (Transitional Provisions) Act 2010<br />
Libraries Act 1984<br />
Subordinate legislation: Libraries Regulations 2012<br />
Tasmanian Qualifications Authority Act 2003<br />
Subordinate legislation: Tasmanian Qualifications Authority (Fees) Regulations 2003<br />
Teachers Registration Act 2000<br />
Subordinate legislation: Teachers Registration Regulations 2012<br />
University of Tasmania Act 1992<br />
Vocational <strong>Education</strong> and Training Act 1994<br />
Subordinate legislation: Vocational <strong>Education</strong> and Training Regulations 2005<br />
Vocational <strong>Education</strong> and Training (Commonwealth Powers) Act 2011<br />
Youth Participation in <strong>Education</strong> and Training (Guaranteeing Futures) Act 2005<br />
Legislation<br />
enacted and<br />
amended<br />
• Allport Library and Museum of Fine Arts Regulations 2012<br />
• Child Care (Fees) Regulations 2013<br />
• Libraries Regulations 2012<br />
• Teachers Registration Regulations 2012<br />
• Training and Workforce Development Bill 2013 1<br />
• Training and Workforce Development (Transitional Provisions) Bill 2013<br />
• Training and Workforce Development (Repeals and Consequential Amendments) Bill 2013<br />
1. The Training and Workforce Development bills passed through the Tasmanian Parliament prior to 30 June 2013, however, the legislation was not enacted until<br />
1 July 2013.<br />
Required Reporting » Legislation Administered, Enacted and Amended<br />
75
Statutory and Non-statutory Bodies<br />
Statutory<br />
bodies<br />
Allport Library and Museum of Fine Arts<br />
Management Committee<br />
The function of this committee is to administer the funds<br />
and property of the Allport Library and Museum of Fine<br />
Arts and of the Allport Bequest, and to give effect to<br />
the provisions and general purpose of the will of Henry<br />
Allport. The committee was established under section 19<br />
of the Libraries Act 1984.<br />
Minister’s <strong>Education</strong> and Care Advisory Council<br />
(previously the Minister’s Child Care Advisory<br />
Council)<br />
The council advises and assists the Minister in the exercise<br />
of powers and the performance of functions under and<br />
in respect of the Child Care Act 2001. Established under<br />
section 73 of the Act, the council provides advice directly<br />
to the Minister on matters relating to child care, including<br />
policy, concerns and issues, community awareness and the<br />
status of the industry.<br />
Schools Registration Board (SRB)<br />
The board was established in 1995. Its primary function<br />
is to register non-government schools and ensure that<br />
non-government schools comply with the standards for<br />
education determined by the Minister. The legislative<br />
basis for registration is contained in section 51 of the<br />
<strong>Education</strong> Act 1994.<br />
Skills Tasmania Board 1<br />
The Skills Tasmania Board was established under the<br />
Vocational <strong>Education</strong> and Training Act 1994 and is responsible<br />
to the Minister for the performance of the functions of<br />
Skills Tasmania, and the achievement of its objectives.<br />
Skills Tasmania is responsible for planning, purchasing<br />
and supporting the delivery of vocational education and<br />
training services for Tasmania; the development of policy<br />
advice for skills development; promotion of industry<br />
investment and training; and the development, regulation<br />
and administration of the system in Tasmania.<br />
Skills Tasmania’s annual report is available online at<br />
http://www.skills.tas.gov.au/skillstas/annualreports.<br />
1. As a result of the passage of the Training and Workforce Development<br />
legislation, Skills Tasmania ceased to be a statutory authority from<br />
30 June 2013. Skills Tasmania will maintain its name and functions and has<br />
become a business unit of the department as of 1 July 2013. The board<br />
was abolished as of 30 June 2013, however, will continue to function until<br />
such time as reporting requirements are completed.<br />
State Library and Archives Trust<br />
The trust administers property acquired by gift, bequest,<br />
or device, and ensures that all applicable conditions are met.<br />
It was established under section 16 of the Libraries Act 1984.<br />
Tasmanian Building and Construction Industry<br />
Training Board<br />
The Building and Construction Industry Training Fund Act<br />
1990 provides for the board to be principal advisor to the<br />
Minister on all matters relating to training in the building<br />
and construction industry, particularly in relation to skill<br />
requirements and training arrangements for the industry.<br />
The board maintains and administers the Building and<br />
Construction Industry Training Fund. The board was<br />
established under section 4 of the Act. An electronic copy<br />
of the board’s annual report is available on request.<br />
Tasmanian Library Advisory Board (TLAB)<br />
The functions of the board are to consider and report on<br />
matters referred to it by the Secretary of the department<br />
and to advise the Minister on any issues relating to library<br />
services. It must also report to the Secretary of the<br />
department at the end of each financial year. The board<br />
was established under section 11 of the Libraries Act 1984.<br />
Tasmanian Qualifications Authority (TQA)<br />
The authority advises the Minister on matters relating to<br />
qualifications in Tasmania. It accredits courses for senior<br />
secondary, higher education and vocational education<br />
and training, and registers providers of higher education<br />
and vocational education and training. It determines<br />
assessment for obtaining a qualification in an accredited<br />
course, and collects, records and distributes student<br />
information relating to senior secondary education,<br />
vocational education and training, and higher education.<br />
The authority was established under the<br />
Tasmanian Qualifications Authority Act 2003. TQA’s annual<br />
report is available online at http://www.tqa.tas.gov.au/1548.<br />
Tasmanian Skills Institute Board 1<br />
The Tasmanian Skills Institute Board is established under<br />
the <strong>Education</strong> and Training (Tasmanian Skills Institute) Act 2008<br />
and is responsible to the Minister for the performance<br />
of the functions of the Tasmanian Skills Institute, and the<br />
achievement of the objectives specified in its corporate<br />
plan. The Tasmanian Skills Institute’s focus is on providing<br />
and promoting education and training to employed<br />
people. Its purpose is to develop workforce skills in close<br />
consultation with industry. The board’s annual report is<br />
available online at http://www.skillsinstitute.com.au/.<br />
1. As a result of the passage of the Training and Workforce Development<br />
legislation, the Tasmanian Skills Institute Board was abolished as of<br />
30 June 2013, however, the board continues to function until such time as<br />
reporting requirements are completed.<br />
Teachers Registration Board (TRB)<br />
The board is empowered under the Teachers Registration<br />
Act 2000 to administer the teacher registration system to<br />
ensure that only those people who meet agreed standards<br />
and legislative requirements are able to teach in Tasmania.<br />
The board’s annual report is available online at<br />
www.trb.tas.gov.au.<br />
University of Tasmania Council<br />
Established under the University of Tasmania Act 1992,<br />
the council appoints the vice-chancellor and principal,<br />
who is the chief academic and executive officer of the<br />
university. The council also appoints the deans and the<br />
heads of school, on the recommendation of the<br />
vice-chancellor. An Academic Senate advises the council<br />
on all academic matters relating to the university.<br />
The council’s annual report is available online at<br />
www.utas.edu.au.<br />
76 Required Reporting » Statutory and Non-statutory Bodies
Nonstatutory<br />
bodies<br />
Tasmanian Aboriginal Corporation for<br />
<strong>Education</strong> (TACE)<br />
The association is an incorporated community<br />
organisation specialising in education. Its purpose is to<br />
represent the views of Tasmanian Aboriginal communities<br />
on education to the state and Australian Governments,<br />
as well as private education providers. The association,<br />
which receives state and Australian Government funding,<br />
is committed to the principle of Aboriginal<br />
self-determination.<br />
Tasmanian Home <strong>Education</strong> Advisory Council<br />
(THEAC)<br />
The council assists in the management and support of<br />
home education in Tasmania. The role of the council is<br />
also to provide advice and information to the Minister<br />
about home education. It is responsible for monitoring<br />
individual home education programs and provides a<br />
reference point for enquiries, responds to community<br />
concerns, and maintains liaison with other agencies about<br />
home education.<br />
Required Reporting » Statutory and Non-statutory Bodies<br />
77
Asset Management and Risk Management<br />
Asset<br />
management<br />
Assets are managed within whole-of-government policies<br />
and guidelines. Key strategies for the effective and efficient<br />
use of assets include:<br />
• optimising the use of built resources to support the<br />
provision of a range of educational programs and<br />
curriculum choices at dispersed sites<br />
• managing capital funding for building improvements<br />
equitably and according to priorities, ensuring<br />
appropriate standards of accommodation to support<br />
best practice in service delivery<br />
• optimising maintenance effort through strategic<br />
management and managing resources in accordance<br />
with statutory obligations, occupational health and<br />
safety, optimum service delivery and asset retention<br />
progressing initiatives to identify, rank and mitigate<br />
risks within the context of the government’s overall<br />
risk management strategy<br />
• progressing towards industry best practice in<br />
procurement practices and full compliance with<br />
Treasury requirements<br />
• maximising the responsible use of facilities, facilitating<br />
partnership agreements for sharing facilities, and using<br />
community and shared facilities where appropriate<br />
• supporting the Asset Strategy Steering Committee<br />
to provide strategic oversight and direction in asset<br />
management<br />
• oversight of the Strategic Asset Management Plan<br />
(SAMP).<br />
Risk<br />
management<br />
The department’s risk management activities are<br />
governed by its Risk Management and Audit Committee<br />
(RiMAC). The committee is chaired by the Secretary<br />
with members including Deputy Secretaries, the Director<br />
responsible for LINC Tasmania, the Manager Internal<br />
Audit and one external member.<br />
Five meetings were held during the year, some of which<br />
were attended by the Tasmanian Auditor-General,<br />
staff from the Tasmanian Audit Office and the external<br />
financial auditor.<br />
Key risk management activities undertaken during the<br />
year included:<br />
• development of risk management plans for key<br />
management areas and subsequent presentation<br />
to RiMAC<br />
• continuation of the implementation of the<br />
Information Security Project<br />
• seminars, presentations and workshops across<br />
Tasmania to assist schools and corporate sites<br />
with the implementation of risk management plans<br />
and activities<br />
• general advisory services to raise risk awareness<br />
throughout the department<br />
• seasonal influenza vaccination for departmental staff.<br />
ICT risk<br />
management<br />
ICT risks are managed within a whole-of-government<br />
framework, and are supported by department policies<br />
and guidelines. The following key strategies enable<br />
effective and efficient use of the ICT system:<br />
• Backups of all systems occur regularly to minimise the<br />
risks of losing data, with backups stored offsite. High<br />
availability options are considered for critical systems,<br />
with specific redundant hardware components in<br />
servers (e.g. additional power supplies and network<br />
cards) included as a minimum requirement.<br />
• Disaster recovery plans are tested for several major<br />
systems on a rotational basis.<br />
• Access from outside the departmental network is<br />
restricted, and a range of access levels have been set<br />
for staff, students and the public to ensure that access<br />
to information is limited to a ‘needs-only’ level.<br />
• Risks to confidentiality, integrity and availability are<br />
identified, and mitigation strategies implemented<br />
where appropriate.<br />
78 Required Reporting » Asset Management and Risk Management
Climate Change<br />
The department’s long-term vision is for all Tasmanian<br />
schools to be sustainable with students having the<br />
opportunity to learn as part of a whole school approach<br />
to sustainability.<br />
Under the Tasmanian Framework for Action on Climate Change<br />
the department produced an Emissions Reduction Plan in<br />
2009 which works in conjunction with the department’s<br />
Strategic Asset Management Plan (SAMP) to develop energy<br />
efficiency improvements in existing facilities.<br />
These documents provide the framework for achieving<br />
the department’s broader goals of contributing to<br />
the reduction of global greenhouse gas emissions by<br />
also encouraging innovation in areas such as recycling,<br />
transportation, green building initiatives and moving<br />
towards carbon-neutral facilities. The department<br />
intends to:<br />
• use less energy<br />
• reduce transport/travel related emissions while<br />
maintaining continuity of business operations<br />
• reduce levels of office waste<br />
• develop and lead an education program aimed at<br />
engaging staff, students and the broader community.<br />
Since 2012, sustainability has been a cross-curriculum<br />
priority in the Australian Curriculum and therefore a focus<br />
in all Tasmanian schools. This provides the opportunity<br />
for schools to build on the sustainability initiatives that<br />
they already have in place or to develop a sustainability<br />
focus. The department is supporting schools in their<br />
sustainability work initiatives through the establishment<br />
of the Sustainability Learning Centre (SLC) at Mt Nelson,<br />
identification of sustainability lead schools and the<br />
implementation of the $1 million Sustainability Initiatives<br />
Program.<br />
The department runs an incentive-based energy funding<br />
model which provides improved opportunities for schools<br />
to make long-term commitments to energy savings and<br />
utilise incentives.<br />
Key elements of the department’s initiatives are:<br />
• 5-Star Green Star new schools – the new Kingston<br />
High, Austins Ferry Primary, Romaine Primary,<br />
Windermere Primary and Port Sorell Primary<br />
Schools were designed as 5-Star Green Star facilities<br />
as well as new buildings at the Jordan River Learning<br />
Federation in Bridgewater. The new primary school to<br />
be constructed at Dunalley will also meet the 5-Star<br />
Green Star rating.<br />
• Actively implementing a stringent and ongoing review<br />
of the vehicle fleet requirements to include more fuel<br />
efficient vehicles and the use of hybrid cars where<br />
feasible. All of the department’s light vehicle fleet<br />
meets the minimum greenhouse ratings. Overall,<br />
the size of the fleet has reduced by 32, from 310 in<br />
2010–11 to 278 in 2012–13.<br />
• The introduction of the Energy Saving Guide, an<br />
incentive-based energy funding model and an<br />
increased focus on climate change, has resulted in<br />
a significant reduction in electricity consumption<br />
since 2010.<br />
• Construction of the innovative Sustainability<br />
Learning Centre on the site of the Hobart College<br />
at Mount Nelson is now complete and opened in<br />
November 2012. The $2.8 million centre, funded by<br />
the Australian Government, was built through a<br />
partnership between Greening Australia, CSIRO, the<br />
Department of <strong>Education</strong>, the Tasmanian Catholic<br />
<strong>Education</strong> Office and the Association of Independent<br />
Schools and now:<br />
º º delivers specialist science, ecology and<br />
sustainability education<br />
º º provides a new home for Greening Australia<br />
(Tasmania) which contributed $300,000 to the<br />
project and CSIRO <strong>Education</strong> Centre<br />
º º is the first educational 6-Star Green Star rated<br />
building in Tasmania and used recycled building<br />
materials, and the building demonstrates<br />
sustainability principles as an educational tool<br />
º º encourages ‘hands-on’ education using the<br />
building itself as a tool, nurseries, field activities,<br />
interpretive trails and bush classrooms<br />
º º maximises use of solar energy resulting in<br />
zero net external energy for teaching areas and<br />
feature recycled stormwater and sewerage<br />
º º is a carbon-neutral building in initial construction<br />
and ongoing use and exhibits plant cultivation<br />
and biodiversity<br />
º º utilised materials from a large warehouse and<br />
cottage in Hobart that have been recycled and<br />
make up 70–80% of the new centre’s materials.<br />
• LED emergency exit lights – the department has<br />
implemented a program of replacing conventional<br />
emergency exit lights with energy efficient LED exit<br />
lights. This conversion project is being rolled out in<br />
stages as funds permit. The program has provided<br />
1,780 energy efficient exit lights to 78 schools and<br />
libraries around the state. The new LED lights are<br />
estimated to consume 44kWh of energy per annum –<br />
which is 87% less energy than the traditional exit lights<br />
that consume approximately 350kWh per annum.<br />
• National Solar Schools Program (NSSP) – the objectives<br />
of this Commonwealth-funded scheme are to allow<br />
schools to:<br />
º º generate their own electricity from renewable<br />
sources<br />
º º improve their energy efficiency and reduce their<br />
energy consumption<br />
º º adapt to climate change by making use of<br />
rainwater collected from school roofs<br />
º º provide educational benefits for school students<br />
and their communities.<br />
This program has now wound up, but since its<br />
inception in 2008, a total of 109 Tasmanian schools<br />
have participated with the following outcomes:<br />
º º solar panels have been installed in 103 schools with<br />
a maximum generating capacity of 675.5 kWh<br />
º º two schools have installed wind-powered<br />
generating systems<br />
º º 29 schools have replaced 11,795 lights with high<br />
efficiency units<br />
º º 13 schools have installed rainwater tanks for<br />
irrigation purposes with a capacity of 302,584 litres<br />
º º other energy-efficiency measures including<br />
the installation of heat pumps, solar hot water<br />
units, sensors, timers, thermostats, ceiling fans,<br />
door closers and draught seals.<br />
Required Reporting » Climate Change<br />
79
• Sustainability Initiatives Program – on 22 March 2012,<br />
the Tasmanian Government announced a $1 million<br />
program to further reduce the carbon footprint of<br />
Tasmanian schools. Schools are currently accessing<br />
this program to undertake capital projects to<br />
improve water management, waste management,<br />
deliver energy efficiency, or address other<br />
climate change concerns. The program is being<br />
implemented as part of the department’s 2012–13<br />
and 2013–14 minor works and essential maintenance<br />
programs.<br />
• To promote the importance of effective waste<br />
management the department’s Climate Change<br />
Steering Committee implemented a new statewide<br />
waste management contract during 2011. A key<br />
feature of the contract is the reporting of levels of<br />
waste removal and the resultant greenhouse gas<br />
emissions. The reports substantially improve the<br />
department’s information and management of<br />
waste and enable improvements in recycling to be<br />
identified and introduced.<br />
º º A number of the department’s sites had<br />
contracts in place with other providers at the<br />
commencement of this contract. As these<br />
contracts expire, these sites are being rolled<br />
in to the statewide contract. In addition, the<br />
contractor’s capacity to service all regions of<br />
the state has improved over the life of the<br />
contract, as have the number of sites under the<br />
department’s management.<br />
º º In 2012–13, a total of 289 sites were serviced by<br />
the contractor, a 9% increase over the 265 sites<br />
serviced in 2011–12.<br />
º º As a result, the contractor’s waste management<br />
reports for the 2012–13 year revealed a 6.9%<br />
increase in gross total emissions from 4,541 to<br />
4,854 tonnes CO2.<br />
º º Contributing to the increase in emissions was<br />
the total volume of waste for the department,<br />
which increased from 4,090 tonnes in 2011–12 to<br />
4,373 tonnes in 2012–13. This increase is largely<br />
attributable to the increase in the number of<br />
existing sites now included in reporting and new<br />
sites added during 2012–13 (as outlined above).<br />
As a direct comparison, there has been a 2.1%<br />
decrease in total emissions – not including the<br />
sites newly added to reporting in 2012–13.<br />
º º The total emissions figure was reduced by<br />
1,243 tonnes CO2 as a result of the contractor<br />
being able to divert waste to landfill with gas<br />
recovery capabilities.<br />
Waste emission levels 2012–13 (t CO2-e)<br />
2011–12 1 2012–13<br />
Total emissions if all waste to landfill 4,541 4,854<br />
Greenhouse gas (GHG) emissions saved due to diverting waste from landfill 1,197 1,243<br />
Current total GHG emissions 3,344 3,611<br />
Percentage reduction 26.4% 25.6%<br />
GHG emissions saved due to diverting from landfill – equivalent<br />
2011–12 1 2012–13<br />
Number of cars removed from the road for one year 266 276<br />
Number of trees planted 4,469 4,638<br />
Number of passengers off-setting a flight Sydney to Hong Kong 1,572 1,631<br />
1 Since the introduction of the carbon price in July 2012, there is further governmental and industry practice guidance available on greenhouse gas<br />
emissions calculations. A key Carbon Credit Methodology Determination was released in January 2013 for use in calculating emissions in the waste sector.<br />
2012–13 emission figures were calculated using this methodology and 2011–12 figures were also recalculated for comparative purposes.<br />
80 Required Reporting » Climate Change
Measuring<br />
and reporting<br />
In 2008, the Department of Premier and Cabinet<br />
commissioned Parsons Brinckerhoff Australia Pty Ltd to<br />
perform an audit of all Tasmanian Government agency<br />
activities. The scope of this audit included quantifying<br />
the state government’s greenhouse gas emissions by<br />
department/unit. The audit was sample-based and<br />
extrapolations of data for the department indicated that<br />
in 2006–07 the department had emitted 20,886 tonnes<br />
of greenhouse gas emissions.<br />
The department has been developing more mature data<br />
collection and evidence–based reporting regimes since<br />
this audit. The current key points are:<br />
• 2012–13 will be the third year that the department has<br />
used the Online System for Comprehensive Activity<br />
Reporting (OSCAR) provided by the Australian<br />
Government (Department of Climate Change and<br />
Energy Efficiency) to report on its greenhouse gas<br />
emissions across all activities<br />
• the department continues to develop systems to<br />
accurately measure the quantities for the extensive<br />
set of emission types to be reported in OSCAR.<br />
Greenhouse gas emissions during the financial year<br />
2012–13 were approximately 31,147 tonnes of carbon<br />
dioxide equivalent. The following table provides a<br />
breakdown of 2012–13 figures, along with 2011–12<br />
figures for comparison.<br />
2011–12 2012–13<br />
Activity Volume t CO2-e Volume t CO2-e<br />
Electricity 75.02 GWh 25,387.4 76.18 GWh 25,779.0<br />
Unleaded petrol 484.8 kL 1,240.7 341.9 kL 876.0<br />
Diesel fuel 94.1 kL 273.1 231.3 kL 671.3<br />
Air travel 2.94 million km 581.9 1.67 million km 210.0<br />
Waste 4,090 t 3,343.7 4,373 t 3,610.7<br />
Total 30,826.8 31,147.0<br />
Required Reporting » Climate Change<br />
81
Pricing Policies<br />
The department has some limited service-delivery<br />
activities that require pricing of goods and services.<br />
In accordance with the government’s policy on fees<br />
and charges, the department is working towards pricing<br />
models which are generally based on full cost-recovery<br />
and/or commercial rates.<br />
Administered Payments<br />
The department administers the grant and subsidy<br />
programs which are outlined below.<br />
Accommodation allowance for<br />
tertiary students<br />
An allowance is paid to eligible full-time tertiary students,<br />
whose parents are residents of Tasmania, to assist with<br />
accommodation expenses when they are required to live<br />
away from their primary place of residence to undertake<br />
their chosen course of study. In 2012–13, an allowance<br />
of $1,050 was paid to eligible students receiving Youth<br />
Allowance or other equivalent Australian Government<br />
benefits, and to students approved under the special<br />
family provisions of the scheme. This scheme has been<br />
closed to new applicants with effect from 1 July 2011.<br />
Australian Government grants to<br />
non-government schools<br />
This grant program represents Australian Government<br />
funding relating to non-government schools.<br />
This also includes funding provided under the following<br />
National Partnerships Agreements between Tasmania<br />
and the Australian Government:<br />
• Digital <strong>Education</strong> Revolution<br />
• Support for Improving Learning Experiences and<br />
<strong>Education</strong>al Outcomes for School Students with a Disability<br />
• Improving Literacy and Numeracy<br />
• National Solar Schools.<br />
These funds are administered on behalf of the Australian<br />
Department of <strong>Education</strong>, Employment and Workplace<br />
Relations (DEEWR) and, upon receipt, are forwarded to<br />
non-government schools.<br />
The department maintains a Fees and Charges Manual<br />
that provides information on the fees and charges for<br />
which the department is responsible. These are subject to<br />
ongoing review.<br />
Non-government schools: Capital assistance<br />
These grants provide funding to non-government schools<br />
and non-government school authorities for assistance with<br />
eligible capital projects in accordance with sections 64–70<br />
of the <strong>Education</strong> Act 1994. This program was indexed from<br />
2009–10 onwards.<br />
Non-government schools: Grants<br />
This program covers the cost of grants which are<br />
distributed to registered non-government schools in<br />
accordance with Part 5, Division 3 of the <strong>Education</strong> Act<br />
1994 and Part 6 of the <strong>Education</strong> Regulations 2005.<br />
Non-government schools: Special needs funding<br />
These grants are provided for additional learning support<br />
for students with high and/or additional needs.<br />
Non-government schools: Student assistance<br />
This includes the operation of the Student Assistance<br />
Scheme and coverage of costs for the supply of spectacles<br />
to students whose parents meet the income test criteria.<br />
Administered payments: Expenditure 2012–13<br />
Program Expenditure $ ’000<br />
Australian Government grants to non-government schools 180,031<br />
Non-government schools: Capital assistance 1,141<br />
Non-government schools: Grants 53,070<br />
Non-government schools: Special needs funding 795<br />
Non-government schools: Student assistance 308<br />
Total 235,345<br />
82 Required Reporting » Pricing Policies and Administered Payments
Loss and Damage<br />
The Tasmanian Risk Management Fund (TRMF) covers<br />
the department’s insurable risks including workers<br />
compensation, general liability and property damage<br />
and loss. Contributions to the fund totalled $14.5 million<br />
(excluding GST). The contributions included $10.3 million<br />
for workers compensation and $3.5 million for property<br />
loss and damage.<br />
In addition, the department purchased legal liability<br />
insurance from a commercial insurer to protect hirers of<br />
departmental facilities against legal liability claims being<br />
made against them.<br />
The potential exists for general liability claims to be<br />
brought against the department. Facilities, contents and<br />
motor vehicles are subject to loss and damage arising<br />
from various causes, including vandalism. Under the<br />
department’s asset management policy, responsibility for<br />
the management of facilities rests with individual sites.<br />
The department suffered a major property loss of<br />
the Dunalley Primary School during the January 2013<br />
bushfires. The cost of the loss was estimated to be<br />
$11.8 million.<br />
The department also operates the Property Protection<br />
Scheme which is a self-funded pool that covers the cost of<br />
damage and losses incurred by schools and child and family<br />
centres up to $50,000. Claims in excess of this amount are<br />
covered by the Property Cover Scheme.<br />
The following is a summary of insurance claims lodged<br />
with TRMF during the year:<br />
Summary of claims lodged with the Tasmanian Risk Management Fund in 2012–13<br />
Item<br />
Debts Written Off<br />
Number<br />
of claims<br />
Total value<br />
of claims $<br />
General property 7 12,026,530<br />
General liability 9 193,803<br />
Motor vehicle 29 39,183<br />
Personal accident (for students engaged in workplace learning activities and volunteers) 1 36,450<br />
Transit/removal 2 1,150<br />
Total 48 12,297,116<br />
Property protection scheme<br />
Summary of claims for 2012–13<br />
Number of claims lodged 435<br />
Total value of claims $1,876,707<br />
Highest valued claim $54,536<br />
Number of sites lodging claims 134<br />
Average cost per claim $4,314<br />
Category Number of debts Amount $<br />
Minor debts up to $50 13,039 66,710.71<br />
Minor debts between $50 and $500 880 129,547.34<br />
Debts over $500 22 16,738.20<br />
Subtotal 13,941 212,996.25<br />
School debt write-offs 127,042.42<br />
Total 13,941 340,038.67<br />
Required Reporting » Loss and Damage and Debts Written Off<br />
83
Major Capital Projects<br />
Summary of<br />
major capital<br />
projects<br />
completed<br />
during<br />
2012–13<br />
Capital Program<br />
Total cost<br />
$’000<br />
Capital Works Programs 29,727<br />
Total 29,727<br />
List of<br />
individual<br />
major capital<br />
projects<br />
completed<br />
during<br />
2012–13<br />
Site Project Total cost<br />
$’000<br />
Bridport Primary School Extension of existing multi-purpose hall 2,000<br />
Campbell Town Child Care Centre Construction of a new child care centre 1,000<br />
Former Rocherlea Primary School Demolition of school buildings 274<br />
Former Roseneath Primary School Demolition of school buildings 445<br />
Local Schools Working Together Construction of the Sustainability Learning Centre at Mount Nelson 2,980<br />
Port Sorell Primary School Development of new primary school at Port Sorell 13,000<br />
Post Year 10 Reforms<br />
Riverside High School<br />
Upgrading of facilities used by the Tasmanian Polytechnic and<br />
Tasmanian Academy<br />
Upgrades to gymnasium floor, refurbishment of a teaching kitchen<br />
and minor works to school canteen<br />
Skills Tasmania Redevelopment of 26 Bathurst Street, Hobart 899<br />
Snug Primary School Construction of new classrooms 615<br />
South Hobart Primary School Relocation of transportable classrooms 320<br />
Teacher residences<br />
Bathroom, heating, wiring, plumbing and window upgrades for<br />
teacher residences on the West Coast<br />
Total 29,727<br />
7,770<br />
224<br />
200<br />
84 Required Reporting » Major Capital Projects
List of<br />
individual<br />
ongoing<br />
major capital<br />
projects<br />
Site Project Estimated<br />
total cost<br />
$’000<br />
Bridgewater and<br />
Geeveston Child<br />
and Family Centre 1<br />
Bellerive Primary<br />
School<br />
Child and family<br />
centres 2<br />
Community<br />
Knowledge Network<br />
(CKN) Projects 3<br />
Dodges Ferry<br />
Primary School<br />
Former Claremont<br />
High School<br />
High Street<br />
Launceston<br />
Miandetta<br />
Primary School<br />
Renewing Our<br />
<strong>Education</strong> System<br />
Taroona High and<br />
Primary Schools<br />
Trade Training<br />
Centres 5<br />
Waimea Heights<br />
Primary School<br />
Construction of new child and family centres<br />
with a focus on the Aboriginal community<br />
at Bridgewater and Geeveston<br />
Estimated cost<br />
to complete<br />
$’000<br />
Estimated<br />
completion<br />
year<br />
5,000 741 2013<br />
Refurbishment of administration block 521 231 2013<br />
Development of 11 child and family centres:<br />
Beaconsfield, Burnie, Chigwell, Clarence Plains,<br />
East Devonport, Derwent Valley, George Town,<br />
Queenstown, Ravenswood, Risdon Cove, St Helens<br />
34,493 3,300 2014<br />
Development of new LINCs to be located at<br />
11,000 3,139 2014<br />
Queenstown, Scottsdale and George Town 4<br />
Construction of two additional Kindergarten<br />
learning areas and support rooms<br />
800 776 2014<br />
Demolition of school buildings 550 550 2013<br />
General refurbishment 700 700 2013<br />
Development of a dual integrated<br />
Kindergarten centre and construction of<br />
an additional general learning area<br />
800 787 2013<br />
Capital support for school amalgamations 1,165 1,165 2014<br />
Traffic management improvements 300 270 2014<br />
Construction of new trade training centres<br />
for the Break O’Day, Bridgewater, Circular<br />
Head, Deloraine, Dorset, George Town, Huon<br />
Valley, Sorell and Triabunna communities<br />
13,745 123 2013<br />
Construction of a double Kindergarten facility 950 878 2014<br />
Total 69,024 11,660<br />
1. tagara lia (Bridgewater) opened in July 2012 and staged construction on wapraparatee (Geeveston) is continuing and expected to be completed in July 2013.<br />
2. A total of six state government funded child and family centres were open by the end of 2011 – Beaconsfield, Clarence Plains, Ravenswood, East Devonport,<br />
Break O’Day (St Helens) and the West Coast (Queenstown). Other centres in Burnie, Chigwell and the Derwent Valley were completed during 2012–13.<br />
The state also contributed $1.067m to the Tasmanian Aboriginal Centre (TAC) Children’s Centre at Risdon Cove. A date for the completion of the centre<br />
at George Town is not available at this stage.<br />
3. Now referred to as LINC Tasmania.<br />
4. The LINC at Queenstown is part of the West Coast Community Hub which was officially opened in September 2011. Scottsdale LINC was officially<br />
opened in May 2013. A date for the completion of the LINC at George Town is not available at this stage.<br />
5. George Town, Dorset, Bridgewater, Break O’Day, Circular Head and Huon Valley centres are completed. Sorell and Triabunna will be completed<br />
during 2013.<br />
Required Reporting » Major Capital Projects<br />
85
Contracts and Tenders<br />
The Department of <strong>Education</strong> ensures that Tasmanian businesses are given every opportunity to compete for agency business, and supports<br />
Tasmanian businesses whenever they offer best value for money for the government.<br />
Summary of participation by local businesses: contracts >$50,000 (ex GST)<br />
(including consultancies)<br />
Totals<br />
Total number of contracts awarded 55<br />
Total number of contracts awarded to Tasmanian businesses 48<br />
Total value of contracts awarded $22,990,707<br />
Total value of contracts awarded to Tasmanian businesses $20,845,774<br />
Total number of tenders called and/or quotation processes run 43<br />
Total number of bids and/or written quotations received 265<br />
Total number of bids and/or written quotations received from Tasmanian businesses 242<br />
Contracts >$50,000<br />
Information and communication technology<br />
Contractor Location Description Period of<br />
contract<br />
FYB Pty Ltd Williamstown, Victoria Supply of TRIM licences, support<br />
and ongoing maintenance<br />
Value of<br />
contract $<br />
07/13 – 06/18 969,000<br />
Total 969,000<br />
<strong>Education</strong> content and service delivery<br />
Contractor Location Description Period of<br />
contract<br />
Griffith Institute for<br />
<strong>Education</strong> Research<br />
Griffith Institute for<br />
<strong>Education</strong> Research<br />
Nathan, Queensland<br />
Nathan, Queensland<br />
Development and implementation of the<br />
Principals as Literacy Leaders program<br />
Development and implementation of the<br />
Secondary Principals as Literacy Leaders program<br />
Value of<br />
contract $<br />
01/13 – 12/13 270,586<br />
01/13 – 12/13 247,472<br />
University of Tasmania Sandy Bay, Tasmania Action research (Year 5–8 Project) 01/13 – 12/13 100,000<br />
Aged & Community<br />
Services Tasmania<br />
Hobart, Tasmania<br />
Industry and Indigenous Skill Centre<br />
infrastructure projects<br />
Tasmanian Aboriginal Centre Hobart, Tasmania Industry and Indigenous Skill Centre<br />
infrastructure projects<br />
Northern Job Link Launceston, Tasmania Industry and Indigenous Skill Centre<br />
infrastructure projects<br />
Royal Tasmanian<br />
Botanical Gardens<br />
Training Opportunities &<br />
Options for Learning<br />
Hobart, Tasmania<br />
Cambridge, Tasmania<br />
Industry and Indigenous Skill Centre<br />
infrastructure projects<br />
Industry and Indigenous Skill Centre<br />
infrastructure projects<br />
01/13 – 12/13 392,400<br />
01/13 – 12/13 392,400<br />
01/13 – 12/13 165,825<br />
01/13 – 12/13 390,000<br />
01/13 – 12/13 102,010<br />
Workskills Incorporated Bridgewater, Tasmania Skills Quip 2013 – Certificate 1 and 11 in Business 01/13 – 12/13 75,120<br />
Youth Futures Invermay, Tasmania Skills Quip 2013 – Certificate 1 and<br />
11 in Construction Pathways<br />
01/13 – 12/13 72,400<br />
Avidity Waverley, Tasmania Skills Quip 2013 – Certificate 1 in Business 01/13 – 12/13 62,500<br />
Oak Tasmania Glenorchy, Tasmania Skills Quip 2013 – Certificate 1 in Digital Media 01/13 – 12/13 58,950<br />
Allie Investments Pty Ltd Bellerive, Tasmania Skills Quip 2013 – Certificate 111<br />
in Cleaning Operations<br />
01/13 – 12/13 56,000<br />
National Joblink Launceston, Tasmania Skills Quip 2013 – Certificate 11 in Automotive 01/13 – 12/13 76,800<br />
Campbell Page Ltd Moonah, Tasmania Skills Quip 2013 – Certificate 11 in Business 01/13 – 12/13 51,000<br />
Pearson Research<br />
and Assessment<br />
Nunawading, Victoria National Assessment Program – Literacy and Numeracy 01/13 – 12/14 1,872,342<br />
Total 4,385,805<br />
86 Required Reporting » Contracts and Tenders
Building and construction<br />
Contractor Location Description Period of<br />
contract<br />
Value of<br />
contract $<br />
Cunic Constructions Pty Ltd Mornington, Tasmania 26 Bathurst Street internal refurbishment 08/12 – 10/13 640,000<br />
Fairbrother Pty Ltd Launceston, Tasmania Construction of Deloraine Trade Training Centre 09/12 – 02/14 790,923<br />
B.H. Apartments Pty Ltd Bridport, Tasmania Flinders Island District High School – demolition<br />
and replacement of grounds shed<br />
Maveric Builders Pty Ltd Kingston, Tasmania Geeveston Child and Family Centre<br />
– construction works stage 2<br />
Earl Macgregor Greenaway<br />
t/a Vic State Demolition<br />
Crossroad Civil<br />
Contracting Pty Ltd<br />
Wyatt Holdings (Tas) Pty Ltd<br />
t/a Wyatt Constructions<br />
Avenel, Victoria<br />
Rocherlea Primary School – demolition and removal<br />
of the former school buildings and infrastructure<br />
Rocherlea, Tasmania East Launceston Primary School –<br />
resurfacing of courtyard<br />
Kingston, Tasmania<br />
Rosny College – refurbishment of<br />
kitchen and science laboratories<br />
Hazell Bros Group Derwent Park, Tasmania Demolition and repatriation of former<br />
Roseneath Primary School site<br />
Vos Construction &<br />
Joinery Pty Ltd<br />
Kingston, Tasmania<br />
Construction of South East Trade Training<br />
Centre (Sorell and Triabunna)<br />
Cunic Constructions Pty Ltd Mornington, Tasmania Relocation of demountable classroom<br />
building from Bridgewater to Cygnet<br />
Fairbrother Pty Ltd Devonport, Tasmania Latrobe Primary School – replacement<br />
of timber flooring<br />
Maveric Builders Pty Ltd Kingston, Tasmania Bellerive Primary School – redevelopment<br />
of administration area<br />
09/12 – 11/13 162,000<br />
09/12 – 12/13 1,047,398<br />
10/12 – 12/13 204,300<br />
11/12 – 07/13 107,010<br />
11/12 – 01/14 467,126<br />
12/12 – 02/14 425,651<br />
01/13 – 10/14 1,786,410<br />
12/12 – 02/14 129,226<br />
04/13 – 06/14 112,455<br />
04/13 – 08/14 448,886<br />
T&T Toxic Summerhill, Tasmania Winnaleah District School – soil replacement 04/13 – 05/14 69,000<br />
Masters Contracting Pty Ltd North Hobart, Tasmania Hobart College – Block E water heater upgrade 05/13 – 09/14 238,729<br />
Venarchie Contracting Pty Ltd Mowbray, Tasmania Midway Point Kindergarten – car park modification 07/13 – 08/14 153,050<br />
Stubbs Constructions Pty Ltd Wivenhoe, Tasmania Miandetta Primary School – alterations and additions 07/13 – 10/14 553,370<br />
Total 7,335,534<br />
Required Reporting » Contracts and Tenders<br />
87
Other<br />
Contractor Location Description Period of<br />
contract<br />
Lazaro Pty Ltd Launceston, Tasmania Bridgewater Child and Family<br />
Centre – cleaning services<br />
Value of<br />
contract $<br />
07/12 – 06/17 78,400<br />
OfficeMax Australia Ltd Derwent Park, Tasmania Provision of washroom paper products 11/12 – 10/17 1,500,000<br />
Lazaro Pty Ltd Launceston, Tasmania Beaconsfield Child and Family<br />
Centre – cleaning services<br />
10/12 – 09/17 124,350<br />
Cambridge Painting Services Devonport, Tasmania Mowbray Heights Primary School – painting services 10/12 – 09/17 70,310<br />
Personnel Options<br />
and Solutions<br />
Sorell, Tasmania Chigwell Child and Family Centre – cleaning services 10/12 – 09/17 99,250<br />
Biniris (Aust) Pty Ltd Hobart, Tasmania Rosebery Sports Centre – cleaning services 10/12 – 09/17 136,422<br />
Island Recreation Cambridge, Tasmania Provision of playground softfall 10/12 – 09/17 350,000<br />
K J Padgett and Company Scottsdale, Tasmania Provision of playground softfall 10/12 – 09/17 1,000,000<br />
Barwick Landscape Supplies Granton, Tasmania Provision of playground softfall 10/12 – 09/17 1,000,000<br />
Mark Camino (All Painting) West Launceston, Tasmania St Helens District High School – painting services 10/12 – 09/17 64,960<br />
Mark Camino (All Painting) West Launceston, Tasmania Queechy High School – painting services 11/12 – 10/17 58,300<br />
Ricky Bannon Painting Launceston, Tasmania Cressy District High School – painting services 11/12 – 10/19 80,000<br />
Lazaro Pty Ltd Launceston, Tasmania Burnie Child and Family Centre – cleaning services 01/13 – 12/17 271,130<br />
Medimobile Pty Ltd Spring Hills, Queensland Seasonal Influenza Vaccination Program 02/01 – 12/13 66,500<br />
Aintree Contracting Pty Ltd Rosny, Tasmania Electrical Test and Tag Program 02/01 – 01/06 1,533,040<br />
Personnel Options<br />
and Solutions<br />
Sorell, Tasmania<br />
Derwent Valley Child and Family<br />
Centre – cleaning services<br />
02/13 – 01/18 99,250<br />
Programmed Property Services Derwent Park, Tasmania Riverside High School – painting services 03/13 – 02/18 89,485<br />
Saunders Signs Margate, Tasmania TasTAFE signage 05/13 – 07/13 83,076<br />
Scottsdale Cleaning Services Scottsdale, Tasmania Scottsdale LINC – cleaning services 05/13 – 04/18 116,185<br />
SG Fleet (Australia) Pty Ltd Hobart, Tasmania Provision of lease equipment facility 07/13 – 06/20 3,000,000<br />
Australian Postal Corporation Melbourne, Victoria Provision of external mail distribution services 07/13 – 06/18 387,075<br />
Total 10,207,733<br />
Contracts for consultancies >$50,000<br />
Building and construction<br />
Contractor Location Description Period of<br />
contract<br />
M2 Architecture North Hobart, Tasmania Architectural consultancy services for the construction<br />
of a Kindergarten at Waimea Heights Primary School<br />
Value of<br />
contract $<br />
04/13 – 12/14 92,635<br />
Total 92,635<br />
Other 1<br />
Contractor Location Description Period of<br />
contract<br />
Value of<br />
contract $<br />
Total 0<br />
1. There were no ‘Other’ contracts for consultancies >$50,000 in 2012–13.<br />
Summary of total costs of contracts awarded >$50,000<br />
Item Total cost $<br />
Information and communications technology 969,000<br />
<strong>Education</strong>al content and service delivery 4,385,805<br />
Building and construction (including consultancies) 7,428,169<br />
Other (including consultancies) 10,207,733<br />
Total 22,990,707<br />
88 Required Reporting » Contracts and Tenders
Superannuation Certificate<br />
“I, Colin Pettit, hereby certify that the Department of <strong>Education</strong> has met its obligations under the<br />
Superannuation Guarantee (Administration) Act 1992 of the Commonwealth in respect of any employee who<br />
is a member of a complying superannuation scheme to which the Department of <strong>Education</strong> contributes.”<br />
Colin Pettit<br />
Secretary<br />
Required Reporting » Superannuation Certificate<br />
89
Other Annual Reports<br />
Tasmanian Library Advisory Board Annual Report<br />
On behalf of the Tasmanian Library Advisory Board (TLAB), I am pleased to submit the 27 th annual report of the board as required under<br />
the Libraries Act 1984 as amended in 2000.<br />
Role and<br />
structure<br />
The statutory role of the TLAB, as defined by the<br />
Libraries Act 1984, is to advise the Minister for <strong>Education</strong><br />
and Skills, and the Secretary of the Department of<br />
<strong>Education</strong> on matters relevant to the provision of public<br />
library services in Tasmania. The Libraries Amendment Act<br />
2000 extended the membership structure to provide<br />
a wide representation from the Tasmanian community,<br />
comprising a mix of rural and urban interests.<br />
The current board was appointed on 1 January 2012 until<br />
31 December 2013.<br />
Board<br />
membership<br />
Ministerial nominees:<br />
Ms Mary Bent (Chair)<br />
Ms Donna Bain<br />
Dr Mark Briggs<br />
Ms Sue Chapple<br />
Ms Jen Fitzgerald<br />
Ms Beverley Jennings<br />
Ms Kate Mollison (resigned 22 June 2013)<br />
Dr Dianne Snowden<br />
Local Government Association of Tasmania<br />
nominees:<br />
Mr Stephen Brown<br />
Mayor Tony Foster OAM JP (resigned 22 November 2012)<br />
Alderman Sandra French<br />
Alderman Doug Chipman<br />
Councillor Susan Nolan (appointed 7 May 2013)<br />
Nominee of the Secretary of the<br />
Department of <strong>Education</strong>:<br />
Ms Jenny Rayner, Director, LINC Tasmania<br />
Board<br />
meetings<br />
The board held four meetings during 2012–13 in:<br />
• Launceston on 13 September 2012<br />
• Bridgewater on 6 December 2012<br />
• Hobart on 7 March 2013 and 20 June 2013.<br />
Major issues<br />
considered by<br />
the board<br />
Leisure and Lifestyle program<br />
The Leisure and Lifestyle program was a major topic of<br />
discussion in 2012–13. The board is very supportive<br />
of lifelong learning and recognises that informal and<br />
recreational learning has an important place in community<br />
life. However, the board has endorsed the government’s<br />
budget decision of 2010–11 to give greater priority to<br />
courses that lead to increased skills or employability,<br />
and place leisure and recreational classes on a cost<br />
recovery footing. The board is concerned that the<br />
program’s declining enrolment base is affecting its viability<br />
and may impact adversely on LINC Tasmania’s other<br />
priorities and its reputation.<br />
eBooks<br />
LINC Tasmania’s eBook holdings continue to steadily<br />
increase. Circulation figures suggest that eBooks are<br />
replacing print for some clients. The board endorses<br />
LINC Tasmania’s continued active contribution to national<br />
strategies being developed by the Australian Library and<br />
Information Association (ALIA) and National and State<br />
Libraries Australasia (NSLA) that: promote the extension<br />
of public lending right royalties to eBook authors to<br />
ensure that authors receive a fair return for eBooks;<br />
encourage the extension of purchase/subscription options;<br />
and collaborate on ventures designed to encourage<br />
publishers to engage with this format.<br />
Modernising Tasmania’s Archives and<br />
Libraries legislation<br />
The board provided a formal submission in May 2013<br />
in response to the Modernising Tasmania’s Archives and<br />
Libraries legislation consultation paper. This paper outlined<br />
recommendations for amendments to the current<br />
legislation which governs Tasmania’s public library<br />
and archives services, the Libraries Act 1984, and the<br />
Archives Act 1983. The board also received a briefing<br />
on stakeholder feedback received by LINC Tasmania in<br />
response to the consultation paper.<br />
In its submission to the consultation, the board expressed<br />
its support for LINC Tasmania and for the expanded role<br />
it has taken up since the Libraries Act 1984 was drafted.<br />
LINC Tasmania is a leading example of how a state<br />
library service can meet the challenges of library<br />
provision in contemporary society and adapt its services<br />
and priorities to remain relevant in this digital age.<br />
The board is also aware that since the creation of<br />
the Tasmanian Archive and Heritage Office there has<br />
been increased collaboration and consistency across<br />
the archive, heritage and reference sections of the<br />
LINC Tasmania service. This is welcome and establishes<br />
a strong foundation for future rationalisation of roles<br />
and processes.<br />
The revisions of the legislation proposed through this<br />
process will assist it to meet these challenges.<br />
90 Required Reporting » Other Annual Reports
Regional Services Network<br />
Of the five planned regional LINCs, three are now<br />
operational (Bridgewater, Scottsdale and<br />
Queenstown/West Coast Hub) with one still in the<br />
planning phase (George Town). The Sorell LINC was<br />
deferred as part of the savings in Capital Investment<br />
Projects required in the state budget 2011–12.<br />
The board toured the new Bridgewater LINC facilities<br />
during their December 2012 meeting. The TLAB chair<br />
and two board members attended the opening of<br />
Scottsdale LINC on 1 May 2013.<br />
The board continues to support the George Town<br />
hub proposal based on the many benefits it will bring<br />
to the community, and is hopeful that the project will<br />
proceed to implementation.<br />
26TEN and LINC Tasmania literacy services<br />
The chair attended the launch of the 26TEN strategy in<br />
October 2012. 26TEN aims to raise community awareness<br />
and encourage organisations and individuals to work<br />
together to improve adult literacy in Tasmania.<br />
The board strongly supports this initiative, which it<br />
considers to be leading the nation in its strategy and vision.<br />
The board is keen to collaborate with the Adult Literacy<br />
Coalition of Interest on any projects of mutual interest.<br />
LINC Tasmania budget<br />
The board remained concerned about the impact of budget<br />
constraints on the services delivered by LINC Tasmania.<br />
The board was of the view that with a number of cost<br />
saving measures already implemented to date, there are<br />
major challenges for the organisation to deliver further<br />
efficiencies without impact on service provision.<br />
The board emphasised the importance of a strategic<br />
approach to any proposed changes in service delivery<br />
which may result from future budget challenges, in order<br />
to retain the integrity of the service as a whole.<br />
The board remains committed to previous arguments<br />
put forward for increases to the ‘Bookvote’ and was<br />
disappointed that this could not be delivered in the<br />
2013–14 Tasmanian Budget. It will continue to argue for<br />
this as a priority to address the growing range of resource<br />
formats and client groups that need to be included in the<br />
library acquisitions program.<br />
Re-imagining reference services<br />
Reviewing and ‘re-imagining’ reference services is an<br />
ongoing process for LINC Tasmania as new technology<br />
continues to effect rapid changes in the way individuals<br />
seek and use information.<br />
The board is very supportive of LINC Tasmania’s<br />
commitment to the national Re-imagining Libraries<br />
Strategy which aims to fundamentally re-shape reference<br />
collections and services to meet the changing needs of<br />
clients and embrace new opportunities in combined<br />
service delivery.<br />
The board is also aware of the importance of<br />
LINC Tasmania’s review of its Reference Collection<br />
Development Policy. This review will ensure that the<br />
acquisition of reference materials reflects the changing<br />
preference of clients for digital formats over print.<br />
Meetings<br />
with the<br />
Minister<br />
During the year the Minister was periodically briefed on<br />
the activities of the board and major issues concerning<br />
the provision of LINC Tasmania services in this state.<br />
The chair met with the Minister for <strong>Education</strong> and Skills,<br />
Hon Nick McKim MP on several occasions during 2012–13.<br />
Board<br />
operations<br />
On behalf of the board, I would like to sincerely thank<br />
board members, past and present, for their commitment<br />
and voluntary contribution to the business of TLAB.<br />
As dedicated members of the board, the interests of<br />
LINC Tasmania and the Tasmanian community as a whole<br />
have been well-served.<br />
I would also like to acknowledge the contributions from<br />
a range of LINC Tasmania staff who provide the board<br />
with professional expertise and comprehensive briefing<br />
papers for each meeting. I also acknowledge and<br />
thank LINC Tasmania’s support staff who manage the<br />
practicalities of the meeting schedule so efficiently.<br />
TLAB looks forward to continuing its productive<br />
relationship with LINC Tasmania, particularly as it<br />
evolves, innovates, and employs new technologies in<br />
an increasingly digital environment. The financial<br />
challenges faced by the Tasmanian Government and<br />
indeed LINC Tasmania mean that the service network<br />
must be sustainable; in order to continue to provide<br />
Tasmanians with access to opportunities for skills<br />
development, and to the information they need to<br />
function effectively in the 21st century.<br />
Mary Bent<br />
Chair<br />
Required Reporting » Other Annual Reports<br />
91
State Library and Archives Trust Annual Report<br />
I am pleased to submit the 28 th annual report of the State Library and Archives Trust (SLAT). The Trust is required by the Libraries Act 1984<br />
to administer any property acquired by the Trust through gift, bequest or device for the advancement of library and/or archives knowledge<br />
in Tasmania. The Trust awards grants and, on occasions, travelling scholarships aimed at assisting the professional development of librarians,<br />
archivists, and library and archives workers.<br />
Conferences<br />
and seminars<br />
Tasmanian librarians, archivists and library workers<br />
have attended, with the support from the Sir John<br />
Morris Memorial Trust Fund, a number of professional<br />
development conferences and workshops in 2012–13<br />
including, among others:<br />
• ALIA Biennial 2012 Conference, Sydney, July 2012.<br />
• International Congress on Archives, Brisbane,<br />
August 2012.<br />
• Australia Law Librarian’s Conference, Brisbane,<br />
August 2012.<br />
• Art Libraries Society Australia and New Zealand 2012<br />
Conference, Melbourne, September 2012.<br />
• New Cataloguing Code Resource Description and<br />
Access, Canberra, October 2012.<br />
• Measuring and Improving Library Value Conference,<br />
Sydney, November 2012.<br />
• ALIA Information Online 2013, Brisbane,<br />
February 2013.<br />
• 6 th New Librarians’ Symposium, Brisbane,<br />
February 2013.<br />
Twenty applications were funded by the Sir John Morris<br />
Memorial Trust Fund for the 2012–13 year in accordance<br />
with the Trust Deed. The total amount of grant funding<br />
awarded was $18,674. This represents a decrease from<br />
last year’s grant allocation of $31,912 which was shared<br />
across 31 applicants. The decrease reflects a decline in<br />
interest earned on the capital investment, and the Trust’s<br />
concern to maintain the investment to a level that will<br />
preserve its goals and objectives for the longer term.<br />
The successful applicants prepared reports on their<br />
activities and also made presentations to gatherings of<br />
library and archives professionals in order to share the<br />
knowledge gained through their participation. All reports<br />
are available on request from the secretary of the Trust.<br />
Through the assistance provided for these activities,<br />
the Trust has continued to help raise the skills and<br />
knowledge of library and archives workers throughout<br />
Tasmania.<br />
Travelling<br />
scholarships<br />
The Trust did not offer a Sir John Morris Memorial Trust<br />
Travelling Scholarship in 2012–13.<br />
TM Crisp<br />
Memorial<br />
Sporting<br />
Library Fund<br />
The Trust also administers the TM Crisp Memorial<br />
Sporting Library Fund, which provides grants for the<br />
purchase of sporting books for public and reference<br />
libraries. The sum of $700 was made available from the<br />
fund to the State Library in 2012–13 for the purchase of<br />
books on sporting pursuits, including cricket, tennis and<br />
other popular sporting activities.<br />
Kula Bequest<br />
Fund<br />
In 2012–13 a sum of $3,700 was made available to the<br />
State Library for the first time, after SLAT became<br />
administrators of the Kula Bequest Fund in the previous<br />
financial year. This fund stipulates that the yearly income<br />
of the trust fund is utilised to purchase works of foreign<br />
fiction subsequently published in English.<br />
Meetings and<br />
funds<br />
Three ordinary meetings of SLAT were held during<br />
the reporting year: in August and November 2012,<br />
and May 2013.<br />
The Trust is now reliant on utilising safer bank-managed<br />
funds to grow its assets for investment in the continued<br />
professional development of library and archives workers<br />
across the state, while retaining the required Consumer<br />
Pricing Index to maintain assets over time, and has<br />
exercised prudence and equity with the distribution<br />
of Trust funds. This strategy has seen the investment<br />
conservatively grow over the current year, with minimal<br />
losses occurring with the divestment of one investment<br />
portfolio remaining from 1999 through Shadforths<br />
Financial Services. The Trust will now consider funding<br />
applications for each coming six month period at meetings<br />
held in May and November.<br />
I would like to express my sincere appreciation to each<br />
of the members of the State Library and Archives Trust,<br />
Ms Simone Bingham of the University of Tasmania;<br />
Mr Duncan Hall of the Public Trustee, Mr Ross Latham,<br />
State Archivist; and Ms Jenny Rayner, Director, LINC<br />
Tasmania, for their ongoing dedication and contribution to<br />
the success of the Trust, and to thank Ms Suzi Ransom for<br />
her support throughout the year in the role of Secretary.<br />
Mary Bent<br />
Chair<br />
92 Required Reporting » Other Annual Reports
Allport Library and Museum of Fine Arts Annual Report<br />
The mission of the Allport Library and Museum of Fine Arts (ALMFA) is to ensure that the bequest which Henry Allport made in 1965 is<br />
highly valued and enjoyed by its beneficiaries, the people of Tasmania, and is recognised for its major contribution to Australia’s heritage.<br />
The objectives and principles which support that mission are:<br />
• providing maximum access to the collection within the limits of preservation and security considerations<br />
• maintaining the highest standards in collection development and service<br />
• encouraging the Tasmanian community to participate in the development and preservation of the collection.<br />
Exhibitions<br />
and displays<br />
National Year of Reading – exhibition<br />
An exhibition was held from July to September to coincide<br />
with the National Year of Reading in 2012. Printmaking<br />
group Hunter Island Press exhibited Reading Tasmanians:<br />
An Interpretation which saw each printmaker choose a text<br />
by a Tasmanian author to inspire their work.<br />
North Lyell Mine Disaster – exhibition<br />
October 2012 marked 100 years since Tasmania’s worst<br />
mining disaster in Queenstown. The Tasmanian Archive<br />
and Heritage Office (TAHO) hold the majority of the<br />
Mount Lyell Mining and Railway Company records,<br />
and an exhibition was planned to coincide with the<br />
Queenstown Heritage & Arts Festival. So many voices<br />
lost to us: North Lyell Mine Disaster 1912 was opened on<br />
4 October 2012. Both the Queenstown community and<br />
local clients expressed positive opinions about the display,<br />
with comments such as “very powerful”, “humanness in<br />
this exhibition really good to see”, “superb”, “excellent<br />
exhibition”.<br />
Come to Tasmania the Wonderland –<br />
poster exhibition<br />
A travelling version of the poster exhibition, Come to<br />
Tasmania the Wonderland was developed to enable other<br />
LINCs across the state (Huon LINC, Devonport LINC<br />
and Launceston LINC) to display reproductions of the<br />
posters locally.<br />
Thylacine Exhibition<br />
The photographic and text based mixed media exhibition<br />
Like Something Which I’ve Never Seen was opened on<br />
28 February 2013. It was the result of collaboration<br />
between local photographer Rachael Duncan and<br />
writer Emily Bullock, examining the culture surrounding<br />
twentieth century thylacine sightings in Tasmania.<br />
The exhibition included documentary material and<br />
Thylacine prints from TAHO.<br />
Collaboration with the Queen Victoria<br />
Museum and Art Gallery<br />
The Convict Stain: Vice, Virtue & John West was developed<br />
by the Queen Victoria Museum and Art Gallery and<br />
displayed in Launceston throughout 2012. It was then<br />
modified as a travelling exhibition, with additional objects<br />
from the TAHO collections included in the Hobart display.<br />
It coincided with the 160 year anniversary of the end of<br />
convict transportation to Van Diemen’s Land in 1853.<br />
Merchandise<br />
Tasmanian linocuts by Curzona Frances Louise Allport<br />
were reproduced as prints for sale as merchandise.<br />
Access<br />
There were 8,682 visitors in 2012–13, representing a<br />
10% decrease from 2011–12. However, 2011–12 saw<br />
particularly high visitor numbers. Visitor trends over the<br />
longer 2011–12 to 2012–13 period still demonstrate a 35%<br />
increase on the 2009–10 to 2010–11 period.<br />
Visits and tours were held throughout the year from<br />
groups including the Tasmanian Museum and Art Gallery<br />
volunteer guides, Heritage Tasmania staff, several Probus<br />
clubs, Friends of the Newcastle Gallery and schools<br />
including Mt Carmel College, Lenah Valley Primary School<br />
and Albuera Street Primary School.<br />
Publicity and<br />
promotion<br />
Items from the Allport Library and Museum of Fine Arts<br />
collection were reproduced in 2012–13 in a wide range of<br />
books, reports, brochures, signs, exhibitions and television<br />
and film documentaries. The collection and exhibition<br />
program was also promoted widely in the media:<br />
• Mercury newspaper article ‘Mining Horror<br />
100 Years Ago’, 5 October 2012<br />
• ABC Local News, 7 October 2012,<br />
‘Disaster Centenary’<br />
• Australian Mining, ‘Mount Lyell Disaster questioned’,<br />
by Vicky Validakis, 8 October 2012<br />
• 936 ABC Radio interview with Ross Latham and<br />
Louise Saunders, 9 October 2012<br />
• ABC News 24 (National) coverage of<br />
‘Disaster Centenary’ news story<br />
• Promotion of North Lyell Mine Disaster exhibition<br />
on Edge Radio (University radio station)<br />
• Mercury newspaper article, ‘Allport Buys Errington<br />
art’, on the acquisition of colonial works by Eliza<br />
Errington from the Ruth and John Clemente auction,<br />
November 2012<br />
• So many voices lost to us and Allport Colonial Gallery<br />
listed in the Tasmanian Museum and Art Gallery<br />
‘Spring Gallery Guide’<br />
• Mercury newspaper article, ‘A tragedy not to be<br />
forgotten’, review of So many voices lost to us by<br />
Clyde Selby, 1 December 2012<br />
• Mercury newspaper article, ‘Celebrating yesteryear’,<br />
article on Curzona Frances Louise Allport prints<br />
recently reproduced, 23 February 2013<br />
• Mercury newspaper article, ‘Like somebody that we<br />
use to know’, article by Kane Young on the exhibition<br />
Like Something Which I’ve Never Seen, 1 March 2013<br />
Required Reporting » Other Annual Reports<br />
93
• 936 ABC Radio, Like Something Which I’ve Never Seen<br />
interview with Rachael Duncan and Emily Bullock,<br />
27 February 2013<br />
• Mercury newspaper article, ‘Things that go bump in<br />
the night’, review of Like Something Which I’ve Never<br />
Seen by Clyde Selby, 6 April 2013<br />
• SBS National Television, Who Do You Think You Are,<br />
episode 5 Lex Marinos, interview with Caitlin Sutton,<br />
30 April 2013<br />
• 936 ABC Radio, ‘Your afternoon’, Jo Spargo, interview<br />
with Caitlin Sutton for Library and Information Week<br />
• The Australian, national newspaper, ‘Public Works’,<br />
article by Bronwyn Watson on William Buelow<br />
Gould’s Sketchbook of fishes, 8 June 2013<br />
• Short Film Screenings: Films from the TAHO<br />
collections are now being screened on a daily basis in<br />
the Allport Library and Museum of Fine Arts library<br />
• Website: The Allport Library and Museum of Fine<br />
Arts web presence has recently been enhanced,<br />
with a redeveloped webpage and increased<br />
use of social media: http://www.linc.tas.gov.au/<br />
tasmaniasheritage/popular/allport. The new webpage<br />
highlights treasures of the collection such as Gould’s<br />
Sketchbook of Fishes, including an animation of the<br />
book and information on its inclusion in the Australian<br />
Memory of the World Register. There is also a section<br />
for merchandise, information introducing the<br />
Allport family, a page dedicated to promotion of the<br />
Colonial Gallery, and links to the new Facebook page.<br />
Acquisitions<br />
of note<br />
Books<br />
• Andrews, C. A monograph of Christmas Island<br />
(Indian Ocean) 1900<br />
• Gilmour, Joanna Elegance in Exile: Portrait Drawings from<br />
Colonial Australia, 2012<br />
• Hamerton, Philip Gilbert, Landscape, 1885<br />
• Wilson, Ian J, Record of fish killed at the Great Lake<br />
Tasmania, 2012<br />
• Reading Tasmanians: An Interpretation, exhibition<br />
catalogue, 2012<br />
• Marsh’s Library, The New World: Books of Exploration and<br />
Discovery…2006<br />
• The Sydney Gazette and NSW Advertiser, 1965<br />
• Cruise, RA, Index by Nelly Bess to Journal of Ten Months’<br />
Residence… 2011<br />
• Art Gallery of Ballarat, Capturing Flora… 2012<br />
• Scrap album of Louis Agnew, son of the Premier of<br />
Tasmania, 1876-78<br />
• The original manuscript from which The journal of Mrs.<br />
Fenton : a narrative of her life in India, the Isle of France<br />
(Mauritius)… was published in 1901/Elizabeth Fenton.<br />
Objects<br />
• Two fishing rods belonging to Morton Allport,<br />
including licence and leather fly wallet.<br />
Fine Art<br />
• Three pencil sketches of Hobart with annotated notes<br />
by Frances Fearnley Rowntree (1892–1966) New<br />
Town Congregational Church, Tomb of Archdeacon<br />
Hutchins, St David’s Park (pencil sketch), Tomb of<br />
James Garden, c1930<br />
• Ambroise Tardieu (1788–1841) Geoffroy St Hilaire<br />
Stipple engraving, c1830<br />
• Isaac Robert Cruikshank (1789–1856) colour aquatint,<br />
1830<br />
• Elizabeth Errington, 11 annotated sketches of<br />
Port Arthur, 1840s<br />
• Unknown artist, old convict building, Sarah Island,<br />
watercolour, 1905<br />
• CFL Allport, Figures and white doves, c1920s<br />
• Captain Franklin RN… Engraved by WT Fry after<br />
T. Wageman<br />
• Evans, GW (attributed) Hobart Town published<br />
by J Souter<br />
• Southwest view of Hobart Town Engraved by<br />
Engelmann of GW Evans<br />
• Francis Russell Nixon, The Blowhole,<br />
Port Arthur, 1855<br />
• GTWB Boyes, [Mt Wellington, Hobart], c1840s<br />
• Hobartstown in Vandiemensland Hand coloured<br />
lithograph, c1825<br />
• William Buelow Gould [Dogs and Cats] pencil on<br />
card, c1830s<br />
• William Buelow Gould [Game Bird] pencil on<br />
card, c1830s<br />
• William Buelow Gould [Duck Shooting] pencil on<br />
card, c1830s<br />
• William Buelow Gould [Game Birds within a<br />
landscape] pencil on card, c1830s<br />
• William Buelow Gould [Fishing] pencil on card, c1830s<br />
• [View of Mt Direction overlooking Derwent River],<br />
watercolour, c1870s, artist unknown<br />
• JC Goodhard, Molle St Bridge, (first state and strike of<br />
an edition of 25), signed and numbered 1, c1928.<br />
Conservation<br />
The Management Committee continues to support<br />
the conservation and maintenance of the collection<br />
by allocating up to 25% of its annual income from<br />
the Endowment Fund and from interest earned for<br />
conservation treatments. In 2012–13 the committee<br />
funded:<br />
• treatment at Centre for Cultural Materials<br />
Conservation of an oil painting by Haughton Forrest;<br />
maintenance of watercolour collection<br />
• maintenance and servicing of Barclay Bracket and<br />
French Marble clocks<br />
• rehousing, conservation, and description of<br />
currency collection<br />
• cleaning of ceramics<br />
• repair to bookcase<br />
• improvement of hanging system to minimise damage<br />
to works and increase security in the Colonial Gallery.<br />
94 Required Reporting » Other Annual Reports
Staff<br />
Management Committee<br />
The Allport Library and Museum of Fine Arts<br />
Management Committee held three meetings in 2012–13,<br />
on 8 August 2012, 21 November 2012 and 28 March 2013.<br />
Membership of the committee comprised:<br />
• Mr Tim Bugg, Chair (nominated by the trustees<br />
of the estate of Henry Allport)<br />
• Ms Amanda Wojtowicz (nominated by the trustees<br />
of the estate of Henry Allport)<br />
• Dr AV (Tony) Brown, a Trustee of the Tasmanian<br />
Museum and Art Gallery (nominated by the<br />
Board of Trustees)<br />
• Mr Cobus Van Breda (appointed by the<br />
Minister for <strong>Education</strong>)<br />
• Ms Jenny Rayner, Director, LINC Tasmania<br />
(nominated by the Secretary of the<br />
Department of <strong>Education</strong>)<br />
• In April 2013 Caitlin Sutton was appointed<br />
permanently to the position of Librarian,<br />
Allport Library and Museum of Fine Arts.<br />
Towards the end of 2012 John Upcher completed his<br />
term as chair of the Allport Library and Museum of<br />
Fine Arts Management Committee. John was appointed<br />
chair in 1997. Both in that capacity and as a trustee of<br />
the Allport Trust over many years he has played a major<br />
role in ensuring the long term wellbeing of the collection.<br />
John has been, and continues to be a passionate and<br />
fearless supporter of the mission of the Allport Library<br />
and Museum of Fine Arts. The management committee is<br />
indebted to him for his significant contribution.<br />
Tim Bugg<br />
Chair<br />
Required Reporting » Other Annual Reports<br />
95
Tasmanian Home <strong>Education</strong> Advisory Council Annual Report (2012)<br />
Home education occurs when parents/guardians are formally recognised as conducting the child/ren’s learning program from a home<br />
base. Whilst they may purchase or borrow curriculum materials or learning resources, the responsibility for planning and implementing the<br />
educational program rests with the home educator. In Tasmania, parents/guardians who are home educating their children are required to<br />
register with the Tasmanian Home <strong>Education</strong> Advisory Council (THEAC).<br />
Role of<br />
THEAC<br />
THEAC was established by the Minister for <strong>Education</strong> to<br />
assist in the management and support of home education<br />
in Tasmania. The role of THEAC is to:<br />
• provide policy advice and information to the<br />
Minister in relation to home education<br />
• maintain a register of parents/guardians who are<br />
home educating<br />
• monitor the educational programs of children<br />
whose parent/guardian/s have applied for registration<br />
as home educators, and make appropriate<br />
recommendations to the Minister as a result of<br />
initial and periodic monitoring<br />
• provide a reference point for inquiries<br />
regarding home education<br />
• respond to community concerns about<br />
home education<br />
• maintain liaison with other agencies on<br />
matters regarding home education<br />
• organise ongoing support and assistance to<br />
home educators.<br />
Membership<br />
THEAC consists of six members appointed by the Minister for <strong>Education</strong>, three nominated by home educators and<br />
three nominated by the Minister for <strong>Education</strong>. Members for 2012 are detailed below.<br />
Member Comments From Until<br />
Ms Suzanne Pennicott-Jones Ministerial appointee – Department of <strong>Education</strong> 1/1/2012 31/12/2014<br />
Mr Peter Norton Ministerial appointee 1/1/2007 31/12/2012<br />
Mr Simon Deeth Ministerial appointee (chair 16/03/2009–31/3/2012) 1/5/2008 1/4/2012<br />
Ms Jacinta Sinclair Home educator nominee (chair from 1/4/2012) 1/8/2009 31/7/2015<br />
Mrs Keren Golab Home educator nominee 1/10/2009 30/9/2015<br />
Mrs Margaret Sonnemann Home educator nominee 1/10/2009 30/9/2015<br />
Employees<br />
THEAC employed two part-time administration officers,<br />
two part-time monitoring officers and a part-time financial<br />
officer during 2012.<br />
The key function of the administration officers is to<br />
provide administrative support to THEAC, including<br />
maintaining data, and to execute THEAC decisions.<br />
The key function of the monitoring officers is to assist<br />
THEAC in the monitoring of home education according to<br />
established policies and practices.<br />
The key function of the financial officer is to undertake<br />
payroll and accounting work.<br />
Contact details<br />
3 Dowling Street, Launceston, Tasmania 7250<br />
Phone/Fax: 6334 5381<br />
Email: admin@theac.org.au<br />
Website: www.theac.org.au<br />
Charter<br />
Context<br />
THEAC is responsible for monitoring new and ongoing<br />
home education programs for families who have<br />
registered for home education.<br />
Beliefs and values<br />
THEAC members believe that:<br />
• all children are entitled to receive an education<br />
that enables them to reach their potential, including<br />
children who are being home educated<br />
• home education is a viable educational option for<br />
many children<br />
• home education should continue to be recognised<br />
and supported as a legitimate option for education in<br />
Tasmania<br />
• monitoring should be unobtrusive and sensitive to<br />
differing beliefs and practices, and be undertaken in a<br />
spirit of collaboration, support and assistance<br />
• home educating parents/guardians should be free to<br />
choose from a wide variety of resources, commercial<br />
programs and curriculum materials in line with their<br />
educational values and beliefs<br />
• THEAC should not favour any particular home<br />
education program or curriculum materials.<br />
Operating principles<br />
The employees and members of THEAC operate<br />
according to the following principles:<br />
• maintain a non-intrusive and professional point of<br />
reference for all home education queries<br />
• ensure that all families registered with THEAC are<br />
adequately monitored in a collaborative manner<br />
according to THEAC procedures<br />
• maintain accurate records of matters pertaining to<br />
THEAC’s business<br />
• provide accurate and timely information and policy<br />
advice to the Minister.<br />
96 Required Reporting » Other Annual Reports
Report<br />
on council<br />
activities for<br />
2012<br />
Meetings<br />
THEAC conducted nine regular meetings during the year.<br />
The main function of the meetings was to consider the<br />
monitoring reports relating to home educators’ programs<br />
and new applications for home education. Two workshops<br />
were held to discuss the administration and management<br />
role and function of THEAC and to review and update<br />
policies and procedures.<br />
Ministerial liaison<br />
THEAC maintained liaison with the Minister for <strong>Education</strong><br />
throughout the year through the provision of minutes of<br />
meetings and email, mail and phone contact with his office.<br />
The three Learning Services within the Department of<br />
<strong>Education</strong> were provided with weekly updates of newly<br />
registered and ceasing home educating families.<br />
Registration and monitoring<br />
During 2012, the parents/guardians of 172 children were<br />
approved for registration as home educators through<br />
THEAC. Together with families with ongoing home<br />
education programs, monitoring reports for 404 children<br />
from 232 families were prepared. A total of 665 students<br />
from 350 families were registered with THEAC as at<br />
31 December 2012.<br />
Administration<br />
The administration officers continued to maintain<br />
administrative procedures for THEAC and support for<br />
home educators. The monitoring officers visited families<br />
statewide as requested by THEAC and presented<br />
reports on these families to THEAC for consideration.<br />
Staff engaged in professional development in archiving,<br />
cultural sensitivity and Asperger’s Syndrome, and all staff<br />
participated in a staff appraisal process.<br />
During 2012, two council members completed their<br />
service to home education in Tasmania as members of<br />
THEAC. Mr Peter Norton concluded six years of service.<br />
Mr Simon Deeth concluded four years of service, most of<br />
which was as chair of THEAC. Their valuable contribution<br />
was recognised with gratitude.<br />
Public and professional relations<br />
THEAC maintained liaison with various government<br />
departments in carrying out its support for home<br />
educators, including Department of <strong>Education</strong> legal<br />
advisors who provided ongoing advice on policy matters.<br />
THEAC continued to work with the Tasmanian eSchool<br />
in trialling courses for home educated students of<br />
secondary school age. Early success has been encouraging,<br />
and THEAC continues to work with the eSchool to seek<br />
ways to make this available and affordable for home<br />
educating families.<br />
THEAC continued to disseminate information both within<br />
the community at large and within the community of<br />
home educators throughout the state.<br />
Home educator get-together/information sessions were<br />
held in Ulverstone, Launceston and Hobart in November.<br />
All were well attended.<br />
After a competition within the Tasmanian home education<br />
community, THEAC adopted a new logo in April.<br />
The Minister approved the new THEAC website which<br />
went live in December.<br />
Policy<br />
THEAC reviewed and amended the policy on cancellation<br />
of registrations to ensure greater clarity, transparency and<br />
natural justice.<br />
Support for home educating families<br />
Development of the Australian Curriculum continued to be<br />
monitored to gauge any impact for home educators.<br />
Fifty home educated children registered for the 2012<br />
National Assessment Program for Literacy and Numeracy<br />
(NAPLAN).<br />
Four newsletters were published for home educators<br />
over the year. These newsletters provided information<br />
updates and were used to continue a supportive liaison<br />
between THEAC and home educators.<br />
THEAC initiated a project to seek financial assistance<br />
by way of discounts for goods and services for home<br />
educating families.<br />
Financial report<br />
THEAC employs a financial officer to prepare relevant<br />
financial documents with a THEAC member maintaining<br />
the Treasurer’s position. An audited financial report for<br />
the period July 2011 to June 2012 has been presented to<br />
the Minister for <strong>Education</strong>.<br />
Jacinta Sinclair<br />
Chair<br />
Required Reporting » Other Annual Reports<br />
97
Schools Registration Board Annual Report<br />
Establishment<br />
and function<br />
The Schools Registration Board (the board) was<br />
established on 1 July 1995 under Part 5 of the<br />
<strong>Education</strong> Act 1994. The board is an independent statutory<br />
body with its composition and powers defined under<br />
the Act and its supplementary Regulations. Its primary<br />
function is to ensure that non-government schools comply<br />
with the educational standards determined by the<br />
Minister for <strong>Education</strong> and Skills. In addition, it must assess<br />
and determine applications for:<br />
a) the registration of new non-government schools<br />
b) the registration of existing schools.<br />
Members<br />
Members of the board are appointed by the Minister (<strong>Education</strong> Act 1994 45 (1-3)) and as of 30 June 2013 included:<br />
Ms Jenny Cranston<br />
Chair<br />
Ms Judy Travers<br />
Department of <strong>Education</strong><br />
Mr Tony Crehan<br />
Organisations representing registered schools<br />
Mr Jon Hosford<br />
Organisations representing registered schools<br />
Ms Angela Briant<br />
Organisations representing teachers of registered schools<br />
Ms Gillian Unicomb<br />
Organisations representing teachers of registered schools<br />
Ms Christine Edwards Catholic <strong>Education</strong><br />
Mr Ian Dalton<br />
Organisations representing parents of children at registered schools<br />
Ms Sally Giacon<br />
Registrar<br />
Standards<br />
for the<br />
registration<br />
of schools<br />
The matters on which the Minister may determine a<br />
standard are contained in section 53 (1) of the<br />
<strong>Education</strong> Act 1994 and have been revised as a result<br />
of the amendments to the Act proclaimed on<br />
1 January 2004. The standards for registration are:<br />
a) the proposed curriculum of a school<br />
b) the qualifications required of teachers at a school<br />
c) the facilities to be provided at a school<br />
d) the minimum number of students to attend a school<br />
e) the kinds of students to attend a school<br />
f) the enrolment and attendance procedures of a school<br />
g) the financial viability of a school<br />
h) the governance of a school<br />
i) the impact of a new school on other schools<br />
j) a documented grievance process<br />
k) any other prescribed matter.<br />
‘Prescribed matter’ to date includes a Code of Conduct<br />
for Employees and a Review and Development process.<br />
Board<br />
meetings<br />
The board met six times in 2012–13 when it considered<br />
matters relating to applications for registration of existing<br />
schools, as well as other procedural and policy issues. All<br />
meetings were held in Hobart. The meeting dates were:<br />
• 2012 – 8 August, 19 October and 28 November<br />
• 2013 – 6 February, 17 April and 12 June.<br />
98 Required Reporting » Other Annual Reports
Registration<br />
of schools<br />
For a current list of non-government schools in Tasmania<br />
see: http://www.schools.education.tas.gov.au/srb/directory/<br />
Forms/AllItems.aspx<br />
1. Application for a new school<br />
There was one application for a new school in 2012–13:<br />
• The Learning Odyssey.<br />
2. Review of registered schools<br />
In Tasmania, there are 67 registered schools; 13 of these<br />
schools have more than one campus.<br />
The following schools were reviewed between July 2012<br />
and June 2013:<br />
• Circular Head Christian School, Smithton<br />
• Community Christian Academy, Kilafaddy Rd<br />
Newstead and Tudor Ave Newstead<br />
• Eastside Lutheran College, Warrane<br />
• Giant Steps Tasmania, Deloraine<br />
• Guilford Young College, Glenorchy and Hobart<br />
• Hilliard Christian School, Moonah<br />
• Immaculate Heart of Mary School, Lenah Valley<br />
• Larmenier Catholic School, St Leonards<br />
• North West Christian School, Penguin<br />
• Oakwood School, Claremont, Newstead and<br />
East Devonport<br />
• Sacred Heart Catholic School, Ulverstone<br />
• Sacred Heart College, New Town<br />
• St Aloysius Catholic College, Huntingfield and<br />
Kingston Beach<br />
• St Brendan-Shaw College, Devonport<br />
• St Finn Barr’s Catholic School, Invermay<br />
• St James Catholic College, Cygnet<br />
• The Launceston Preparatory School, Launceston.<br />
3. School closures/amalgamations<br />
There were no school closures or amalgamations<br />
in 2012–13.<br />
4. Changes to registration<br />
Schools are required to notify the Schools Registration<br />
Board of any significant or notifiable changes in relation<br />
to their registration details.<br />
In November 2003, the Schools Registration Board<br />
determined that, in order to fully consider proposals to<br />
change registration, schools are to notify the board six<br />
months before the intended change is to take place.<br />
The following change was considered by the board<br />
in 2012–13:<br />
• Seabrook Christian School – closure of<br />
St Helens Campus.<br />
Jenny Cranston<br />
Chair<br />
Statement of<br />
expenditure<br />
Expenditure information is provided in the Financial<br />
Statements section on page 141.<br />
Required Reporting » Other Annual Reports<br />
99
100 Required Reporting
Financial Statements<br />
AS AT 30 JUNE 2013<br />
Contents<br />
Statement of Comprehensive Income...................................................................................... 102<br />
Statement of Financial Position................................................................................................... 103<br />
Statement of Cash Flows..............................................................................................................104<br />
Statement of Changes in Equity..................................................................................................105<br />
Notes..................................................................................................................................................106<br />
Statement of Certification............................................................................................................144<br />
Auditor-General's Report............................................................................................................ 145
Statement of Comprehensive Income<br />
For the<br />
year ended<br />
30 June 2013<br />
Continuing Operations<br />
Revenue and other income from transactions<br />
Revenue from government<br />
Notes<br />
2013<br />
Budget<br />
$’000<br />
2013<br />
Actual<br />
$’000<br />
2012<br />
Actual<br />
$’000<br />
Appropriation revenue – recurrent 2.10(a), 7.1 893,214 866,773 926,677<br />
Appropriation revenue – works and services 2.10(a), 7.1 12,050 12,161 61,384<br />
Other revenue from government 2.10(a), 7.1 16,465 5,553 7,441<br />
Grants 2.10(b), 7.2 67,758 58,573 5,329<br />
Sales of goods and services 2.10(c), 7.3 46,762 42,874 45,029<br />
Fees and fines 2.10(d), 7.4 580 317 350<br />
Interest 2.10(e) 1,614 1,217 2,035<br />
Contributions received 2.10(f), 7.5 80 12,740 225<br />
Other revenue 2.10(g), 7.6 25,485 24,617 39,317<br />
Total revenue and other income from transactions 1,064,008 1,024,825 1,087,787<br />
Expenses from transactions<br />
Employee benefits 2.11(a), 8.1 693,153 719,846 706,635<br />
Depreciation and amortisation 2.11(b), 8.2 41,184 52,279 49,454<br />
Supplies and consumables 2.11(c),8.3 237,974 188,822 207,571<br />
Grants and subsidies 2.11(d), 8.4 50,859 59,182 44,623<br />
Other expenses 2.11(e), 8.5 50,899 25,275 41,812<br />
Total expenses from transactions 1,074,069 1,045,404 1,050,095<br />
Net operating result from continuing operations (10,061) (20,579) 37,692<br />
Other economic flows included in net result<br />
Net gain/(loss) on non-financial assets 2.12(a)(c), 9.1 237 1,023 (3,777)<br />
Net gain/(loss) on financial instruments and<br />
statutory receivables/payables<br />
2.12 (b), 9.2 – (83) (360)<br />
Net gain/(loss) associated with transitional data transfers 9.3 – – (14,346)<br />
Total other economic flows included in net result 237 940 (18,483)<br />
Net result (9,824) (19,639) 19,209<br />
Other comprehensive income<br />
Items that will not be reclassified subsequently to profit or loss<br />
Changes in property, plant and equipment revaluation surplus 26,368 64,642 66,548<br />
Total other economic flows – other non-owner changes in equity 26,368 64,642 66,548<br />
Comprehensive result 16,544 45,003 85,757<br />
This Statement of Comprehensive Income should be read in conjunction with the accompanying notes.<br />
Budget information refers to original estimates for the department and has not been subject to audit.<br />
Explanations of material variances between budget and actual outcomes are provided in note 4 of the accompanying notes.<br />
102 Financial Statements » Statement of Comprehensive Income
Statement of Financial Position<br />
As at<br />
30 June 2013<br />
Assets<br />
Financial assets<br />
Notes<br />
2013<br />
Budget<br />
$’000<br />
2013<br />
Actual<br />
$’000<br />
2012<br />
Actual<br />
$’000<br />
Cash and deposits 2.13(a), 14.1 44,981 53,570 66,553<br />
Receivables 2.13(b), 10.1 12,969 17,137 12,047<br />
Non-financial assets<br />
Assets held for sale 2.13(c), 10.2 11,669 11,206 11,427<br />
Property, plant and equipment 2.13(d), 10.3 1,611,722 1,645,070 1,612,500<br />
Library book stock 2.13(d), 10.4 16,321 15,095 16,790<br />
Heritage collections 2.13(d), 10.5 63,363 64,153 63,343<br />
Intangibles 2.13(f), 10.6 – 2,271 3,029<br />
Other assets 2.13(e), 10.7 2,157 2,780 1,818<br />
Total assets 1,763,182 1,811,282 1,787,507<br />
Liabilities<br />
Payables 2.14(a), 11.1 7,581 8,086 11,978<br />
Employee benefits 2.14(b), 11.2 154,527 150,544 154,249<br />
Other liabilities 2.14(d), 11.3 14,620 4,846 15,474<br />
Total liabilities 176,728 163,476 181,701<br />
Net assets 1,586,454 1,647,806 1,605,806<br />
Equity<br />
Reserves 13.1 302,030 385,387 320,745<br />
Accumulated funds 1,284,424 1,262,419 1,285,061<br />
Total equity 1,586,454 1,647,806 1,605,806<br />
This Statement of Financial Position should be read in conjunction with the accompanying notes.<br />
Budget information refers to original estimates for the department and has not been subject to audit.<br />
Explanations of material variances between budget and actual outcomes are provided in note 4 of the accompanying notes.<br />
Financial Statements » Statement of Financial Position<br />
103
Statement of Cash Flows<br />
For the<br />
year ended<br />
30 June 2013<br />
Cash flows from operating activities<br />
Cash inflows<br />
Notes<br />
2013<br />
Budget<br />
$’000<br />
2013<br />
Actual<br />
$’000<br />
2012<br />
Actual<br />
$’000<br />
Appropriation receipts – recurrent 893,214 866,773 926,677<br />
Appropriation receipts – other – – 6,279<br />
Grants – continuing operations 67,758 58,573 3,419<br />
Sales of goods and services 47,974 41,667 39,454<br />
Fees and fines 580 317 350<br />
GST receipts 48,574 33,440 43,853<br />
Interest received 1,614 1,217 2,035<br />
Other cash receipts 25,483 26,371 37,730<br />
Total cash inflows 1,085,197 1,028,358 1,059,797<br />
Cash outflows<br />
Employee benefits (684,541) (723,551) (700,989)<br />
GST payments (47,378) (32,160) (42,644)<br />
Supplies and consumables (243,389) (190,240) (207,500)<br />
Grants and subsidies (50,859) (57,911) (44,623)<br />
Other cash payments (50,333) (25,564) (53,460)<br />
Total cash outflows (1,076,500) (1,029,426) (1,049,216)<br />
Net cash from (used by) operating activities 14.2 8,697 (1,068) 10,581<br />
Cash flows from investing activities<br />
Cash inflows<br />
Receipts from non-operational capital funding<br />
Appropriation receipts – works and services 12,050 15,300 61,384<br />
Other revenue from government – – 1,162<br />
Proceeds from the disposal of non-financial assets – 2,502 917<br />
Total cash inflows 12,050 17,802 63,463<br />
Cash outflows<br />
Payments for acquisition of non-financial assets (39,827) (22,043) (68,038)<br />
Works and Services repayment to Treasury – (7,674) –<br />
Total cash outflows (39,827) (29,717) (68,038)<br />
Net cash from (used by) investing activities (27,777) (11,915) (4,575)<br />
Net increase (decrease) in cash and cash equivalents held (19,080) (12,983) 6,006<br />
Cash and deposits at the beginning of the reporting period 64,061 66,553 60,547<br />
Cash and deposits at the end of the reporting period 14.1 44,981 53,570 66,553<br />
This Statement of Cash Flows should be read in conjunction with the accompanying notes.<br />
Budget information refers to original estimates for the department and has not been subject to audit.<br />
Explanations of material variances between budget and actual outcomes are provided in note 4 of the accompanying notes.<br />
104 Financial Statements » Statement of Cash Flows
Statement of Changes in Equity<br />
For the<br />
year ended<br />
30 June 2013<br />
Notes<br />
Reserves<br />
$’000<br />
Accumulated<br />
Funds<br />
$’000<br />
Total Equity<br />
$’000<br />
Balance as at 1 July 2012 320,745 1,285,061 1,605,806<br />
Total comprehensive result 64,642 (19,639) 45,003<br />
Decrease in equity associated with CLAF 1 proceeds – (3,003) (3,003)<br />
Total 64,642 (22,642) 42,000<br />
Balance as at 30 June 2013 385,387 1,262,420 1,647,806<br />
Notes<br />
Reserves<br />
$’000<br />
Accumulated<br />
Funds<br />
$’000<br />
Total Equity<br />
$’000<br />
Balance as at 1 July 2011 254,197 1,271,428 1,525,625<br />
Total comprehensive result 66,548 19,209 85,757<br />
Decrease in equity associated with CLAF 1 proceeds – (5,576) (5,576)<br />
Total 66,548 13,633 80,181<br />
Balance as at 30 June 2012 320,745 1,285,061 1,605,806<br />
1. CLAF = Crown Land Administration Fund. CLAF proceeds from property disposals are controlled by the Department of Treasury and Finance. The<br />
department recognises these proceeds at the time of sale.<br />
This Statement of Changes in Equity should be read in conjunction with the accompanying notes.<br />
Financial Statements » Statement of Changes in Equity<br />
105
Notes<br />
Notes to<br />
and forming<br />
part of the<br />
financial<br />
statements<br />
for the<br />
year ended<br />
30 June 2013<br />
Note Description Page No.<br />
1 Administered financial statements 108<br />
1.1 Schedule of Administered Income and Expenses 108<br />
1.2 Schedule of Administered Assets and Liabilities 108<br />
1.3 Schedule of Administered Cash Flows 109<br />
1.4 Schedule of Administered Changes in Equity 109<br />
2 Significant accounting policies 110<br />
2.1 Objectives and funding 110<br />
2.2 Basis of accounting 112<br />
2.3 Reporting entity 112<br />
2.4 Functional and presentation currency 112<br />
2.5 Change in accounting estimate 112<br />
2.6 Changes in accounting policies 112<br />
2.7 Administered transactions and balances 114<br />
2.8 Activities undertaken under a trustee or agency relationship 114<br />
2.9 Transactions by the government as owner – restructuring of administrative arrangements 114<br />
2.10 Income from transactions 114<br />
2.11 Expenses from transactions 115<br />
2.12 Other economic flows included in net result 115<br />
2.13 Assets 116<br />
2.14 Liabilities 117<br />
2.15 Leases 117<br />
2.16 Unrecognised financial instruments 117<br />
2.17 Judgements and assumptions 117<br />
2.18 Foreign currency 118<br />
2.19 Comparative figures 118<br />
2.20 Budget information 118<br />
2.21 Rounding 118<br />
2.22 Departmental taxation 118<br />
2.23 Goods and services tax 118<br />
3 Departmental output schedules 118<br />
3.1 Output group information 118<br />
3.2 Reconciliation of total output groups’ comprehensive result to Statement of Comprehensive Income 122<br />
3.3 Reconciliation of total output groups’ net assets to Statement of Financial Position 122<br />
3.4 Administered output schedule 123<br />
3.5 Reconciliation of total administered output groups’ comprehensive<br />
result to administered Statement of Changes in Equity 123<br />
3.6 Reconciliation of total administered output groups’ net assets to schedule of administered assets and liabilities 123<br />
4 Explanations of material variances between budget and actual outcomes 124<br />
4.1 Statement of Comprehensive Income 124<br />
4.2 Statement of Financial Position 124<br />
4.3 Statement of Cash Flows 125<br />
5 Events occurring after balance date 125<br />
6 Underlying net operating balance 126<br />
7 Income from transactions 126<br />
7.1 Revenue from government 126<br />
7.2 Grants 127<br />
7.3 Sales of goods and services 127<br />
7.4 Fees and fines 127<br />
7.5 Contributions received 127<br />
7.6 Other revenues 127<br />
8 Expenses from transactions 128<br />
8.1 Employee benefits 128<br />
8.2 Depreciation 128<br />
106 Financial Statements » Notes
Note Description Page No.<br />
8.3 Supplies and consumables 128<br />
8.4 Grants and subsidies 129<br />
8.5 Other expenses 129<br />
9 Other economic flows included in net result 129<br />
9.1 Net gain/(loss) on non-financial assets 129<br />
9.2 Net gain/(loss) on financial instruments and statutory receivables/payables 129<br />
9.3 Net gain/(loss) associated with transitional data arrangements 129<br />
10 Assets 130<br />
10.1 Receivables 130<br />
10.2 Assets held for sale 130<br />
10.3 Property, plant, equipment 131<br />
10.4 Library book stock 132<br />
10.5 Heritage collections 132<br />
10.6 Intangibles 132<br />
10.7 Other assets 133<br />
11 Liabilities 133<br />
11.1 Payables 133<br />
11.2 Employee benefits 133<br />
11.3 Other liabilities 133<br />
12 Commitments and contingencies 134<br />
12.1 Schedule of commitments 134<br />
12.2 Contingent assets and liabilities 134<br />
13 Reserves 135<br />
13.1 Reserves 135<br />
13.2 Administrative restructuring 135<br />
14 Cash flow reconciliation 135<br />
14.1 Cash and deposits 135<br />
14.2 Reconciliation of net result to net cash from operating activities 136<br />
14.3 Acquittal of capital investment and special capital investment funds 137<br />
15 Financial instruments 138<br />
15.1 Risk exposures 138<br />
15.2 Categories of financial assets and liabilities 140<br />
15.3 Reclassification of financial assets 140<br />
15.4 De-recognition of financial assets 140<br />
15.5 Comparison between carrying amount and net fair value of financial assets and liabilities 140<br />
16 Details of consolidated entities 140<br />
16.1 List of entities 140<br />
16.2 Statement of expenditure for Schools Registration Board 141<br />
17 Notes to administered statements 141<br />
17.1 Explanations of material variances between budget and actual outcomes 141<br />
17.2 Administered revenue from government 141<br />
17.3 Administered grants 141<br />
17.4 Administered sales of goods and services 141<br />
17.5 Administered fees and fines 142<br />
17.6 Administered other revenue 142<br />
17.7 Administered grants and subsidies 142<br />
17.8 Administered receivables 142<br />
17.9 Administered cash and deposits 142<br />
17.10 Reconciliation of administered net result to net cash from administered operating activities 142<br />
17.11 Financial instruments (administered) 143<br />
17.12 Categories of administered financial assets and liabilities 143<br />
17.13 Comparison between carrying amount and net fair value of financial assets and liabilities 143<br />
18 Transactions and balances relating to a trustee or agency arrangement 144<br />
Financial Statements » Notes<br />
107
Note 1: Administered financial statements<br />
1.1<br />
Schedule of<br />
Administered<br />
Income and<br />
Expenses<br />
Administered revenue and<br />
other income from transactions<br />
Revenue from government<br />
Notes<br />
2013<br />
Budget<br />
$’000<br />
2013<br />
Actual<br />
$’000<br />
2012<br />
Actual<br />
$’000<br />
Appropriation revenue – recurrent 2.10(a), 17.2 236,694 233,524 231,895<br />
Grants 2.10(b), 17.3 569 2,703 661<br />
Sales of goods and services 2.10(c), 17.4 343 155 153<br />
Fees and fines 2.10(d), 17.5 – 12 24<br />
Other revenue 2.10(g), 17.6 – 9 5<br />
Total administered revenue and other<br />
income from transactions<br />
Administered expenses from transactions<br />
237,606 236,403 232,738<br />
Grants and subsidies 2.11(c), 17.7 236,694 236,232 231,877<br />
Transfers to the Consolidated Fund 912 171 864<br />
Total administered expenses from transactions 237,606 236,403 232,741<br />
Administered net result from transactions<br />
attributable to the state<br />
– – (3)<br />
Other economic flows – – –<br />
Administered comprehensive result – – (3)<br />
This Schedule of Administered Income and Expenses should be read in conjunction with the accompanying notes.<br />
Budget information refers to original estimates for the department and has not been subject to audit.<br />
Explanations of material variances between budget and actual outcomes are provided in note 17.1 of the accompanying notes.<br />
1.2<br />
Schedule of<br />
Administered<br />
Assets and<br />
Liabilities<br />
Administered assets<br />
Administered financial assets<br />
Notes<br />
2013<br />
Budget<br />
$’000<br />
2013<br />
Actual<br />
$’000<br />
2012<br />
Actual<br />
$’000<br />
Cash and deposits 2.13(a), 17.9 – – –<br />
Receivables 2.13(b), 17.8 – – –<br />
Total administered assets – – –<br />
Administered net assets – – –<br />
Administered equity<br />
Accumulated funds – – –<br />
Total administered equity – – –<br />
This Schedule of Administered Income and Expenses should be read in conjunction with the accompanying notes.<br />
Budget information refers to original estimates for the department and has not been subject to audit.<br />
Explanations of material variances between budget and actual outcomes are provided in note 17.1 of the accompanying notes.<br />
108 Financial Statements » Notes
1.3<br />
Schedule of<br />
Administered<br />
Cash Flows<br />
Administered cash flows from operating activities<br />
Administered cash inflows<br />
Notes<br />
2013<br />
Budget<br />
$’000<br />
2013<br />
Actual<br />
$’000<br />
2012<br />
Actual<br />
$’000<br />
Appropriation receipts – recurrent 236,694 233,524 231,683<br />
Grants 569 2,703 661<br />
Sales of goods and services 343 155 3<br />
Fees and fines .... 12 24<br />
Other cash receipts .... 9 177<br />
Total administered cash inflows 237,606 236,403 232,548<br />
Administered cash outflows<br />
Grants and subsidies (236,694) (236,232) (231,684)<br />
Transfers to Consolidated Fund (912) (171) (864)<br />
Total administered cash outflows (237,606) (236,403) 232,548<br />
Administered net cash from (used by) operating activities 17.10 – – –<br />
Net increase (decrease) in administered cash held – – –<br />
Administered cash and deposits at the<br />
beginning of the reporting period<br />
Administered cash and deposits at the<br />
end of the reporting period<br />
This Schedule of Administered Cash Flows should be read in conjunction with the accompanying notes.<br />
Budget information refers to original estimates for the department and has not been subject to audit.<br />
Explanations of material variances between budget and actual outcomes are provided in note 17.1 of the accompanying notes.<br />
– – –<br />
17.9 – – –<br />
1.4<br />
Schedule of<br />
Administered<br />
Changes in<br />
Equity<br />
Accumulated<br />
Funds<br />
$’000<br />
Total<br />
Equity<br />
$’000<br />
Balance as at 1 July 2012 – –<br />
Total comprehensive result – –<br />
Balance as at 30 June 2013 – –<br />
Accumulated<br />
Funds<br />
$’000<br />
Total<br />
Equity<br />
$’000<br />
Balance as at 1 July 2011 3 3<br />
Total comprehensive result (3) (3)<br />
Balance as at 30 June 2012 – –<br />
This Schedule of Administered Changes in Equity should be read in conjunction with the accompanying notes.<br />
Financial Statements » Notes<br />
109
Note 2: Significant accounting policies<br />
2.1<br />
Objectives<br />
and funding<br />
The Department of <strong>Education</strong> is responsible to the<br />
Minister for <strong>Education</strong> and Skills, and to the Minister for<br />
Children. The department provides services through the<br />
following organisational units:<br />
Early Years and Schools Division<br />
The Early Years and Schools Division delivers its services<br />
to more than 63,000 school aged students 1 attending 203<br />
schools 1 . It oversees pre-compulsory and compulsory<br />
schooling delivered through programs operated in schools<br />
and in the newly established child and family centres.<br />
<strong>Education</strong>al leadership within the Division is provided by<br />
three Learning Services.<br />
1 For further detail see the ‘Department at a Glance’ chapter in the<br />
Annual Report.<br />
Early Years<br />
The <strong>Education</strong> and Care Unit is accountable to the Minister<br />
for Children and is responsible for licensing and monitoring<br />
all child care services under the Child Care Act 2001.<br />
Learning Services<br />
Learning Services provide support for networks of<br />
schools, together with leadership in each of the North-<br />
West, North and South areas of the state. Their role has<br />
been refocused as a key element of a new integrated and<br />
comprehensive approach to school improvement. This<br />
approach will build on the work already being undertaken<br />
to improve the quality of teaching and learning to:<br />
• develop leadership capacity<br />
• build teacher capacity<br />
• develop and support staff<br />
• introduce consistency across the curriculum<br />
• utilise data to support and monitor performance.<br />
Further <strong>Education</strong> and Training Division<br />
The department delivers Further <strong>Education</strong> and Training<br />
(FET) education and training services primarily through the<br />
eight senior secondary schools and through the Tasmanian<br />
Polytechnic. These services support students continuing<br />
their education or training following the completion of<br />
Year 10. They also support adult learners seeking new<br />
or increased vocational skills as well as second chance<br />
learners. The activities of the senior secondary schools and<br />
the Tasmanian Polytechnic are complemented by limited<br />
service delivery for Year 11 and Year 12 in some combined<br />
schools and secondary schools. The final element of the<br />
government’s FET delivery model is the Tasmanian Skills<br />
Institute, a statutory body which works with government<br />
and employers to build skills within the Tasmanian<br />
workforce. The Tasmanian Skills Institute is a Statutory<br />
Authority and prepares its own financial statements.<br />
These are not consolidated with the department’s financial<br />
statements. The authority prepared its final set of financial<br />
statements as at 30 June 2013. The Skills Institute now<br />
forms part of the new TasTAFE Statutory Authority.<br />
TasTAFE<br />
Following the enactment of the Training and Workforce<br />
Development Act 2013, a new statutory authority named<br />
TasTAFE was created effective from 1 July 2013.<br />
TasTAFE is the new public provider of vocational education<br />
and training for Tasmania. It has been created through the<br />
amalgamation of the statutory authority Tasmanian Skills<br />
Institute and the Tasmanian Polytechnic operations of the<br />
Department of <strong>Education</strong>.<br />
See note 5 for more information surrounding TasTAFE and<br />
further education and training and its future operations.<br />
LINC Tasmania<br />
LINC Tasmania, formerly known as the Community<br />
Knowledge Network, includes a statewide network of<br />
LINCs and the Tasmanian Archive and Heritage Office.<br />
It also provides adult education services including adult<br />
literacy programs. LINC Tasmania’s focus is on lifelong<br />
learning for all Tasmanian’s ensuring access to Tasmania’s<br />
cultural and documentary heritage and to deliver<br />
information, education and training, literacy support and<br />
other community services across the state.<br />
Corporate Services Division<br />
The Corporate Services Division provides centralised<br />
support to service delivery areas through business units<br />
responsible for corporate support, policy development,<br />
regulation and assessment and review.<br />
Skills Tasmania<br />
Skills Tasmania:<br />
• provides advice to the Minister in relation to the<br />
allocation of resources for vocational education and<br />
training (VET), development and management of<br />
plans, programs and activities for the purchase of VET<br />
to implement specific government initiatives<br />
• provides planning and policy advice to the Minister on<br />
state and national initiatives for VET<br />
• provides services and support to registered training<br />
providers, apprentices and trainees, industry, and<br />
government training advisory bodies including the<br />
regulation of VET<br />
• provides policy advice, develops and implement policy<br />
and strategies for skills development<br />
• provides support for improved personal, social and<br />
economic outcomes for people from equity groups.<br />
See note 5 for more information surrounding Skills<br />
Tasmania and its future operations.<br />
Outputs of the department<br />
The individual outputs of the Department of <strong>Education</strong><br />
are provided under the following output groups:<br />
• Output Group 1: Pre-Compulsory and Compulsory<br />
<strong>Education</strong><br />
• Output Group 2: Post-Compulsory <strong>Education</strong> and<br />
Skills Development<br />
• Output Group 3: LINC Tasmania.<br />
Output Group 1: Pre-Compulsory and<br />
Compulsory <strong>Education</strong><br />
Description<br />
The purpose of this output group is to provide a range<br />
of educational services that will help students develop<br />
intellectually, socially, morally, emotionally and physically<br />
in a stimulating, inclusive and supportive environment.<br />
These services are focused on the delivery of education to<br />
students in schools enrolled in classes up to Year 10.<br />
The department’s outcomes to which this output group<br />
contributes are:<br />
110 Financial Statements » Notes
• all students in Tasmanian Government schools receiving<br />
high quality teaching focused on the achievement of<br />
high standards<br />
• student progress being assessed, monitored and<br />
reported against standards that are consistent<br />
across schools<br />
• a fair and just distribution of the benefits of schooling<br />
across all students, leading to minimal difference in<br />
measurable outcomes between identified student groups<br />
• all students in Tasmanian Government schools receive<br />
teaching that appropriately utilises information<br />
and communication technology to provide more<br />
effective learning<br />
• all students participate fully in schooling and complete<br />
schooling until the end of Year 12 or the equivalent<br />
• students perform at nationally comparable<br />
achievement levels<br />
• parents of students participating in the schooling of<br />
their children, and the community and the general<br />
public informed on educational matters and involved<br />
in their school communities<br />
• improved access to child care services that meet state<br />
licensing guidelines and national standards for all parents,<br />
carers and families.<br />
Output Group 2: Post-Compulsory <strong>Education</strong><br />
and Skills Development<br />
Description<br />
The purpose of this output group is to facilitate the provision<br />
of Years 11 and 12 education and formally recognised VET by<br />
registered training providers, including schools.<br />
The outputs in this group directly address the long-term<br />
vision and goals set out in the Tasmanian Skills Strategy, the<br />
Tasmanian Innovation Strategy, the Infrastructure Strategy and<br />
the National Agreements for Skills and Workforce Development<br />
and <strong>Education</strong>.<br />
The department’s outcomes to which this output group<br />
contributes are:<br />
• all students in Tasmanian schools and colleges receive<br />
quality teaching leading to effective learning<br />
• all students participate fully in schooling and complete<br />
schooling until the end of Year 12, or a training course<br />
leading to a Certificate III outcome<br />
• students perform at nationally comparable<br />
achievement levels<br />
• all students in Tasmanian Government schools continue<br />
to receive teaching that appropriately utilises information<br />
and communications technology leading to more<br />
effective learning<br />
• fair and just distribution of the benefits of schooling<br />
across all students and minimal difference in measurable<br />
outcomes between identified student groups<br />
• parents of students continue to participate in the schooling<br />
of their children and the community and the general public<br />
continue to be well informed on educational matters and<br />
involved in their school communities<br />
• a strong adult training system including the Tasmanian<br />
Skills Institute and the Tasmanian Polytechnic and a strong<br />
system of private training<br />
• provision of a quality assurance and regulatory framework<br />
for vocational education and training, involving:<br />
º º registration of training providers<br />
º º accreditation of courses<br />
º º recognition of overseas qualifications.<br />
• approval and monitoring of apprentice and trainee<br />
training contracts<br />
• management of the purchase of vocational education<br />
and training from registered training organisations to<br />
ensure that:<br />
º º the number of Tasmanians with post-compulsory<br />
education and training qualifications increases<br />
º º partnership arrangements are developed between<br />
schools, colleges and the Tasmanian Polytechnic<br />
º º training provision is aligned to the government’s<br />
economic and social policy including Tasmania’s<br />
development strategies and the needs of industry.<br />
Output Group 3: LINC Tasmania<br />
Description<br />
The purpose of this output group is to provide statewide<br />
library and information services, archival and community<br />
learning services.<br />
The department’s outcomes to which this output group<br />
contributes are:<br />
• provision of lifelong learning of all Tasmanians through<br />
the delivery of information, education and training,<br />
literacy support and other community services<br />
through the Learning and Information Network<br />
Centre (LINC) network<br />
• an informed, empowered and technologically literate<br />
community of lifelong users of information and<br />
information technology<br />
• an improved quality of life for all Tasmanians and a<br />
culturally rich community<br />
• sustained economic development in the information<br />
age through community and individual innovation<br />
• equity of access to information and to resources for<br />
innovation<br />
• a community which values knowledge and ideas and<br />
learning for life<br />
• the enhanced capacity and increased opportunity for<br />
the community to have access to and use the cultural<br />
memory and documentary record of Tasmania<br />
• ensuring that government accountability is able to be<br />
monitored and assessed by the Tasmanian community<br />
through access to the evidence of the activities of the<br />
government.<br />
Other<br />
Departmental activities are classified as either controlled<br />
or administered.<br />
Controlled activities involve the use of assets, liabilities,<br />
revenues and expenses controlled or incurred by the<br />
department in its own right. Administered activities<br />
involve the management or oversight by the department<br />
on behalf of the government of items controlled or<br />
incurred by the government.<br />
The department is predominantly funded through<br />
parliamentary appropriations. It also provides services<br />
on a fee for service basis, as outlined in note 7.3. The<br />
financial report encompasses all funds through which the<br />
department controls resources to carry on its functions.<br />
Financial Statements » Notes<br />
111
2.2<br />
Basis of<br />
accounting<br />
The financial statements are a general purpose financial<br />
report and have been prepared in accordance with:<br />
• Australian Accounting Standards and interpretations<br />
issued by the Australian Accounting Standards Board<br />
• The Treasurer’s Instructions issued under the<br />
provisions of the Financial Management and Audit<br />
Act 1990.<br />
The financial statements were signed by the Secretary on<br />
14 August 2013.<br />
Compliance with the Australian Accounting Standards<br />
(AAS) may not result in compliance with International<br />
Financial Reporting Standards (IFRS) as the AAS include<br />
requirements and options available to not-for-profit<br />
organisations that are inconsistent with IFRS.<br />
The department is considered to be not-for-profit and has<br />
adopted some accounting policies under the AAS that do<br />
not comply with IFRS.<br />
The financial statements have been prepared on an<br />
accrual basis and, except where stated, are in accordance<br />
with the historical cost convention. The accounting policies<br />
are generally consistent with the previous year except for<br />
those changes outlined in note 2.6.<br />
The financial statements have been prepared as a going<br />
concern. The continued existence of the department<br />
in its present form, undertaking its current activities,<br />
is dependent on government policy and on continuing<br />
appropriations by parliament for the department’s<br />
administration and activities.<br />
2.3<br />
Reporting<br />
entity<br />
The financial statements include all the controlled activities<br />
of the department. The financial statements consolidate<br />
material transactions and balances of the department and<br />
entities included in its output groups. Material transactions<br />
and balances between the department and such entities<br />
have been eliminated.<br />
The department through a purchaser-provider model has<br />
predominately funded the operations of the Tasmanian<br />
Skills Institute. However, this organisation has operated as<br />
a statutory authority and has been a separate reporting<br />
entity with its transactions not consolidated into the<br />
Department of <strong>Education</strong>’s financial statements except for<br />
funds provided under the purchaser-provider model.<br />
The Tasmanian Qualifications Authority, Skills Tasmania,<br />
Schools Registration Board and Teachers Registration<br />
Board transactions and balances are included in these<br />
financial statements.<br />
Skills Tasmania has ceased to be a statutory authority<br />
from 30 June 2013. Skills Tasmania maintains its name<br />
and functions, but has become a business unit of the<br />
department therefore will no longer be a separate<br />
consolidated entity listed in note 16.<br />
2.4<br />
Functional and<br />
presentation<br />
currency<br />
The financial statements are presented in Australian dollars, which is the department’s functional currency.<br />
2.5<br />
Change in<br />
accounting<br />
estimate<br />
There were no changes in accounting estimates during the period.<br />
2.6<br />
Changes in<br />
accounting<br />
policies<br />
a) Impact of new and revised accounting standards<br />
In the current year, the department has adopted all of the<br />
new and revised standards and interpretations issued by<br />
the Australian Accounting Standards Board (AASB) that<br />
are relevant to its operations and effective for the current<br />
annual reporting period.<br />
None of these changes result in a financial impact to the<br />
department’s financial statements and instead only relate to<br />
immaterial changes in disclosure. The changes considered<br />
relevant to the department are summarised below:<br />
• AASB 2010-6 Amendments to Australian Accounting<br />
Standards – Disclosures on Transfers of Financial Assets<br />
[AASBs 1 & 7] – this standard introduces additional<br />
disclosure relating to transfers of financial assets in<br />
AASB 7. An entity shall disclose all transferred financial<br />
assets that are not derecognised and any continuing<br />
involvement in a transferred asset, existing at the<br />
reporting date, irrespective of when the related transfer<br />
transaction occurred. There is no financial impact.<br />
• AASB 2011-1 Amendments to Australian Accounting<br />
Standards arising from the Trans-Tasman Convergence<br />
Project [AASBs 1, 5, 101, 107,108, 121, 128, 132 & 134<br />
and Interpretations 2, 112 & 113] – this standard, in<br />
conjunction with AASB 1054, removes disclosure<br />
requirements from other standards and incorporates<br />
them in a single standard to achieve convergence<br />
between Australian and New Zealand Accounting<br />
Standards. There is no financial impact.<br />
• AASB 2011-9 Amendments to Australian<br />
Accounting Standards – Presentation of Items Other<br />
Comprehensive Income [AASB 1, 5, 7, 101, 112, 120,<br />
121, 132, 133, 134, 1039 & 1049] – this standard requires<br />
to group items presented in other comprehensive<br />
income on the basis of whether they are potentially<br />
re-classifiable to profit or loss subsequently<br />
(reclassification adjustments). There is no financial<br />
impact.<br />
112 Financial Statements » Notes
) Impact of new and revised accounting<br />
standards yet to be applied<br />
There have been a number of new and revised standards<br />
issued by the AASB that are available for early adoption<br />
but have not yet been applied by the department.<br />
The changes considered relevant to the department are<br />
summarised below:<br />
• AASB 9 Financial Instruments – this standard<br />
supersedes AASB 139 Financial Instruments:<br />
recognition and Measurement, introducing a<br />
number of changes to accounting treatments.<br />
The standard was reissued in December 2010 and<br />
again in August 2011 but is not yet available for<br />
application by not for profit entities. The department<br />
has determined that there is no financial impact.<br />
• AASB 13 Fair Value Measurement – this standard<br />
defines fair value, sets out a framework for measuring<br />
fair value and requires disclosures about fair value<br />
measurements. AASB 13 Fair Value Measurement<br />
sets out a new definition of ‘fair value’ as well as new<br />
principles to be applied when determining the fair value<br />
of assets and liabilities. The new requirements will apply<br />
to all of the department’s assets and liabilities (excluding<br />
leases), that are measured and/or disclosed at fair value<br />
or another measurement based on fair value.<br />
• The department has commenced reviewing its fair<br />
value methodologies (including instructions to valuers,<br />
data used and assumptions made) for all items of<br />
property, plant and equipment measured at fair value<br />
to determine whether those methodologies comply<br />
with AASB 13. To the extent that the methodologies<br />
don’t comply, changes will be necessary. While the<br />
department is yet to complete this review, no<br />
substantial changes are anticipated, based on the fair<br />
value methodologies presently used. Therefore, at this<br />
stage, no consequential material impacts are expected<br />
for the department’s property, plant and equipment<br />
as from 2013–14.<br />
• However, AASB 13 will require an increased amount<br />
of information to be disclosed in relation to fair value<br />
measurements for both assets and liabilities. To the<br />
extent that any fair value measurement for an asset<br />
or liability uses data that is not ‘observable’ outside<br />
the department, the amount of information to be<br />
disclosed will be relatively greater.<br />
• AASB 119 Employee Benefits – this standard<br />
supersedes AASB 119 Employee Benefits, introducing<br />
a number of changes to accounting treatments.<br />
The standard was issued in September 2012. The<br />
department has determined that the potential impact<br />
of application will result in a reduction in reported<br />
leave liabilities, except where the discount rate under<br />
AASB 119 is less than the assumed rate of salary<br />
increases for employees in which case the annual leave<br />
liability disclosed would be higher than previously.<br />
• AASB 2010-7 Amendments to Australian Accounting<br />
Standards arising from AASB 9 (December 2010)<br />
[AASBs 1, 3, 4, 5, 7, 101, 102, 108,112, 118, 120, 121,<br />
127, 128, 131, 132, 136, 137, 139, 1023 & 1038 and<br />
Interpretations 2, 5, 10, 12, 19, & 127] – this standard<br />
makes consequential amendments to other Australian<br />
Accounting Standards and Interpretations as a<br />
result of issuing AASB in December 2010. It is not<br />
anticipated that there will be any financial impact.<br />
• AASB 2011-8 Amendments to Australian Accounting<br />
Standards arising from AASB 13 [AASB 1, 2, 3, 4,<br />
5, 7, 101, 116, 117, 118, 119, 120, 121, 131, 132, 133,<br />
134, 136, 138, 139, 140, 141, 1004, 1023 & 1038 and<br />
Interpretations 2, 4, 12, 13, 14, 17, 19, 131 & 132] –<br />
this standard replaces the existing definition and<br />
fair value guidance in other Australian Accounting<br />
Standards and Interpretations as the result of issuing<br />
AASB 13 in September 2011. It is anticipated that<br />
there will not be any financial impact.<br />
• AASB 2011-10 Amendments to Australian Accounting<br />
Standards arising from AASB 119 (September 2011)<br />
[AASB1, 8, 101, 124, 134, 1049, & 2011 8 and<br />
Interpretation 14] – this standard makes amendments<br />
to other Australian Accounting Standards and<br />
Interpretations as a result of issuing AASB 119 in<br />
September 2011. It is anticipated that there will be<br />
limited financial impact.<br />
• AASB 2012-2 Amendments to Australian Accounting<br />
Standards - Disclosures – Offsetting Financial Assets<br />
and Financial Liabilities [AASB 7 & AASB 132] – this<br />
standard amends the required disclosures in AASB<br />
7 to include information that will enable users of an<br />
entity’s financial statements to evaluate the effect or<br />
potential effect of netting arrangements, including<br />
rights of set-off associated with the entity’s recognised<br />
financial assets and recognised financial liabilities,<br />
on the entity’s financial position. It is anticipated that<br />
there will not be any financial impact.<br />
• AASB 2012-3 Amendments to Australian Accounting<br />
Standards – Offsetting Financial Assets and Financial<br />
Liabilities [AASB 132] – this standard adds application<br />
guidance to AASB 132 to address inconsistencies<br />
identified in applying some of the offsetting criteria,<br />
including clarifying the meaning of ‘currently has a<br />
legally enforceable right of set off’ and that some gross<br />
settlement systems may be considered equivalent to<br />
net settlement. It is anticipated that there will not be<br />
any financial impact.<br />
• AASB 2012-5 Amendments to Australian Accounting<br />
Standards arising from Annual Improvements 2009<br />
2011 Cycle [AASB 1, AASB 101, AASB 116, AASB 132<br />
& AASB 134 and Interpretation 2] – this standard<br />
makes amendments to the Australian Accounting<br />
Standards and Interpretations as a consequence of<br />
the annual improvements process. It is anticipated that<br />
there will not be any financial impact.<br />
• AASB 2013-1 Amendments to AASB 1049 –<br />
Relocation of Budgetary Reporting Requirements<br />
– this standard removes the requirements relating to<br />
the disclosure of budgetary information from AASB<br />
1049 (without substantive amendment). All budgetary<br />
reporting requirements applicable to public sector<br />
entities are now located in a single, topic based,<br />
Standard AASB 1055 Budgetary Reporting. Budgetary<br />
Reporting. There is no financial impact.<br />
Financial Statements » Notes<br />
113
2.7<br />
Administered<br />
transactions<br />
and balances<br />
The department administers, but does not control, certain<br />
resources on behalf of the government as a whole. These<br />
resources primarily relate to Australian Government<br />
funding programs supporting non-government schools<br />
within Tasmania. The department is accountable for<br />
the transactions involving such administered resources,<br />
but does not have the discretion to deploy resources for<br />
the achievement of the department’s objectives.<br />
Administered assets, liabilities, expenses and revenues are<br />
disclosed in note 17 to the financial statements.<br />
2.8<br />
Activities<br />
undertaken<br />
under a<br />
trustee<br />
or agency<br />
relationship<br />
Transactions relating to activities undertaken by the<br />
department in a trust or fiduciary (agency) capacity do<br />
not form part of the department’s activities. Trustee and<br />
agency arrangements, and transactions/balances relating to<br />
those activities, are neither controlled nor administered.<br />
Fees, commissions earned and expenses incurred in the<br />
course of rendering services as a trustee or through<br />
an agency arrangement are recognised as controlled<br />
transactions.<br />
2.9<br />
Transactions<br />
by the<br />
government<br />
as owner –<br />
restructuring<br />
of<br />
administrative<br />
arrangements<br />
Net assets received under a restructuring of administrative<br />
arrangements are designated as contributions by owners<br />
and adjusted directly against equity. Net assets relinquished<br />
are designated as distributions to owners. Net assets<br />
transferred are initially recognised at the amounts at<br />
which they were recognised by the transferring agency<br />
immediately prior to the transfer. Details of these<br />
transactions are provided in note 13.2.<br />
2.10<br />
Income from<br />
transactions<br />
Income is recognised in the Statement of Comprehensive<br />
Income when an increase in future economic benefits<br />
related to an increase in an asset or a decrease of a liability<br />
has arisen that can be measured reliably.<br />
a) Revenue from government<br />
Appropriations, whether recurrent or capital, are<br />
recognised as revenues in the period in which the<br />
department gains control of the appropriated funds.<br />
Except for any amounts identified as carried forward<br />
in notes 7.1 and 17.2, control arises in the period of<br />
appropriation.<br />
b) Grants<br />
Grants payable by the Australian Government are<br />
recognised as revenue when the department gains<br />
control of the underlying assets. Where grants are<br />
reciprocal, revenue is recognised as performance occurs<br />
under the grant.<br />
Non-reciprocal grants are recognised as revenue when<br />
the grant is received or receivable. Conditional grants may<br />
be reciprocal or non-reciprocal depending on the terms<br />
of the grant.<br />
c) Sales of goods and services<br />
Amounts earned in exchange for the provision of goods<br />
are recognised when the significant risks and rewards<br />
of ownership have been transferred to the buyer.<br />
Revenue from the provision of services is recognised in the<br />
proportion to the stage of completion of the transactions<br />
at the reporting date. The stage of completion is assessed<br />
by reference to surveys of work performed.<br />
d) Fees and fines<br />
Revenue from fees and fines is recognised upon the time<br />
the obligation to pay arises, pursuant to the issue of a<br />
notice or invoice.<br />
e) Interest<br />
Interest on funds invested is recognised as it accrues using<br />
the effective interest rate method.<br />
f) Contributions received<br />
Services received free of charge by the department, are<br />
recognised as income when a fair value can be reliably<br />
determined and at the time the services would have been<br />
purchased if they had not been donated. Use of those<br />
resources is recognised as an expense.<br />
Contributions of assets at no cost of acquisition or for<br />
nominal consideration are recognised at their fair value<br />
when the department obtains control of the asset, it is<br />
probable that future economic benefits comprising<br />
the contribution will flow to the department and the<br />
amount can be measured reliably. However, where the<br />
contribution received is from another government agency<br />
as a consequence of restructuring of administrative<br />
arrangements, they are recognised as contributions by<br />
owners directly within equity. In these circumstances,<br />
book values from the transferor agency have been used.<br />
g) Other revenue<br />
Revenue from other sources, including revenue generated<br />
from school activities and also school levies, is recognised<br />
as revenue when the department obtains control over the<br />
assets comprising the contributions. Control is normally<br />
obtained upon their receipt.<br />
114 Financial Statements » Notes
2.11<br />
Expenses<br />
from<br />
transactions<br />
Expenses are recognised in the Statement of<br />
Comprehensive Income when a decrease in future<br />
economic benefit related to a decrease in an asset or<br />
an increase of a liability has arisen that can be measured<br />
reliably.<br />
a) Employee benefits<br />
Employee benefits include, where applicable, entitlements<br />
to wages and salaries, annual leave, sick leave, long service<br />
leave, superannuation and other post-employment<br />
benefits.<br />
b) Depreciation and amortisation<br />
All applicable non-financial assets having a limited useful<br />
life are systematically depreciated over their useful lives<br />
in a manner which reflects the consumption of their<br />
service potential. Land, being an asset with an unlimited<br />
useful life, is not depreciated. Heritage assets are also not<br />
depreciated as their value does not diminish.<br />
Depreciation is provided for on a straight-line basis,<br />
using rates which are reviewed annually. Major<br />
depreciation periods are:<br />
Plant and equipment<br />
Buildings (masonry)<br />
Buildings (timber framed)<br />
Buildings (steel framed)<br />
Sundry structures<br />
Infrastructure<br />
Library book stock<br />
3–30 years<br />
60 years<br />
50 years<br />
50 years<br />
30 years<br />
80 years<br />
10–25 years<br />
All intangible assets having a limited useful life are<br />
systematically amortised over their useful lives reflecting<br />
the pattern in which the asset’s future economic benefits<br />
are expected to be consumed by the department.<br />
The department has assessed amortisation for intangible<br />
assets as 25%.<br />
The department undertook a revaluation of its land,<br />
buildings and heritage assets during 2009–10. As part of<br />
this revaluation exercise the department reviewed and<br />
amended the useful lives of its building and related assets,<br />
as per the lives in the above list. These amendments were<br />
made based on advice from the valuers, Liquid Pacific<br />
Holdings Pty Ltd. For further details refer to note 10.3(c).<br />
c) Supplies and consumables<br />
Supplies and consumables are recognised when the items<br />
have been received by the department.<br />
d) Grants and subsidies<br />
Grants and subsidies expenditure is recognised to the<br />
extent that:<br />
• the services required to be performed by the grantee<br />
have been performed; or<br />
• the grant eligibility criteria have been satisfied.<br />
A liability is recorded when the department has a binding<br />
agreement to make the grants but services have not been<br />
performed or criteria satisfied. Where grant monies are<br />
paid in advance of performance or eligibility, a prepayment<br />
is recognised.<br />
e) Other expenses<br />
Other expenses are recognised when the associated<br />
service and supply has been provided.<br />
2.12<br />
Other<br />
economic<br />
flows<br />
included in<br />
net result<br />
Other economic flow measures the change in volume<br />
or value of assets or liabilities that do not result from<br />
transactions.<br />
a) Gain/(loss) on sale of non-financial assets<br />
Gains or losses from the sale of non-financial assets are<br />
recognised when control of the assets has passed to<br />
the buyer.<br />
b) Impairment – financial assets<br />
Financial assets are assessed at each reporting date to<br />
determine whether there is any objective evidence that<br />
there are any financial assets that are impaired. A financial<br />
asset is considered to be impaired if objective evidence<br />
indicates that one or more events have had a negative<br />
affect on the estimated future cash flows of that asset.<br />
An impairment loss, in respect of a financial asset<br />
measured at amortised cost, is calculated as the difference<br />
between its carrying amount, and the present value of<br />
the estimated future cash flows discounted at the original<br />
effective interest rate.<br />
All impairment losses are recognised in the Statement of<br />
Comprehensive Income.<br />
An impairment loss is reversed if the reversal can be<br />
related objectively to an event occurring after the<br />
impairment loss was recognised. For financial assets<br />
measured at amortised cost and available-for-sale financial<br />
assets that are debt securities, the reversal is recognised<br />
directly in equity.<br />
c) Impairment – non-financial assets<br />
All non-financial assets are assessed to determine whether<br />
any impairment exists. Impairment exists when the<br />
recoverable amount of an asset is less than its carrying<br />
amount. Recoverable amount is the higher of fair value<br />
less costs to sell and value in use. The department’s<br />
assets are not used for the purpose of generating cash<br />
flows; therefore value in use is based on depreciated<br />
replacement cost where the asset would be replaced if<br />
deprived of it.<br />
All impairment losses are recognised in the Statement of<br />
Comprehensive Income unless a credit exists for the same<br />
class of asset in the asset revaluation reserve.<br />
In respect of other assets, impairment losses recognised in<br />
prior periods are assessed at each reporting date for any<br />
indications that the loss has decreased or no longer exists.<br />
An impairment loss is reversed if there has been a change<br />
in the estimates used to determine the recoverable<br />
amount. An impairment loss is reversed only to the extent<br />
that the asset’s carrying amount does not exceed the<br />
carrying amount that would have been determined, net of<br />
depreciation or amortisation, if no impairment loss had<br />
been recognised.<br />
Financial Statements » Notes<br />
115
2.13<br />
Assets<br />
Assets are recognised in the Statement of Financial<br />
Position where it is probable that the future economic<br />
benefits will flow to the department and the asset has a<br />
cost or a value that can be measured reliably.<br />
a) Cash and deposits<br />
Cash means notes, coins and deposits held at call with<br />
a bank or financial institution, for the department and<br />
schools, as well as funds held in the Special Deposits and<br />
Trust Fund. Deposits are recognised at amortised cost<br />
being their face value.<br />
b) Receivables<br />
Receivables are recognised at amortised cost, less any<br />
impairment losses, however, due to the short settlement<br />
period, receivables are not discounted back to their<br />
present value.<br />
c) Assets held for sale<br />
Assets held for sale (or disposal groups compromising<br />
assets and liabilities) that are expected to be recovered<br />
primarily through sale rather than continuing use are<br />
classified as held for sale. Immediately before classification<br />
as held for sale, the assets (or components of a<br />
disposal group) are remeasured in accordance with the<br />
department’s accounting policies. Thereafter the assets<br />
(or disposal group) are measured at the lower of carrying<br />
amount and fair value less costs to sell.<br />
d) Property, plant, equipment, infrastructure,<br />
library book stock and heritage<br />
(i) Valuation basis<br />
Land, buildings, infrastructure, and heritage assets and<br />
other long-lived assets are recorded at fair value less<br />
accumulated depreciation. All other non-current physical<br />
assets, including work in progress, are recorded at historic<br />
cost less accumulated depreciation and accumulated<br />
impairment losses.<br />
In determining the fair value of land, reference is made<br />
to the best available market evidence of the price of the<br />
same or similar asset, evidence is drawn from sale of<br />
nearby land where available.<br />
In determining the fair value of buildings and infrastructure<br />
assets, a determination is made whether the asset is of<br />
a specialised nature or openly traded in the market. The<br />
majority of the department’s building and infrastructure<br />
assets are of a specialised nature, i.e. school buildings.<br />
The fair value of the department’s specialised buildings<br />
and infrastructure is estimated by the sum of current<br />
market prices for one or more transactions required<br />
to reproduce or replace the assets with the modern<br />
equivalent, less accumulated depreciation. As part of<br />
calculating an asset’s depreciation a ‘utility’ factor has<br />
been applied which factors in the current spare capacity.<br />
For non-specialised building and infrastructure assets the<br />
fair value is derived from market evidence on a direct<br />
comparison basis.<br />
Heritage assets with an intrinsic value are valued with<br />
reference to sales of identical or similar assets, evidenced<br />
in an open and transparent market place. Assets for<br />
which a buying price is readily accessible are valued at this<br />
replacement cost.<br />
All other non-current physical assets, including work in<br />
progress, are recorded at historic cost less accumulated<br />
depreciation and accumulated impairment losses.<br />
Cost includes expenditure that is directly attributable to<br />
the acquisition of the asset. The costs of self-constructed<br />
assets includes the cost of materials and direct labour,<br />
any other costs directly attributable to bringing the asset<br />
to a working condition for its intended use, and the costs<br />
of dismantling and removing the items and restoring the<br />
site on which they are located. Purchased software that is<br />
integral to the functioning ability of the related equipment<br />
is capitalised as part of that equipment.<br />
When parts of an item of property, plant and equipment<br />
have different useful lives, they are accounted for as<br />
separate items (major components) of property, plant<br />
and equipment.<br />
(ii) Subsequent costs<br />
The cost of replacing part of an item of property,<br />
plant and equipment is recognised in the carrying amount<br />
of the item if it is probable that future economic benefits<br />
embodied within the part will flow to the department and<br />
its costs can be measured reliably. The carrying amount of<br />
the replaced part is derecognised. The costs of day-to-day<br />
servicing of property, plant and equipment are recognised<br />
in profit or loss as incurred.<br />
(iii) Asset recognition threshold<br />
The asset capitalisation threshold adopted by the<br />
department is $150,000 for intangible assets and<br />
major capital works, and $10,000 for all other assets.<br />
Assets valued at less than these thresholds are charged to<br />
the Statement of Comprehensive Income in the year of<br />
purchase (other than where they form part of a group of<br />
similar items which are material in total).<br />
(iv) Revaluations<br />
The department revalues applicable assets on a program<br />
of five years. In accordance, with AASB 116 Property,<br />
Plant and Equipment, in years between valuations,<br />
indices supplied by qualified valuers are used to establish<br />
fair value.<br />
Assets are grouped on the basis of having a similar nature<br />
or function in the operations of the department.<br />
e) Other assets<br />
The department recognises some other small assets<br />
such as prepayments of expenditure and GST input tax<br />
credits received.<br />
f) Intangibles<br />
Intangible assets held by the department are valued at fair<br />
value less any subsequent accumulated amortisation and<br />
any subsequent impairment losses where an active market<br />
exists. Where no active market exists, intangibles are<br />
valued at cost less any accumulated amortisation and any<br />
accumulated impairment losses.<br />
116 Financial Statements » Notes
2.14<br />
Liabilities<br />
Liabilities are recognised in the Statement of Financial<br />
Position when it is probable that an outflow of resources<br />
embodying economic benefits will result from the<br />
settlement of a present obligation and the amount at<br />
which the settlement will take place can be measured<br />
reliably.<br />
a) Payables<br />
Payables, including goods received and services incurred<br />
but not yet invoiced, are recognised at the amortised cost<br />
which due to the short settlement period, equates to<br />
face value, when the department becomes obliged to<br />
make future payments as a result of a purchase of assets<br />
or services.<br />
b) Employee benefits<br />
Liabilities for wages and salaries and annual leave are<br />
recognised when the employee becomes entitled to<br />
receive a benefit. Those liabilities expected to be realised<br />
within 12 months are measured as the amount expected<br />
to be paid. Other employee benefits are measured as the<br />
present value of the benefit at 30 June 2013, where the<br />
impact of discounting is material, and at the amount<br />
expected to be paid if discounting is not material.<br />
A liability for long service leave is recognised,<br />
and is measured as the present value of expected future<br />
payments to be made in respect of services provided by<br />
employees up to the reporting date.<br />
c) Superannuation<br />
Defined contribution plans<br />
A defined contribution plan is a post-employment benefit<br />
plan under which an entity pays fixed contributions into<br />
a separate entity and will have no legal or constructive<br />
obligation to pay further amounts. Obligations for<br />
contributions to defined contribution plans are recognised<br />
as an expense when they fall due.<br />
Defined benefit plans<br />
A defined benefit plan is a post-employment benefit plan<br />
other than a defined contribution plan.<br />
The department does not recognise a liability for the<br />
accruing superannuation benefits of departmental<br />
employees. This liability is held centrally and recognised<br />
within the Finance-General Division of the Department of<br />
Treasury and Finance.<br />
d) Other liabilities<br />
Other liabilities, includes revenue received in advance,<br />
where the department has received funds for which<br />
goods or services have not yet been provided or where<br />
specific conditions have not been met. The revenue will<br />
be recognised in the following financial year when the<br />
department gains control of the funds when the goods or<br />
services have been provided or when specific conditions<br />
have been met.<br />
2.15<br />
Leases<br />
The department has entered into a number of operating<br />
lease agreements for property, plant and equipment,<br />
where the lessors effectively retain all of the risks and<br />
benefits incidental to ownership of the items leased.<br />
Equal instalments of lease payments are charged to the<br />
Statement of Comprehensive Income over the lease term,<br />
as this is representative of the pattern of benefits to be<br />
derived from the leased property.<br />
The department is prohibited under Treasurer’s<br />
Instruction 502 Leases from holding finance leases.<br />
2.16<br />
Unrecognised<br />
financial<br />
instruments<br />
The department has no unrecognised financial instruments.<br />
2.17<br />
Judgements<br />
and<br />
assumptions<br />
In the application of Australian Accounting Standards, the<br />
department is required to make judgements, estimates<br />
and assumptions about carrying values of assets and<br />
liabilities that are not readily apparent from other sources.<br />
The estimates and associated assumptions are based<br />
on historical experience and various other factors that<br />
are believed to be reasonable under the circumstances,<br />
the results of which form the basis of making the<br />
judgements. Actual results may differ from these estimates.<br />
The estimates and underlying assumptions are reviewed<br />
on an ongoing basis. Revisions to accounting estimates are<br />
recognised in the period in which the estimate is revised<br />
if the revision affects only that period or in the period of<br />
the revision and future periods if the revision affects both<br />
current and future periods.<br />
The department has made some judgements and<br />
assumptions in its determination of fair value for buildings.<br />
In particular:<br />
(i) the application of a utility factor to the valuation of<br />
specialised buildings to address the underutilisation<br />
of some school buildings<br />
(ii) the determination of projected long term<br />
enrolments if the department were deprived of<br />
the asset and they would be replaced. Refer to<br />
note 10.3(c) for further details.<br />
The department has made no other material assumptions<br />
or judgements that may cause a material adjustment to<br />
the carrying amounts of assets and liabilities within the<br />
next reporting period.<br />
Other judgements made by the department that have<br />
significant effects on the financial statements are disclosed<br />
in the relevant notes to the financial statements.<br />
Financial Statements » Notes<br />
117
2.18<br />
Foreign<br />
currency<br />
Transactions denominated in a foreign currency are converted at the exchange rate at the date of the transaction.<br />
Foreign currency receivables and payables are translated at the exchange rates current as at balance date.<br />
2.19<br />
Comparative<br />
figures<br />
Comparative figures have been adjusted to reflect any<br />
changes in accounting policy or the adoption of new<br />
standards.<br />
Where amounts have been reclassified within the<br />
financial statements, the comparative statements have<br />
been restated.<br />
The comparatives for administrative restructures are not<br />
reflected in the financial statements.<br />
2.20<br />
Budget<br />
information<br />
Budget information refers to original estimates as disclosed in the 2012–13 Budget Papers and is not subject to audit.<br />
2.21<br />
Rounding<br />
All amounts in the financial statements have been rounded to the nearest thousand dollars unless otherwise stated.<br />
Where the result of expressing amounts to the nearest thousand dollars would result in an amount of zero, the financial<br />
statement will contain a note expressing the amount to the nearest whole dollar.<br />
2.22<br />
Departmental<br />
taxation<br />
The department is exempt from all forms of taxation<br />
except Fringe Benefits Tax, Payroll Tax and the Goods and<br />
Services Tax (GST).<br />
The Tasmanian Government has announced that the<br />
department is no longer subject to Payroll Tax from<br />
1 October 2012.<br />
2.23<br />
Goods and<br />
services tax<br />
Revenue, expenses and assets are recognised net of the<br />
amount of Goods and Services Tax, except where the<br />
GST incurred is not recoverable from the Australian<br />
Taxation Office (ATO). Receivables and payables are<br />
stated inclusive of GST. The net amount recoverable,<br />
or payable, to the ATO is recognised as an asset or liability<br />
within the Statement of Financial Position.<br />
In the Statement of Cash Flows, the GST component of<br />
cash flows arising from operating, investing or financing<br />
activities which is recoverable from, or payable to, the<br />
Australian Taxation Office is, in accordance with the<br />
Australian Accounting Standards, classified as operating<br />
cash flows.<br />
Note 3: Departmental output schedules<br />
3.1<br />
Output group<br />
information<br />
Comparative information has not been restated for<br />
external administrative restructures.<br />
Budget information refers to original estimates for the<br />
department and has not been subject to audit.<br />
118 Financial Statements » Notes
Output<br />
Group 1:<br />
Pre-Compulsory<br />
and<br />
Compulsory<br />
<strong>Education</strong><br />
Transactions denominated in a foreign currency are converted at the exchange rate at the date of the transaction.<br />
Foreign currency receivables and payables are translated at the exchange rates current as at balance date.<br />
Continuing operations<br />
Revenue and other income from transactions<br />
2013<br />
Budget<br />
$’000<br />
2013<br />
Actual<br />
$’000<br />
2012<br />
Actual<br />
$’000<br />
Revenue from appropriation 664,649 642,846 696,065<br />
Interest revenue 1,614 1,217 1,896<br />
Grants 42,246 57,903 967<br />
Sales of goods and services 22,054 22,722 27,693<br />
Contributions received – 12,665 –<br />
Other revenue 24,810 18,064 28,307<br />
Total revenue and other income from transactions 755,373 755,417 754,928<br />
Expenses from transactions<br />
Employee benefits 486,880 509,823 496,494<br />
Superannuation 56,952 57,106 55,377<br />
Depreciation 28,296 36,602 38,594<br />
Grants and subsidies 7,094 12,230 2,755<br />
Supplies and consumables<br />
Communications 1,177 1,740 2,436<br />
Consultants 1,381 3,140 1,117<br />
Information and technology 23,123 25,570 28,062<br />
Maintenance and property services 30,995 66,839 45,039<br />
Travel and transport 3,143 6,274 4,769<br />
Other supplies and consumables 111,973 46,829 76,131<br />
Other expenses 40,520 20,665 33,183<br />
Total expenses from transactions 791,534 786,818 783,957<br />
Net operating result from continuing transactions (36,161) (31,401) (29,029)<br />
Other economic flows included in net result<br />
Net gain/(loss) on sale of non-financial assets 237 902 (2,700)<br />
Net gain/(loss) on financial instruments and statutory receivables/payables – 1 12<br />
Net gain/(loss) associated with transitional data transfers – – (14,346)<br />
Total other economic flows included in net result 237 903 (17,034)<br />
Net result (35,924) (30,498) (46,063)<br />
Other economic flows – other non-owner changes in equity<br />
Changes in physical asset revaluation reserve 22,136 46,149 54,376<br />
Total other economic flows – other non-owner changes in equity 22,136 46,149 54,376<br />
Comprehensive result (13,788) 15,651 8,313<br />
Expense by output<br />
1.1 In-school education 764,991 763,718 757,366<br />
1.2 Learning Services 13,138 11,401 12,506<br />
1.3 <strong>Education</strong>al Performance Services 1,442 1,735 1,633<br />
1.4 Early Years 4,957 5,301 5,151<br />
1.5 Grants and financial assistance 7,006 4,663 7,301<br />
Total 791,534 786,818 783,957<br />
Net assets<br />
Total assets deployed for Pre-Compulsory and Compulsory <strong>Education</strong> 1,281,686 1,247,818<br />
Total liabilities incurred for Pre-Compulsory and Compulsory <strong>Education</strong> (123,575) (128,021)<br />
Net assets deployed for Pre-Compulsory and Compulsory <strong>Education</strong> 1,158,111 1,119,797<br />
Financial Statements » Notes<br />
119
Output<br />
Group 2:<br />
Post-<br />
Compulsory<br />
<strong>Education</strong><br />
and Skills<br />
Development<br />
Continuing operations<br />
Revenue and other income from transactions<br />
2013<br />
Budget<br />
$’000<br />
2013<br />
Actual<br />
$’000<br />
2012<br />
Actual<br />
$’000<br />
Revenue from appropriation 196,411 192,657 199,628<br />
Interest revenue – – 139<br />
Grants 16,625 670 3,467<br />
Sales of goods and services 22,179 19,436 15,889<br />
Other revenue 675 5,287 6,954<br />
Total revenue and other income from transactions 235,890 218,050 226,077<br />
Expenses from transactions<br />
Employee benefits 110,051 114,876 115,889<br />
Superannuation 13,987 12,910 13,148<br />
Depreciation 10,539 11,765 7,041<br />
Grants and subsidies 43,765 46,426 41,559<br />
Supplies and consumables<br />
Communications 125 527 650<br />
Consultants 142 509 550<br />
Information and technology 2,347 1,336 1,986<br />
Maintenance and property services 4,722 7,662 6,827<br />
Travel and transport 439 1,706 1,751<br />
Other supplies and consumables 49,647 18,363 21,072<br />
Other expenses 8,604 3,718 7,132<br />
Total expenses from transactions 244,368 219,798 217,605<br />
Net operating result from continuing transactions (8,478) (1,748) 8,472<br />
Other economic flows included in net result<br />
Net gain/(loss) on sale of non-financial assets – (6) (49)<br />
Net gain/(loss) on financial instruments and statutory receivables/payables – (84) (227)<br />
Total other economic flows included in net result – (90) (276)<br />
Net result (8,478) (1,838) 8,196<br />
Other economic flows – other non-owner changes in equity<br />
Changes in physical asset revaluation reserve 2,700 15,389 6,853<br />
Total other economic flows – other non-owner changes in equity 2,700 15,389 6,853<br />
Comprehensive result (5,778) 13,551 15,049<br />
Expense by output<br />
2.1 Skills development contestable funding 53,359 48,836 43,996<br />
2.2 Tasmanian Polytechnic 92,625 73,554 72,520<br />
2.3 Tasmanian Academy 80,994 77,378 83,041<br />
2.4 Post-compulsory in school education 3,783 7,244 5,218<br />
2.5 Skills Tasmania 7,565 7,344 7,328<br />
2.6 Tasmanian Qualifications Authority 3,904 3,664 3,697<br />
2.7 Grants and financial assistance 2,138 1,778 1,805<br />
Total 244,368 219,798 217,605<br />
Net assets<br />
Total assets deployed for Post-Compulsory <strong>Education</strong> and Skills Development 382,092 376,568<br />
Total liabilities incurred for Post-Compulsory <strong>Education</strong> and Skills Development (30,373) (31,670)<br />
Net assets deployed for Post-Compulsory <strong>Education</strong> and Skills Development 351,719 344,898<br />
120 Financial Statements » Notes
Output<br />
Group 3:<br />
LINC<br />
Tasmania<br />
Continuing operations<br />
Revenue and other income from transactions<br />
2013<br />
Budget<br />
$’000<br />
2013<br />
Actual<br />
$’000<br />
2012<br />
Actual<br />
$’000<br />
Revenue from appropriation 32,154 31,270 30,984<br />
Grants 5 – –<br />
Fees and fines 580 317 350<br />
Sales of goods and services 2,529 716 1,672<br />
Contributions received 80 72 111<br />
Other revenue – 1,269 4,841<br />
Total revenue and other income from transactions 35,348 33,644 37,958<br />
Expenses from transactions<br />
Employee benefits 21,948 21,810 22,267<br />
Superannuation 2,620 2,598 2,500<br />
Depreciation 2,349 3,912 3,819<br />
Grants and subsidies – 526 586<br />
Supplies and consumables<br />
Communications 426 174 190<br />
Consultants 10 28 17<br />
Information and technology 1,235 826 900<br />
Maintenance and property services 2,027 2,461 2,482<br />
Travel and transport 308 207 213<br />
Other supplies and consumables 3,766 1,992 4,058<br />
Other expenses 1,729 879 1,458<br />
Total expenses from transactions 36,418 35,413 38,490<br />
Net operating result from continuing transactions (1,070) (1,769) (532)<br />
Other economic flows included in net result<br />
Net gain/(loss) on sale of non-financial assets – 127 (1,028)<br />
Net gain/(loss) on financial instruments and statutory receivables/payables – – (145)<br />
Total other economic flows included in net result – 127 (1,173)<br />
Net result (1,070) (1,642) (1,705)<br />
Other economic flows – other non-owner changes in equity<br />
Changes in physical asset revaluation reserve 1,532 3,104 5,319<br />
Total other economic flows – other non-owner changes in equity 1,532 3,104 5,319<br />
Comprehensive result 462 1,462 3,614<br />
Expense by output<br />
3.1 Information Services and Community Learning 33,312 32,340 35,239<br />
3.2 Tasmanian Archives and Heritage Office 3,106 3,073 3,251<br />
Total 36,418 35,413 38,490<br />
Net assets<br />
Total assets deployed for LINC Tasmania 131,366 129,807<br />
Total liabilities incurred for LINC Tasmania (6,152) (6,549)<br />
Net assets deployed for LINC Tasmania 125,214 123,258<br />
Financial Statements » Notes<br />
121
Output Group:<br />
Capital<br />
Investment<br />
Program<br />
Continuing operations<br />
Revenue and other income from transactions<br />
2013<br />
Budget<br />
$’000<br />
2013<br />
Actual<br />
$’000<br />
2012<br />
Actual<br />
$’000<br />
Appropriation revenue – recurrent – – –<br />
Other revenue – 5,553 6,280<br />
Total revenue and other income from transactions – 5,553 6,280<br />
Expenses from transactions<br />
Expenditure program 1 1,749 3,375 10,043<br />
Total expenses from transactions 1,749 3,375 10,043<br />
Net operating result from continuing transactions (1,749) 2,178 (3,763)<br />
Non-operational capital funding<br />
Revenue from government<br />
Appropriation revenue – works and services 12,050 12,161 61,384<br />
Other revenue from government 16,465 – 1,161<br />
Grants 8,882 – –<br />
Total non-operating capital funding 37,397 12,161 62,545<br />
Net result from transactions (net operating balance) 35,648 14,339 58,782<br />
Net result 35,648 14,339 58,782<br />
Comprehensive result 35,648 14,339 58,782<br />
Net assets<br />
Total liabilities incurred for Capital Investment Program (3,377) (15,461)<br />
Net assets deployed for Capital Investment Program (3,377) (15,461)<br />
1. Expenditure program relates to maintenance programs, Building the <strong>Education</strong> Revolution program administration costs and capital expenditure which falls<br />
under the department’s capitalisation threshold.<br />
3.2<br />
Reconciliation<br />
of total<br />
output groups’<br />
comprehensive<br />
result to<br />
Statement of<br />
Comprehensive<br />
Income<br />
2013<br />
Budget<br />
$’000<br />
2013<br />
Actual<br />
$’000<br />
2012<br />
Actual<br />
$’000<br />
Total comprehensive result of output groups 16,544 45,003 85,757<br />
Comprehensive result 16,544 45,003 85,757<br />
3.3<br />
Reconciliation<br />
of total output<br />
groups’ net<br />
assets to<br />
Statement<br />
of Financial<br />
Position<br />
2013<br />
Actual<br />
$’000<br />
2012<br />
Actual<br />
$’000<br />
Total net assets deployed for output groups 1,631,667 1,572,492<br />
Reconciliation to net assets<br />
Assets unallocated to output groups 16,139 33,314<br />
Net assets 1,647,806 1,605,806<br />
122 Financial Statements » Notes
3.4<br />
Administered<br />
output<br />
schedule<br />
Comparative information has not been restated for external administrative restructures.<br />
Budget information refers to original estimates for the department and has not been subject to audit.<br />
Administered revenue and other income from transactions<br />
2013<br />
Budget<br />
$’000<br />
2013<br />
Actual<br />
$’000<br />
2012<br />
Actual<br />
$’000<br />
Revenue from appropriation 236,694 233,524 231,895<br />
Grants 569 2,703 661<br />
Sales of goods and services 343 155 153<br />
Fees and fines – 12 24<br />
Other revenue – 9 5<br />
Total administered revenue and other income from transactions 237,606 236,403 232,738<br />
Administered expenses from transactions<br />
Australian Government: grants to non-government schools 180,404 177,458 177,726<br />
Non-government schools: grants 54,833 57,334 52,692<br />
Non-government schools: capital assistance 1,071 1,141 1,141<br />
Non-government schools: student assistance 386 299 318<br />
Transfers to Consolidated Fund 912 171 864<br />
Total administered expenses from transactions 237,606 236,403 232,741<br />
Administered net result from transactions (net operating balance) – – (3)<br />
Administered net assets<br />
Total administered assets deployed – –<br />
Administered net assets deployed – –<br />
3.5<br />
Reconciliation<br />
of total<br />
administered<br />
output groups’<br />
comprehensive<br />
result to<br />
administered<br />
Statement of<br />
Changes in<br />
Equity<br />
2013<br />
Budget<br />
$’000<br />
2013<br />
Actual<br />
$’000<br />
2012<br />
Actual<br />
$’000<br />
Total administered net result of output groups – – (3)<br />
Net surplus (deficit) – – (3)<br />
3.6<br />
Reconciliation<br />
of total<br />
administered<br />
output groups’<br />
net assets to<br />
Schedule of<br />
Administered<br />
Assets and<br />
Liabilities<br />
2013<br />
Actual<br />
$’000<br />
2012<br />
Actual<br />
$’000<br />
Total administered net assets deployed for output groups – –<br />
Administered net assets – –<br />
Financial Statements » Notes<br />
123
Note 4: Explanations of material variances between<br />
budget and actual outcomes<br />
4.1<br />
Statement of<br />
Comprehensive<br />
Income<br />
Note<br />
Budget<br />
$’000<br />
Actual<br />
$’000<br />
Variance<br />
$’000<br />
Variance<br />
%<br />
Appropriation revenue – recurrent 1 893,214 866,773 (26,441) (3)<br />
Other revenue from government 2 16,465 5,553 (10,912) (66)<br />
Grants 3 67,758 58,573 (9,185) (14)<br />
Contributions received 4 80 12,740 12,660 (15,825)<br />
Employee benefits 5 693,153 719,846 (26,693) (4)<br />
Depreciation 6 41,184 52,279 (11,095) (27)<br />
Supplies and consumables 5 237,974 188,822 49,152 21<br />
Grants and subsidies 7 50,859 59,182 (8,323) (16)<br />
Other expenses 1 50,899 25,275 25,624 50<br />
Changes in physical asset revaluation reserve 8 26,368 64,642 38,274 145<br />
Notes to Statement of Comprehensive Income variances<br />
1. The variance is the result of the government’s decision to remove the requirement for inner budget agencies to be subject to payroll tax. Also, there was<br />
an increased appropriation for VET Reform and asset sales offset by a reduction in Australian Government Specific Purpose Payments.<br />
2. The variance is the result of the approved carry forward under section 8A(2) of the Public Account Act 1986 from 2011–12 financial year not being fully<br />
expended, subsequently $7.674m was repaid to the Department of Treasury and Finance. In addition, at the time of the budget development the estimated<br />
carry forward was $16.465m but actual approved carry forward was $13.227m.<br />
3. The variance is the result of lower than budgeted revenue from the Australian Government for National Partnerships due to timing variances. These funds<br />
will be received during the 2013–14 financial year.<br />
4. This variance is the result of the recognition of $11.8m from the Tasmanian Risk Management Fund for the cost of providing a temporary school and the<br />
rebuilding of the Dunalley Primary School which was destroyed by bushfires in January 2013.<br />
5. The variance has been influenced by the delivery of Australian Government’s National Partnerships funding through the School Resource Package (SRP).<br />
These funds had been originally budgeted to be expended as supplies and consumables; however, delivery of the funding through the SRP has resulted in<br />
the expenditure being primarily employee entitlements. As a result, employee benefits were higher than budgeted but with a corresponding saving against<br />
supplies and consumables. In addition, as per note 3 grants revenue was lower than budgeted therefore the corresponding expenditure against supplies<br />
and consumables was lower than budgeted.<br />
6. The variance is the result of the budget being developed on expected changes to the useful life of assets, asset reaching the end of their depreciable life,<br />
asset sales, and demolition of former school sites. These did not occur to the level expected.<br />
7. The variance is influenced by a number of factors including that at the time of the budget development for National Partnerships the distribution between<br />
government and non-government sectors was unclear. The budget was therefore allocated for all National Partnership expenditure against supplies and<br />
consumables. Therefore, a corresponding saving exists in that item. In addition, there were increased grant payments for contestable funding for vocational<br />
education and training. This is the result of the Australian Government increasing the number of courses that have to be contested in the training market.<br />
8. The variance is the result of the reassessment of the department’s valuation of specialised assets in the current year.<br />
4.2<br />
Statement<br />
of Financial<br />
Position<br />
Note<br />
Budget<br />
$’000<br />
Actual<br />
$’000<br />
Variance<br />
$’000<br />
Variance<br />
%<br />
Cash and deposits 1 44,981 53,570 8,589 19<br />
Receivables 2 12,969 17,137 4,168 32<br />
Intangibles 3 – 2,271 2,271 –<br />
Other liabilities 4 14,620 4,846 (9,774) (67)<br />
Reserves 5 302,030 385,387 83,357 28<br />
Notes to Statement of Financial Position variances<br />
1. The variance is influenced by schools retained funds at a higher level than budgeted. In addition, the budget estimate being based upon the department not<br />
having an expectation of carry forward appropriation. However, an appropriation of $3.1m was carried forward as provided under section 8A(2) Public<br />
Account Act 1986.<br />
2. This variance is influenced by the recognition of funding of $6.6m that is receivable from the Tasmanian Risk Management Fund for the rebuilding of the<br />
Dunalley Primary School which was destroyed by bushfires in January 2013.<br />
3. The variance is the result of an intangible asset being recognised for the first time. At the time of the budget development it was not known if the asset<br />
would be commissioned during 2012–13. It was previously incorporated in works in progress.<br />
4. The variance is the result of the government’s decision to remove the requirement for inner budget agencies to be subject to payroll tax. Therefore, leave<br />
liabilities no longer accrue a provision for payroll tax.<br />
5. The variance is the result of the reassessment of the department’s valuation of specialised assets in the current year.<br />
124 Financial Statements » Notes
4.3<br />
Statement of<br />
Cash Flows<br />
Note<br />
Budget<br />
$’000<br />
Actual<br />
$’000<br />
Variance<br />
$’000<br />
Variance<br />
%<br />
Appropriation revenue – recurrent 1 893,214 866,773 (26,441) (3)<br />
Grants 2 67,758 58,573 (9,185) (14)<br />
GST receipts 3 48,574 33,440 (15,134) (31)<br />
Employee benefits 4 684,541 723,551 (39,010) (6)<br />
GST payments 3 47,378 32,160 (15,218) (32)<br />
Supplies and consumables 4 243,389 190,240 53,149 22<br />
Grants and subsidies 5 50,859 57,911 (7,052) (14)<br />
Other cash payments 1 50,333 25,563 24,770 49<br />
Proceeds from the disposal of non-financial assets 6 – 2,502 2,502 –<br />
Payments for the acquisition of non-financial assets 7 39,827 22,043 17,784 45<br />
Appropriation repayment to Treasury 7 – 7,674 (7,674) –<br />
Notes to Statement of Cash Flows variances<br />
1. The variance is the result of the government’s decision to remove the requirement for inner budget agencies to be subject to payroll tax. Also, there was<br />
an increased appropriation for VET Reform and asset sales offset by a reduction in Australian Government Specific Purpose Payments.<br />
2. The variance is the result of lower than budgeted revenue from the Australian Government for National Partnerships due to timing variances. These funds<br />
will be received during the 2013–14 financial year.<br />
3. The variance is influenced by consolidated of all schools on the one Business Activity Statement therefore payments between schools and the department<br />
attracted GST which is no longer the case. In addition, the transactions that were budgeted to attract GST did not occur at the level estimated such as<br />
employee benefits which does not attract GST.<br />
4. The variance has been influenced by the Australian Government’s National Partnerships being budgeted against supplies and consumables. However as<br />
programs were developed under these partnerships expenditure was incurred on employee benefits. As a result, employee benefits were higher than<br />
budgeted but with a corresponding saving against supplies and consumables. In addition, as per note 3 grants revenue was lower than budgeted therefore<br />
the corresponding expenditure against supplies and consumables was lower than budgeted.<br />
5. The variance is influenced by a number of factors including that at the time of the budget development for National Partnerships the distribution between<br />
government and non-government sectors was unclear. The budget was therefore allocated for all National Partnership expenditure against supplies and<br />
consumables. Therefore, a corresponding saving exists in that item. In addition, there were increased grant payments for contestable funding for vocational<br />
education and training. This is the result of the Australian Government increasing the number of courses that have to be contested in the training market.<br />
6. The variance is influenced by asset sales that were not undertaken through Crown Lands Administration Fund (CLAF) therefore no budget provision of<br />
was made. Asset sales made through CLAF are recognised as an adjustment directly to equity.<br />
7. The variance is the result of the approved carry forward under section 8A(2) of the Public Account Act 1986 from 2011–12 financial year not being<br />
fully expended, subsequently $7.674m was repaid to the Department of Treasury and Finance. In addition, at the time of the budget development the<br />
estimated carry forward was $16.465m but actual approved carry forward was $13.227m. These carry forwards relate to payments for the acquisition<br />
of non-financial assets.<br />
Note 5: Events occurring after balance date<br />
There have been no events subsequent to balance date<br />
which would have a material effect on the department’s<br />
Financial Statements as at 30 June 2013.<br />
Following the enactment of the Training and Workforce<br />
Development Act 2013, a new statutory authority named<br />
TasTAFE was created effective from 1 July 2013.<br />
TasTAFE is the new public provider of vocational<br />
education and training for Tasmania. It has been created<br />
through the amalgamation of the statutory authority<br />
Tasmanian Skills Institute and the Tasmanian Polytechnic<br />
operations of the Department of <strong>Education</strong>.<br />
Some assets, liabilities, contracts, and staff of the<br />
department have been transferred to the new TasTAFE<br />
statutory authority. The assets and liabilities have been<br />
transferred in accordance with Treasurer’s Instruction<br />
208 ‘Contributions to State-owned Entities’.<br />
On 19 June 2013, the Minister for <strong>Education</strong> and Skills<br />
made a determination under section 4(3) of the<br />
Training and Workforce Development (Transitional Provisions)<br />
Act 2013 that all land and fixtures that were held before<br />
1 July 2013 in relation to the performance of any functions<br />
of the Tasmanian Polytechnic is not Polytechnic property.<br />
Therefore, these land and fixtures have not transferred to<br />
TasTAFE and continue to be held by the Crown in right<br />
of Tasmania. This determination was gazetted on the<br />
26 June 2013.<br />
Although ownership of land and building will remain with<br />
the Department of <strong>Education</strong>, a licensing agreement<br />
permits TasTAFE to continue to operate on these<br />
sites. From an accounting perspective, the Australian<br />
Accounting Standards Board (AASB) ‘Framework for<br />
the Preparation and Presentation of Financial Statements’<br />
notes that an asset is ‘a resource controlled by an entity<br />
as a result of past events and from which future<br />
economic benefits are expected to flow to the entity’.<br />
Further AASB 116 requires an asset to be recognised<br />
when it is probable that future economic benefits<br />
associated with the item will flow to the entity and the<br />
cost of the item can be reliably measured. Therefore,<br />
from 1 July 2013, land and buildings used by TasTAFE<br />
will be reported at fair value in the financial statements<br />
of TasTAFE.<br />
In addition, Skills Tasmania has ceased to be a statutory<br />
authority from 30 June 2013. Skills Tasmania maintains its<br />
name and functions, but has become a business unit of<br />
the department therefore will no longer be a separate<br />
consolidated entity listed in note 16.<br />
Financial Statements » Notes<br />
125
Note 6: Underlying net operating balance<br />
Non-operational capital funding is the income from transactions relating to funding for capital projects. This funding is<br />
classified as income from transactions and included in the net operating balance. However, the corresponding capital<br />
expenditure is not included in the calculation of the net operating balance. Accordingly, the net operating balance will<br />
portray a position that is better than the true underlying financial result.<br />
For this reason, the net operating result is adjusted to remove the effects of funding for capital projects.<br />
Notes<br />
2013<br />
Budget<br />
$’000<br />
2013<br />
Actual<br />
$’000<br />
2012<br />
Actual<br />
$’000<br />
Net result from transactions (net operating balance) (9,824) (19,639) 19,209<br />
Less impact of non-operational capital funding<br />
Revenue from government – works and services 2.10(a), 7.1 12,050 12,161 61,384<br />
Other revenue from government 2.10(a), 7.1 – – 1,162<br />
Total 12,050 12,161 62,546<br />
Underlying net operating balance (21,874) (31,800) (43,337)<br />
Note 7: Income from transactions<br />
7.1<br />
Revenue from<br />
Government<br />
Revenue from government includes revenue from appropriations, appropriations carried forward under section 8A(2)<br />
of the Public Account Act 1986 and items Reserved by Law.<br />
The budget information is based upon original estimates which have not been subject to audit.<br />
Continuing operations<br />
Appropriation revenue – recurrent<br />
2013<br />
Budget<br />
$’000<br />
2013<br />
Actual<br />
$’000<br />
2012<br />
Actual<br />
$’000<br />
Current year 893,214 866,773 926,677<br />
Total 893,214 866,773 926,677<br />
Appropriation revenue – works and services 12,050 12,161 61,384<br />
Total 12,050 12,161 61,384<br />
Revenue from government – other<br />
Appropriation carried forward under section 8A(2) of the Public<br />
Account Act 1986 taken up as revenue in the current year<br />
Other non-operational capital funding<br />
16,465 5,553 6,280<br />
Other revenue from government – – 1,161<br />
Total other revenue 16,465 5,553 7,441<br />
Total revenue from government 921,729 884,487 995,502<br />
Section 8A(2) of the Public Account Act 1986 allows for an unexpended balance of an appropriation to be transferred to<br />
an account in the Special Deposits and Trust Fund for such purposes and conditions as approved by the Treasurer. In the<br />
initial year, the carry forward is recognised as a liability, revenue received in advance. The carry forward from the initial<br />
year is recognised as revenue in the reporting year, assuming that the conditions of the carry forward are met and the<br />
funds are expended.<br />
126 Financial Statements » Notes
7.2<br />
Grants<br />
Continuing operations<br />
Grants from the Australian Government<br />
2013<br />
$’000<br />
2012<br />
$’000<br />
Specific grants 2,562 3,419<br />
National Partnership grants 54,274 –<br />
Total grants from Australian Government 56,836 3,419<br />
Grants – other<br />
Grants 1,737 1,909<br />
Total grants – other 1,737 1,909<br />
Total grants 58,573 5,329<br />
7.3<br />
Sales of<br />
goods and<br />
services<br />
Goods<br />
2013<br />
$’000<br />
2012<br />
$’000<br />
School supplies 1,708 3,031<br />
Services<br />
Overseas students 5,036 5,544<br />
Adult education fees 881 1,439<br />
School levies 10,922 9,530<br />
Other student collections 8,931 9,247<br />
Teachers’ registration fees 1,127 1,071<br />
Corporate services 6,294 6,401<br />
Other 7,975 8,767<br />
Total 42,874 45,030<br />
7.4<br />
Fees and fines<br />
2013<br />
$’000<br />
2012<br />
$’000<br />
Library fines 317 350<br />
Total 317 350<br />
7.5<br />
Contributions<br />
received<br />
2013<br />
$’000<br />
2012<br />
$’000<br />
Tasmanian Risk Management Fund – insurance claims 11,861 –<br />
Donation 687 125<br />
Fair value of library books donated 192 100<br />
Total 12,740 225<br />
7.6<br />
Other<br />
revenue<br />
2013<br />
$’000<br />
2012<br />
$’000<br />
Workers’ compensation refunds 4,931 4,423<br />
Miscellaneous school revenue 13,254 25,113<br />
Salary recovered from external bodies 1,210 691<br />
LINC Tasmania collections 116 805<br />
Rental properties 620 316<br />
Other 4,486 7,969<br />
Total 24,617 39,317<br />
Financial Statements » Notes<br />
127
Note 8: Expenses from transactions<br />
8.1<br />
Employee<br />
benefits<br />
2013<br />
$’000<br />
2012<br />
$’000<br />
Wages and salaries 603,687 585,292<br />
Annual leave 16,925 20,771<br />
Sick leave 16,041 14,135<br />
Long service leave 10,125 14,988<br />
Superannuation – contribution scheme 43,631 38,962<br />
Superannuation – defined benefit scheme 29,050 32,117<br />
Other employee expenses 387 370<br />
Total 719,846 706,635<br />
Superannuation expenses relating to defined benefits schemes relate to payments into the Consolidated Fund.<br />
The amount of the payment is based on an employer contribution rate determined by the Treasurer, on the advice of<br />
the State Actuary. The current employer contribution is 12.5% of salary.<br />
Superannuation expenses relating to defined contribution schemes are paid directly to superannuation funds at a rate of<br />
9% of salary. In addition, departments are also required to pay into the Consolidated Fund a ‘gap’ payment equivalent to<br />
3.5% of salary in respect of employees who are members of contribution schemes.<br />
8.2<br />
Depreciation<br />
Depreciation<br />
2013<br />
$’000<br />
2012<br />
$’000<br />
Plant and equipment 2,055 1,991<br />
Buildings 46,784 44,810<br />
Library book stock 2,683 2,653<br />
Intangibles 757 –<br />
Total 52,279 49,454<br />
8.3<br />
Supplies and<br />
consumables<br />
2013<br />
$’000<br />
2012<br />
$’000<br />
Audit fees – financial audit 215 86<br />
Consultants 3,644 3,463<br />
Property services 44,604 39,313<br />
Maintenance 34,883 33,511<br />
Communications 2,443 3,288<br />
Information technology 27,735 32,173<br />
Travel and transport 8,233 6,776<br />
Advertising and promotion 967 982<br />
Materials and supplies 25,196 33,283<br />
Miscellaneous school expenses 15,931 28,370<br />
Books and periodicals 2,942 2,368<br />
Equipment leases 1,777 1,501<br />
Postage and freight 1,423 1,565<br />
Training and development 3,819 3,489<br />
Contractors 3,856 3,118<br />
Copyright fees 2,800 2,272<br />
Other supplies and consumables 8,354 12,013<br />
Total 188,822 207,571<br />
128 Financial Statements » Notes
8.4<br />
Grants and<br />
subsidies<br />
2013<br />
$’000<br />
2012<br />
$’000<br />
Apprentice and trainee subsidies 1,889 1,468<br />
Child care 1,112 1,034<br />
Group training and ITAB state funding – 39<br />
Sundry grants, fees and scholarships 1,334 1,282<br />
VET delivery 40,553 37,671<br />
Accommodation allowance for tertiary students 354 694<br />
Tasmanian communities online 434 480<br />
Non-government schools 4,456 1,266<br />
Senior secondary accommodation allowance 406 405<br />
Spectacles and special bursaries 200 263<br />
Other grant payments 8,444 21<br />
Total 59,182 44,623<br />
8.5<br />
Other<br />
expenses<br />
2013<br />
$’000<br />
2012<br />
$’000<br />
Salary on-costs 1 25,275 41,812<br />
Total 25,275 41,812<br />
1. The department was no longer required to pay payroll tax on employee benefits from 1 October 2012, this is reflected in decreased costs above.<br />
Note 9: Other economic flows included in net result<br />
9.1<br />
Net gain/<br />
(loss) on<br />
non-financial<br />
assets<br />
2013<br />
$’000<br />
2012<br />
$’000<br />
Net gain/(loss) on disposal of physical assets 1,023 (3,777)<br />
Total net gain/(loss) on non-financial assets 1,023 (3,777)<br />
9.2<br />
Net gain/<br />
(loss) on<br />
financial<br />
instruments<br />
and statutory<br />
receivables/<br />
payables<br />
Impairment of:<br />
2013<br />
$’000<br />
2012<br />
$’000<br />
Loans and receivables (83) (360)<br />
Total net loss on financial instruments (83) (360)<br />
9.3<br />
Net gain/<br />
(loss) on<br />
transitional<br />
data<br />
arrangements<br />
2013<br />
$’000<br />
2012<br />
$’000<br />
Understated revenue as a result of school finance system data transfers – (14,346)<br />
Total net loss on financial instruments – (14,346)<br />
As a result of schools transitioning to a common Schools Administration System during the 2011–12 financial year,<br />
errors in historical data, particularly receivables and cash which had been overstated in previous years, were identified.<br />
This resulted in reducing the amounts of receivables and cash holdings during the transition. The effect is that operating<br />
revenue may have been overstated in prior years and, whilst the department does not consider these errors material,<br />
it has elected to record the correction as an impairment loss outside of continuing operations during that year.<br />
Financial Statements » Notes<br />
129
Note 10: Assets<br />
10.1<br />
Receivables<br />
2013<br />
$’000<br />
2012<br />
$’000<br />
Central office receivables 12,846 8,701<br />
LINC receivables 839 733<br />
Less: Provision for impairment (655) (572)<br />
Total 13,030 8,862<br />
School receivables 4,352 3,415<br />
Less: Provision for impairment (245) (230)<br />
Total 4,107 3,185<br />
Total receivables 17,137 12,047<br />
Comprising<br />
Sale of goods and services (inclusive of GST) 15,407 9,038<br />
Tax assets 1,730 3,009<br />
Total 17,137 12,047<br />
Settled within 12 months 17,137 12,047<br />
Total 17,137 12,047<br />
Reconciliation of movement in provisions for impairment of receivables<br />
2013<br />
$’000<br />
2012<br />
$’000<br />
Carrying amount at 1 July 802 539<br />
Amounts written off during the year (340) –<br />
Increase/(decrease) in provision recognised in profit or loss 438 263<br />
Carrying amount at 30 June 900 802<br />
10.2<br />
Assets held<br />
for sale<br />
2013<br />
$’000<br />
2012<br />
$’000<br />
Land and buildings 11,206 11,427<br />
Total 11,206 11,427<br />
Settled within 12 months 11,206 11,427<br />
Total 11,206 11,427<br />
The assets held for sale consists of land and some buildings which have become surplus to the department’s<br />
requirements. It is intended that these be disposed – either by way of sale or through appropriate property swaps.<br />
Steps have been taken for this purpose and it is likely that the disposals could occur within the next 12 months.<br />
130 Financial Statements » Notes
10.3<br />
Property,<br />
plant and<br />
equipment<br />
(a) Carrying amount 2013<br />
$’000<br />
Land<br />
2012<br />
$’000<br />
At fair value 379,831 371,990<br />
Total land 379,831 371,990<br />
Buildings<br />
At fair value 1,252,736 1,216,133<br />
Less: Accumulated depreciation – –<br />
1,252,736 1,216,133<br />
Works in progress (at cost) 3,949 14,863<br />
Total buildings 1,256,685 1,230,996<br />
Plant and equipment<br />
At cost 34,474 34,012<br />
Less: Accumulated depreciation (25,920) (24,498)<br />
Total plant and equipment 8,554 9,514<br />
Total property, plant and equipment 1,645,070 1,612,500<br />
(b) Reconciliation of movements<br />
Reconciliations of the carrying amounts of each class of property, plant and equipment, library book stock and heritage<br />
at the beginning and end of the current and previous financial year are set out below. Carrying value means the net<br />
amount after deducting accumulated depreciation and accumulated impairment losses.<br />
2013<br />
Land<br />
$’000<br />
Buildings<br />
$’000<br />
Work in<br />
progress<br />
$’000<br />
Plant and<br />
equipment<br />
$’000<br />
Total<br />
$’000<br />
Carrying value at 1 July 371,990 1,216,133 14,863 9,514 1,612,500<br />
Additions 69 318 19,218 1,218 20,823<br />
Disposals (1,883) (1,296) – (123) (3,302)<br />
Revaluation increments 9,254 54,634 – – 63,888<br />
Depreciation expense – (46,784) – (2,055) (48,839)<br />
Capitalised works to assets 401 29,731 (30,132) – –<br />
Carrying value as at 30 June 379,831 1,252,736 3,949 8,554 1,645,070<br />
2012<br />
Land<br />
$’000<br />
Buildings<br />
$’000<br />
Work in<br />
progress<br />
$’000<br />
Plant and<br />
equipment<br />
$’000<br />
Total<br />
$’000<br />
Carrying value at 1 July 368,624 924,773 228,810 9,301 1,531,508<br />
Additions – – 62,597 2,274 64,871<br />
Disposals (317) (233) – (71) (621)<br />
Revaluation increments 3,683 59,860 – – 63,543<br />
Depreciation expense – (44,811) – (1,990) (46,801)<br />
Capitalised works to assets – 276,544 (276,544) – –<br />
Carrying value as at 30 June 371,990 1,216,133 14,863 9,514 1,612,500<br />
(c) Valuation of land and building assets at fair value<br />
The department values its land and building asset classes at fair value. To determine fair value of these asset classes<br />
at 30 June 2010, the department engaged an independent valuer during 2009–10. The valuation of the assets was<br />
undertaken by Liquid Pacific Holdings Pty Ltd, effective 30 June 2010.<br />
An inflation factor is applied each year in between the last formal valuation to determine fair value each year. For 2012–13,<br />
this inflation factor was 2.5% for land and 1.29% for buildings.<br />
Financial Statements » Notes<br />
131
10.4<br />
Library book<br />
stock<br />
(a) Carrying amount 2013<br />
$’000<br />
2012<br />
$’000<br />
At cost 32,075 32,036<br />
Less: Accumulated depreciation (16,980) (15,246)<br />
Total library book stock 15,095 16,790<br />
(b) Reconciliation of movements 2013<br />
$’000<br />
2012<br />
$’000<br />
Carrying value at 1 July 16,790 18,490<br />
Additions 1,947 2,013<br />
Disposals (959) (1,060)<br />
Depreciation (2,683) (2,653)<br />
Carrying value at 30 June 15,095 16,790<br />
10.5<br />
Heritage<br />
collections<br />
(a) Carrying amount 2013<br />
$’000<br />
2012<br />
$’000<br />
At fair value 64,153 63,343<br />
Total heritage 64,153 63,343<br />
(b) Reconciliation of movements 2013<br />
$’000<br />
2012<br />
$’000<br />
Carrying value at 1 July 63,343 60,337<br />
Additions 56 –<br />
Revaluation increments 754 3,006<br />
Carrying value at 30 June 64,153 63,343<br />
The department holds a number of heritage assets. A significant component of these assets relate to the Allport<br />
Library and Museum of Fine Arts and the Crowther Library. The Allport library, donated by the late Henry Allport,<br />
comprises books, pamphlets, prints, historical maps and charts relating to Australia and the Pacific including art works<br />
by convict and colonial landscape artists. The Crowther Library is a collection of books, pamphlets, maps, manuscripts,<br />
photographs, works of art and museum objects such as medical instruments and scrimshaw. It was formed during the<br />
lifetime of Sir William Crowther and presented by him to the State Library of Tasmania over a period from 1964 until<br />
his death in 1981.<br />
These items are not depreciated as they do not have limited useful lives as appropriate curatorial policies are in place.<br />
An inflation factor is applied each year in between the last formal valuation to determine fair value each year.<br />
For 2012–13, this inflation factor was 1.0% for heritage assets.<br />
10.6<br />
Intangibles<br />
(a) Carrying amount 2013<br />
$’000<br />
2012<br />
$’000<br />
Software at cost 3,029 –<br />
Less: Accumulated depreciation (758) –<br />
2,271 –<br />
Work in progress – 3,029<br />
Total intangibles 2,271 3,029<br />
(b) Reconciliation of movements 2013<br />
$’000<br />
2012<br />
$’000<br />
Carrying value at 1 July 3,029 2,865<br />
Additions – 164<br />
Amortisation (758) –<br />
Carrying value at 30 June 2,271 3,029<br />
132 Financial Statements » Notes
10.7<br />
Other assets<br />
(a) Carrying amount 2013<br />
$’000<br />
Other current assets<br />
2012<br />
$’000<br />
Prepayments 2,339 1,411<br />
Accrued revenue 441 407<br />
Total 2,780 1,818<br />
Settled within 12 months 2,780 1,818<br />
Total 2,780 1,818<br />
Note 11: Liabilities<br />
11.1<br />
Payables<br />
2013<br />
$’000<br />
2012<br />
$’000<br />
Creditors 3,324 10,512<br />
Accrued expenses 4,762 1,466<br />
Total 8,086 11,978<br />
Settled within 12 months 8,086 11,978<br />
Total 8,086 11,978<br />
Settlement is usually made within 30 days.<br />
11.2<br />
Employee<br />
benefits<br />
2013<br />
$’000<br />
2012<br />
$’000<br />
Accrued salaries 20,278 19,157<br />
Annual leave 13,789 13,801<br />
Long service leave 115,894 120,880<br />
State Service Accumulated Leave Scheme 583 411<br />
Total 150,544 154,249<br />
Settled within 12 months 51,480 48,838<br />
Settled in more than 12 months 99,064 105,411<br />
Total 150,544 154,249<br />
11.3<br />
Other<br />
liabilities<br />
Revenue received in advance<br />
Appropriation carried forward from current and previous years<br />
under section 8A(2) of the Public Account Act 1986<br />
2013<br />
$’000<br />
2012<br />
$’000<br />
3,139 13,227<br />
Other revenue received in advance 1,628 1,879<br />
Other liabilities 79 368<br />
Total 4,846 15,474<br />
Settled within 12 months 4,471 15,474<br />
Settled in more than 12 months 375 –<br />
Total 4,846 15,474<br />
The department was no longer required to pay payroll tax on employee benefits from 1 October 2012. As such, the<br />
department does not make any provision for this on-cost to leave entitlements in 2013 as referred to in note 2.22.<br />
Financial Statements » Notes<br />
133
Note 12: Commitments and contingencies<br />
12.1<br />
Schedule of<br />
commitments<br />
Schedule of commitments<br />
By type<br />
Capital commitments<br />
2013<br />
$’000<br />
2012<br />
$’000<br />
Buildings 2,109 13,463<br />
Total capital commitments 2,109 13,463<br />
Lease commitments<br />
Operating leases 12,340 9,955<br />
Total lease commitments 12,340 9,955<br />
By maturity<br />
Capital commitments<br />
One year or less 2,109 13,463<br />
From one to five years – –<br />
Total capital commitments 2,109 13,463<br />
Operating lease commitments<br />
One year or less 4,994 4,147<br />
From one to five years 7,346 5,808<br />
Over five years – –<br />
Total operating lease commitments 12,340 9,955<br />
Total 14,449 23,418<br />
Note: Commitments are GST inclusive where relevant.<br />
Capital commitments generally relate to the outstanding contractual amounts on building works but may be subject to<br />
contract variations.<br />
The department leases buildings, plant and equipment and fleet under operating leases expiring from one to ten<br />
years. Leases generally provide the department with a right of renewal at which time all terms are renegotiated. Lease<br />
payments comprise a base amount plus an incremental contingent rental. Contingent rentals are based on either<br />
movements in the Consumer Price Index or operating criteria.<br />
12.2<br />
Contingent<br />
assets and<br />
liabilities<br />
Contingent assets and liabilities are not recognised in the Statement of Financial Position due to uncertainty regarding<br />
the amount or timing of the underlying claim or obligation.<br />
(a) Unquantifiable contingencies<br />
At 30 June 2013 the department had a number of legal claims against it, generally relating to personal injury arising from<br />
accidents on departmental premises. The Crown Solicitor has advised the department that the estimated personal<br />
injury liability to be $1.725m for 2012–13 ($1.340m for 2011–12).<br />
The department has a number of leases on property it occupies. Some of these leases contain a ‘make good provision’.<br />
A liability for these provisions has not been recognised in the Statement of Financial Position as the department<br />
considers a value of these provisions cannot be reliably measured due to a variety of factors. The majority of leases<br />
cover a five to ten year period and are generally renewed, hence deferring any make good liability.<br />
134 Financial Statements » Notes
Note 13: Reserves<br />
13.1<br />
Reserves<br />
2013<br />
Asset revaluation reserve<br />
Land<br />
$’000<br />
Buildings<br />
$’000<br />
Heritage<br />
$’000<br />
Total<br />
$’000<br />
Balance at the beginning of financial year 120,047 178,690 22,009 320,745<br />
Revaluation increments (decrements) 9,254 54,634 753 64,642<br />
Balance at end of financial year 129,301 233,324 22,762 385,387<br />
2012<br />
Asset revaluation reserve<br />
Land<br />
$’000<br />
Buildings<br />
$’000<br />
Heritage<br />
$’000<br />
Total<br />
$’000<br />
Balance at the beginning of financial year 116,364 118,830 19,003 254,197<br />
Revaluation increments (decrements) 3,683 59,860 3,006 66,548<br />
Balance at end of financial year 120,047 178,690 22,009 320,745<br />
(a) Nature and purpose of reserves<br />
Physical asset revaluation reserve<br />
The asset revaluation reserve is used to record increments and decrements on the revaluation of non-current assets, as<br />
described in accounting policy note 2.13(d).<br />
13.2<br />
Administrative<br />
restructuring<br />
No administrative restructuring has occurred during the 2012–13 financial year.<br />
Note 14: Cash flow reconciliation<br />
14.1<br />
Cash and<br />
deposits<br />
Cash and deposits includes the balance of the Special Deposits and Trust Fund held by the department, and other cash<br />
held, excluding those accounts which are administered or held in a trustee capacity or agency arrangement.<br />
Special Deposits and Trust Fund balance<br />
2013<br />
$’000<br />
2012<br />
$’000<br />
T511 – Department of <strong>Education</strong> operating account 14,082 30,305<br />
T521 – Department of <strong>Education</strong> school banking account 38,296 34,803<br />
T648 – State Library Service (overdue fines) account – 148<br />
Total 52,378 65,256<br />
Other cash held<br />
Post-Year 10 cash receipting account 760 927<br />
Other bank accounts 310 255<br />
Cash floats 122 115<br />
Total 1,192 1,297<br />
Total cash and deposits 53,570 66,553<br />
2013<br />
$’000<br />
2012<br />
$’000<br />
Cash and deposits (as per Statement of Financial Position) 53,570 66,553<br />
Total cash and cash equivalents 53,570 66,553<br />
The definition of cash can be found at Note 2.13(a).<br />
Included in the Department of <strong>Education</strong> operating account is an amount of $3.139m, which is an approved carryforward<br />
under section 8A(2) of the Public Account Act 1986.<br />
Financial Statements » Notes<br />
135
14.2<br />
Reconciliation<br />
of net result<br />
to net<br />
cash from<br />
operating<br />
activities<br />
2013<br />
$’000<br />
2012<br />
$’000<br />
Net result (19,639) 19,209<br />
Revenue from government – works and services (12,161) (61,384)<br />
Revenue from government – other – (1,162)<br />
Depreciation and amortisation 52,279 49,454<br />
Gain/(Loss) from sale of non-financial assets 1,023 (3,777)<br />
Contributions received (12,722) (111)<br />
Movement in assets as a result of transitional data arrangements 14,346 6,103<br />
Impairment losses 83 360<br />
Decrease/(increase) in receivables (5,090) 2,237<br />
Decrease/(increase) in other assets (961) 320<br />
Increase/(decrease) in employee benefits (3,705) (5,646)<br />
Increase/(decrease) in payables (3,892) 252<br />
Increase/(decrease) in other liabilities (10,629) 4,726<br />
Net cash from operating activities (1,068) 10,581<br />
136 Financial Statements » Notes
14.3<br />
Acquittal<br />
of capital<br />
investment<br />
and special<br />
capital<br />
investment<br />
funds<br />
The department received works and services appropriation funding to fund specific projects.<br />
Not all projects listed below are capitalised as they may not meet the department’s capitalisation threshold of $150,000<br />
or have been deemed maintenance projects and are expensed through the Statement of Comprehensive Income.<br />
Cash outflows relating to these projects are listed below by category.<br />
Budget information refers to original estimates for the department and has not been subject to audit.<br />
(a) Project expenditure<br />
Capital Investment Program<br />
New projects<br />
2013<br />
Budget<br />
$’000<br />
2013<br />
Actual<br />
$’000<br />
2012<br />
Actual<br />
$’000<br />
School Transition Fund 1,200 600 –<br />
Burnie Child and Family Centre – – 907<br />
Risdon Cove Child and Family Centre – – 961<br />
Continuing projects<br />
Renewing Our <strong>Education</strong> System 1,165 – –<br />
Campbell Town Child Care Centre 800 570 380<br />
Burnie High School – – 3,028<br />
Port Sorell Primary School 4,500 7,500 5,154<br />
Albuera Street Primary School – – 572<br />
King Island District High School – – 68<br />
St Leonards Primary School – – 212<br />
Sheffield District High School – – 99<br />
Child and Family Centre – Bridgewater 3,399 2,965 2,675<br />
Community Knowledge Network – Learning and<br />
Information Network Centres (LINCs)<br />
6,350 3,257 1,500<br />
Establish a new Learning and Information Network Centre (LINC) 500 – 3,129<br />
Local Schools Working Together 500 492 1,475<br />
School amalgamations Burnie – – 396<br />
Bridgewater and Southern Midlands <strong>Education</strong>al Renewal Project – – 6,936<br />
Child and family centres 10,000 3,491 11,709<br />
Tasmania Tomorrow 1,000 1,000 1,400<br />
Tasmania Tomorrow – Infrastructure support 850 850 850<br />
Taroona High School – – 177<br />
Trade Training Centres 7,133 3,849 10,767<br />
Building the <strong>Education</strong> Revolution<br />
Administrative support – – 855<br />
Primary schools – – 16,302<br />
Science and language centres – – 1,871<br />
Total 37,397 24,574 71,423<br />
Financial Statements » Notes<br />
137
(b) Classification of cash flows<br />
The project expenditure above is reflected in the Statement of Cash Flows as follows<br />
Cash outflows<br />
Other cash payments<br />
2013<br />
$’000<br />
2012<br />
$’000<br />
Wages and salaries 653 890<br />
Long service leave 4 11<br />
Superannuation 67 54<br />
Other employee expenses 20 43<br />
Buildings and infrastructure works and services 22,815 66,480<br />
Information technology 2 74<br />
Advertising and promotion 2 –<br />
Supplies and consumables 87 145<br />
Consultants 874 3,667<br />
Travel and transport 48 47<br />
Communications 2 12<br />
Total cash outflows 24,574 71,423<br />
Note 15: Financial instruments<br />
15.1<br />
Risk<br />
exposures<br />
(a) Risk management policies<br />
The department has exposure to the following risks from its use of financial instruments:<br />
• credit risk<br />
• liquidity risk<br />
• market risk.<br />
The Head of Agency has overall responsibility for the establishment and oversight of the department’s risk management<br />
framework. Risk management policies are established to identify and analyse risks faced by the department, to set<br />
appropriate risk limits and controls, and to monitor risks and adherence to limits.<br />
(b) Credit risk exposures<br />
Credit risk is risk of financial loss to the department if a customer or counterparty to a financial instrument fails to meet<br />
its contractual obligations.<br />
The credit risk in relation to cash is deemed to be low as counterparty failure is managed by dealing with financially<br />
sound and reputable banks. The carrying amount of financial assets recorded in the financial statements, net of any<br />
allowances for losses, represents the department’s maximum exposure to credit risk. The department is not exposed to<br />
concentration of credit risk of any significance.<br />
The department does not hold any collateral or other security against any financial assets.<br />
Standard debtor terms are 30 days net. The department has established an allowance for impaired losses that are<br />
re-assessed each year. Bad debts written-off during the year are used to determine estimated impairment. Before any<br />
write-off, debtors are sent reminder notices and their debt may be forwarded onto a collection agency. Individual<br />
debtors tend to be small in nature with no significant credit risk exposure to any individual debtor. The collection of the<br />
amounts disclosed below is considered more likely than not therefore the amounts have not been impaired.<br />
The following tables analyse financial assets that are due but not impaired:<br />
Analysis of non-impaired<br />
financial assets at 30 June 2013<br />
Not past<br />
due<br />
$'000<br />
Past due<br />
30–59 days<br />
$'000<br />
Past due<br />
60–89 days<br />
$'000<br />
Past due 90<br />
days greater<br />
$'000<br />
Total<br />
$'000<br />
Receivables 10,877 1,007 458 4,795 17,137<br />
Analysis of non-impaired<br />
financial assets at<br />
30 June 2012<br />
Not past<br />
due<br />
$'000<br />
Past due<br />
30–59 days<br />
$'000<br />
Past due<br />
60–89 days<br />
$'000<br />
Past due 90<br />
days greater<br />
$'000<br />
Total<br />
$'000<br />
Receivables 8,271 1,391 631 1,754 12,047<br />
138 Financial Statements » Notes
(c) Liquidity risk<br />
Liquidity risk is the risk that the department will not be able to meet its financial obligations as they fall due.<br />
The department’s approach to managing liquidity is to ensure that it will always have sufficient liquidity to meet<br />
its liabilities when they fall due by regularly reviewing budgeted cash outflows to ensure that there is sufficient cash<br />
to meet all obligations.<br />
The following tables detail the undiscounted cash flows payable by the department by remaining contractual maturity<br />
for its financial liabilities. It should be noted that as these are undiscounted, totals may not reconcile to the carrying<br />
amounts presented in the Statement of Financial Position.<br />
2013<br />
Maturity analysis for financial liabilities<br />
Financial liabilities<br />
1 year<br />
$'000<br />
2 years<br />
$'000<br />
3 years<br />
$'000<br />
4 years<br />
$'000<br />
5 years<br />
$'000<br />
More than<br />
5 years<br />
$'000<br />
Undiscounted<br />
total<br />
$'000<br />
Carrying<br />
amount<br />
$'000<br />
Payables 8,086 – – – – – 8,086 8,086<br />
Other financial liabilities 4,458 – – – – – 4,458 4,458<br />
Total 12,544 – – – – – 12,544 12,544<br />
2012<br />
Maturity analysis for financial liabilities<br />
Financial liabilities<br />
1 year<br />
$'000<br />
2 years<br />
$'000<br />
3 years<br />
$'000<br />
4 years<br />
$'000<br />
5 years<br />
$'000<br />
More than<br />
5 years<br />
$'000<br />
Undiscounted<br />
total<br />
$'000<br />
Carrying<br />
amount<br />
$'000<br />
Payables 11,978 – – – – – 11,978 11,978<br />
Other financial liabilities 15,106 – – – – – 15,106 15,106<br />
Total 27,084 – – – – – 27,084 27,084<br />
(d) Market risk<br />
Market risk is the risk that the fair value of future cash flows of a financial instrument will fluctuate because of changes in<br />
market prices. The primary market risk that the department is exposed to is interest rate risk.<br />
The department currently has the majority of its financial assets in variable interest rates to take advantage of interest<br />
rate rises.<br />
Variable rate instruments<br />
2013<br />
$’000<br />
2012<br />
$’000<br />
Financial assets 38,451 35,730<br />
Total 38,451 35,730<br />
The department does not hold any financial instruments available for sale which would directly affect equity as a result<br />
of changes in interest rates. Changes in variable rates of 100 basis points at reporting date would have the following<br />
effect on the department’s profit or loss.<br />
Statement of Comprehensive Income<br />
Equity<br />
30 June 2013<br />
100 basis points<br />
increase<br />
$'000<br />
100 basis points<br />
decrease<br />
$'000<br />
100 basis points<br />
Increase<br />
$'000<br />
100 basis points<br />
decrease<br />
$'000<br />
Financial assets 418 (418) 418 (418)<br />
Net sensitivity 418 (418) 418 (418)<br />
30 June 2012<br />
Financial assets 449 (449) 449 (449)<br />
Net sensitivity 449 (449) 449 (449)<br />
This analysis assumes all other variables remain constant. The analysis was performed on the same basis as 2012.<br />
Financial Statements » Notes<br />
139
15.2<br />
Categories<br />
of financial<br />
assets and<br />
liabilities<br />
Financial assets<br />
2013<br />
$’000<br />
2012<br />
$’000<br />
Cash and cash equivalents 53,570 66,553<br />
Loans and receivables 17,137 12,047<br />
Total 70,707 78,600<br />
Financial liabilities<br />
Financial liabilities at amortised cost 12,544 27,084<br />
Total 12,544 27,084<br />
15.3<br />
Reclassifications<br />
of financial<br />
assets<br />
The department has made no reclassifications of any financial assets held for the financial year.<br />
15.4<br />
Derecognition<br />
of financial<br />
assets<br />
The department has not derecognised any financial assets during the financial year.<br />
15.5<br />
Comparison<br />
between<br />
carrying<br />
amount and<br />
net fair value<br />
of financial<br />
assets and<br />
liabilities<br />
Financial assets<br />
Carrying<br />
amount<br />
2013<br />
$'000<br />
Net fair<br />
value<br />
2013<br />
$'000<br />
Carrying<br />
amount<br />
2012<br />
$'000<br />
Net fair<br />
value<br />
2012<br />
$'000<br />
Cash and cash equivalents 53,570 53,570 66,553 66,553<br />
Receivables 17,137 17,137 12,047 12,047<br />
Total financial assets 70,707 70,707 78,600 78,600<br />
Financial liabilities<br />
Payables 8,086 8,086 11,978 11,978<br />
Other – revenue received in advance 4,458 4,458 15,106 15,106<br />
Total financial liabilities 12,544 12,544 27,084 27,084<br />
Note 16: Details of consolidated entities<br />
16.1<br />
List of<br />
entities<br />
The following entities have been consolidated by the department:<br />
• Schools Registration Board<br />
• Skills Tasmania 1<br />
• Tasmanian Qualifications Authority 2<br />
• Teachers Registration Board 2<br />
Although the above are separate reporting entities for administrative purposes they operate as part of the department.<br />
1. Skills Tasmania is not required to prepare financial statements. Also see note 5.<br />
2. For further breakdown of these organisations’ financial activities refer to each entities financial statements.<br />
140 Financial Statements » Notes
16.2<br />
Statement of<br />
payments for<br />
the Schools<br />
Registration<br />
Board<br />
2013<br />
$’000<br />
2012<br />
$’000<br />
Salaries 57 57<br />
Travel 8 8<br />
Meetings 23 12<br />
Miscellaneous 5 18<br />
Total expenditure 93 95<br />
Note 17: Notes to administered statements<br />
17.1<br />
Explanations<br />
of material<br />
variances<br />
between<br />
budget<br />
and actual<br />
outcomes<br />
The following are brief explanations of material variances between budget estimates and actual outcomes for 2012–13.<br />
Variances are considered material where the variance exceeds the greater of 10% of budget estimate and $1,500,000.<br />
Note<br />
Budget<br />
$’000<br />
Actual<br />
$’000<br />
Variance<br />
$’000<br />
Variance<br />
%<br />
Grants and subsidies 1 569 2,703 2,134 375<br />
Notes to administered revenue and expense variances<br />
The variance is the result of Australian Government National Partnership funding received for non-government schools<br />
which the department was not aware of at the time of the budget development.<br />
17.2<br />
Administered<br />
revenue from<br />
government<br />
Administered revenue from government includes revenue from appropriations, appropriations carried forward under<br />
section 8A(2) of the Public Account Act 1986 and items Reserved by Law.<br />
Budget information refers to original estimates for the department and has not been subject to audit.<br />
Continuing operations<br />
Appropriation revenue – recurrent<br />
2013<br />
Budget<br />
$’000<br />
2013<br />
Actual<br />
$’000<br />
2012<br />
Actual<br />
$’000<br />
Current year 236,694 233,524 231,895<br />
Total administered revenue from government 236,694 233,524 231,895<br />
17.3<br />
Administered<br />
grants<br />
General grants<br />
2013<br />
$’000<br />
2012<br />
$’000<br />
National Partnership Funding 2,703 –<br />
Australian Government: Recurrent receipts (schools) – 50<br />
Australian Government: Recurrent receipts (TAFE) – 611<br />
Subtotal general grants 2,703 661<br />
Total 2,703 661<br />
17.4<br />
Administered<br />
sales of goods<br />
and services<br />
2013<br />
$’000<br />
2012<br />
$’000<br />
Archives services 12 16<br />
Curriculum services 90 94<br />
State Library services 42 42<br />
Other 11 1<br />
Total 155 153<br />
Financial Statements » Notes<br />
141
17.5<br />
Administered<br />
fees and fines<br />
2013<br />
$’000<br />
2012<br />
$’000<br />
Group assurance commission 12 24<br />
Total 12 24<br />
17.6<br />
Administered<br />
other revenue<br />
2013<br />
$’000<br />
2012<br />
$’000<br />
Other revenue from ordinary activities 9 5<br />
Total 9 5<br />
17.7<br />
Administered<br />
grants and<br />
subsidies<br />
expenses<br />
2013<br />
$’000<br />
2012<br />
$’000<br />
Non-government schools: Grants by Australian Government 177,458 177,726<br />
Non-government schools: Grants by state government 57,334 52,692<br />
Non-government schools: Capital assistance 1,141 1,141<br />
Non-government schools: Student assistance 299 318<br />
Total 236,232 231,877<br />
17.8<br />
Administered<br />
receivables<br />
2013<br />
$’000<br />
2012<br />
$’000<br />
Central office receivables – –<br />
Total – –<br />
Settled within 12 months – –<br />
Total – –<br />
17.9<br />
Administered<br />
cash and<br />
deposits<br />
Administered cash and deposits include the balance of the special deposits and trust fund accounts held by the<br />
department, and other cash held, which are administered or held in a trustee capacity or agency arrangement.<br />
Special Deposits and Trust Fund balance<br />
2013<br />
$’000<br />
2012<br />
$’000<br />
T511 – Department of <strong>Education</strong> Operating Account – –<br />
Total – –<br />
17.10<br />
Reconciliation<br />
of<br />
administered<br />
net result to<br />
net cash from<br />
administered<br />
operating<br />
activities<br />
2013<br />
$’000<br />
2012<br />
$’000<br />
Net result – (3)<br />
(Increase)/decrease in receivables – 3<br />
Net cash from (used by) operating activities – –<br />
142 Financial Statements » Notes
17.11<br />
Financial<br />
instruments<br />
(administered)<br />
(a) Risk management policies<br />
The department has exposure to the following risks from its use of financial instruments:<br />
• credit risk<br />
• liquidity risk<br />
• market risk.<br />
The Head of Agency has overall responsibility for the establishment and oversight of the department’s risk management<br />
framework. Risk management policies are established to identify and analyse risks faced by the department, to set<br />
appropriate risk limits and controls, and to monitor risks and adherence to limits.<br />
(b) Credit risk exposures<br />
Credit risk is risk of financial loss to the department if a customer or counterparty to a financial instrument fails to meet<br />
its contractual obligations.<br />
The credit risk in relation to cash is deemed to be low as counterparty failure is managed by dealing with financially<br />
sound and reputable banks. The carrying amount of financial assets recorded in the financial statements, net of any<br />
allowances for losses, represents the department’s maximum exposure to credit risk. The department is not exposed<br />
to concentration of credit risk of any significance.<br />
The department does not hold any collateral or other security against any financial assets.<br />
Standard debtor terms are 30 days net. Collectability of receivables is reviewed at balance date and provision for<br />
impairment is raised when collection of a debt is judged to be doubtful. There were no administered financial assets<br />
that for the years ended 30 June 2012 or 30 June 2013.<br />
(c) Liquidity risk<br />
Liquidity risk is the risk that the department will not be able to meet its financial obligations as they fall due.<br />
The department’s approach to managing liquidity is to ensure that it will always have sufficient liquidity to meet its<br />
liabilities when they fall due.<br />
As at 30 June 2013, the department had no administered financial liabilities.<br />
(d) Market risk<br />
Market risk is the risk that the fair value of future cash flows of a financial instrument will fluctuate because of changes<br />
in market prices. The primary market risk that the department is exposed to is interest rate risk.<br />
As at 30 June 2013, there is no interest rate exposure on administered activities, as all financial instruments were<br />
non-interest bearing.<br />
17.12<br />
Categories of<br />
administered<br />
financial<br />
assets and<br />
liabilities<br />
Administered financial assets<br />
2013<br />
$’000<br />
2012<br />
$’000<br />
Cash and cash equivalents – –<br />
Loans and receivables – –<br />
Total – –<br />
17.13<br />
Comparison<br />
between<br />
carrying<br />
amount and<br />
net fair value<br />
of financial<br />
assets and<br />
liabilities<br />
Administered financial assets<br />
Carrying<br />
Amount<br />
2013<br />
$'000<br />
Net fair<br />
Value<br />
2013<br />
$'000<br />
Carrying<br />
Amount<br />
2012<br />
$'000<br />
Net fair<br />
Value<br />
2012<br />
$'000<br />
Receivables – – – –<br />
Total financial assets – – – –<br />
Financial liabilities<br />
Total financial liabilities – – – –<br />
Financial Statements » Notes<br />
143
Note 18: Transactions and balances relating to a trustee<br />
or agency arrangement<br />
Account name<br />
Opening<br />
balance<br />
1 July 2012<br />
$'000<br />
Net<br />
transactions<br />
during 2012–13<br />
$'000<br />
Closing<br />
balance<br />
30 June 2013<br />
$'000<br />
Critchley Parker Junior Student Loan Fund 19 1 20<br />
Sir John Morris Memorial Fund 1,088 35 1,123<br />
TM Crisp Memorial Sporting Library 17 1 18<br />
Kula Bequest 100 3 103<br />
The department acts under a trustee arrangement in the administration of certain library and student funds.<br />
These funds are neither administered nor controlled. Accordingly they are not recognised in the financial statements.<br />
However, disclosure is made in aggregate the amount collected and distributed to external parties during the reporting<br />
period and any amount undistributed at 30 June 2013.<br />
Statement of Certification<br />
144 Financial Statements » Notes and Statement of Certification
Auditor-General's Report<br />
Financial Statements » Auditor-General's Report<br />
145
146 Financial Statements » Auditor-General's Report
Appendices
Additional Performance Measures<br />
Class sizes (average number of students) 1 2011 2012 2013<br />
Kindergartens:<br />
Kindergarten-only classes 19.2 19.3 19.5<br />
Kindergarten in combined classes 20.0 21.1 20.5<br />
Primary schools:<br />
Prep 21.4 21.7 21.7<br />
Year 1 22.5 23.0 23.1<br />
Year 2 22.9 23.3 23.5<br />
Year 3 23.1 23.8 23.8<br />
Year 4 23.3 23.9 23.7<br />
Year 5 23.8 24.6 24.1<br />
Year 6 23.8 24.3 24.1<br />
Prep – Year 6 overall 23.0 23.2 23.4<br />
Secondary schools by school type: 2<br />
Secondary 23.8 23.9 23.9<br />
Combined 19.6 21.4 21.3<br />
All secondary 22.7 23.4 23.4<br />
1. This data is derived from first term census data.<br />
2. As secondary school students are not organised into single classes which exclusively undertake a complete education program, the department has<br />
adopted English class size as a proxy measure where the roll class is not suitable.<br />
Student attendance<br />
2010 2011 2012<br />
Average daily attendance rate 1 (proportion of students present) 91.3% 90.5% 90.2%<br />
1. Data pertains to students in Prep to Year 10. Data is not reported for students in senior secondary schools, Ashley School or the Tasmanian eSchool.<br />
The calculated rates and proportions are based on FTE enrolments from the August Census.<br />
School opinion surveys<br />
School satisfaction data was not collected by the Department of <strong>Education</strong> in 2012. Parent and student survey data will<br />
be replaced by the parent opinion and student opinion survey collections to be conducted by Australian Curriculum,<br />
Assessment and Reporting Authority (ACARA) during 2013. ACARA will trial staff opinion surveys during 2013.<br />
Students with disabilities<br />
Students attending early childhood intervention service centres: 1<br />
2011 2012 2013<br />
Number 582 599 557<br />
Full-time equivalents 197.1 206.5 192.7<br />
Students with the highest support needs (Register for Students with Severe<br />
Disabilities) in special schools:<br />
Number 210 219 230<br />
Full-time equivalents 192.6 203.3 216.4<br />
Students with the highest support needs (Register for Students with Severe<br />
Disabilities) in regular schools:<br />
Number 724 711 729<br />
Full-time equivalents 693.1 681.1 704.3<br />
1. Enrolment numbers are as at August of the year prior.<br />
148 Appendices » Additional Performance Measures
Access to computers in classrooms<br />
Ratio of number of students per computer device 1<br />
School type 2011 2012 2013<br />
Primary 3.2 2.8 2.6<br />
Secondary 1.5 1.3 1.2<br />
Combined 2.2 1.7 1.8<br />
Senior secondary 2.6 1.0 1.2<br />
Special 2 2.4 1.2 0.5<br />
All (Kinder to Year 12) 2.4 1.8 1.7<br />
1. Figures are as at April in each calendar year. A lower ratio indicates greater student access to computers. Includes desktop, laptop and handheld computer<br />
devices provided by the department.<br />
2. iPads for students with disabilities are included in the figures for special schools.<br />
Government expenditure ($) per student (FTE) in government schools<br />
This data is published in the Australian Government Productivity Commission Report on Government Services available<br />
at http://www.pc.gov.au/gsp/rogs<br />
Rate of staff attendance<br />
2010 2011 2012<br />
All department staff 97.9% 97.7% 97.7%<br />
Teaching staff 97.7% 97.5% 97.4%<br />
Separation rates for staff aged less than 55 years<br />
2010–11 2011–12 2012–13<br />
Tasmanian State Service Award (TSSA) general 2.3% 2.1% 2.5%<br />
<strong>Education</strong> facility attendant 0.9% 2.2% 1.9%<br />
Teaching service 0.7% 0.8% 1.3%<br />
Teacher assistant 1.3% 1.7% 2.6%<br />
TSSA professional 2.6% 0.0% 1.5%<br />
Allied health 4.3% 6.3% 8.8%<br />
Senior Executive Services (SES) 0.0% 3.6% 0.0%<br />
Average – all employment classifications 1.1% 1.4% 1.9%<br />
Appendices » Additional Performance Measures<br />
149
Abbreviations and Acronyms<br />
AAS<br />
AASB<br />
ABS<br />
ACARA<br />
AEDI<br />
ACECQA<br />
ASbA<br />
CFC<br />
COAG<br />
DFA<br />
DoE<br />
DSE<br />
EAL<br />
EYLF<br />
FTE<br />
GST<br />
ICT<br />
IFRS<br />
KDC<br />
LiL<br />
LINC<br />
LOTE<br />
MP<br />
N/A<br />
NAPLAN<br />
Australian Accounting Standards<br />
Australian Accounting Standards Board<br />
Australian Bureau of Statistics<br />
Australian Curriculum, Assessment and<br />
Reporting Authority<br />
Australian Early Development Index<br />
Australian Children’s <strong>Education</strong> and Care<br />
Quality Authority<br />
Australian School-based Apprenticeships<br />
child and family centre<br />
Council of Australian Governments<br />
Disability Framework for Action<br />
Department of <strong>Education</strong><br />
Disability Standards for <strong>Education</strong><br />
English as an Additional Language<br />
Early Years Learning Framework<br />
full-time equivalent<br />
Goods and Services Tax<br />
information and communications<br />
technology<br />
International Financial Reporting Standards<br />
Kindergarten Development Check<br />
Launching into Learning<br />
Learning and Information Network Centre<br />
Languages other than English<br />
Member of Parliament<br />
not available<br />
National Assessment Program – Literacy and<br />
Numeracy<br />
NATSIEAP National Aboriginal and Torres Strait Islander<br />
<strong>Education</strong> Action Plan<br />
NMS<br />
NQS<br />
NSSC<br />
PDP<br />
PIPS<br />
PNL<br />
PiTE<br />
PPO<br />
PL<br />
RTBCTG<br />
RTI<br />
RTOs<br />
SES<br />
SLAT<br />
SPA<br />
SRB<br />
TasTAFE<br />
THEAC<br />
TLAB<br />
TRB<br />
TSSA<br />
VET<br />
YTO<br />
YLO<br />
national minimum standard<br />
National Quality Standard (education and<br />
care)<br />
National Schools Statistics Collection<br />
Performance and Development Plan<br />
Performance Indicators in Primary Schools<br />
principal network leader<br />
Partnerships in Teaching Excellence<br />
pathway planning officer<br />
professional learning<br />
Raising the Bar Closing the Gap<br />
right to information<br />
registered training organisations<br />
socioeconomic status<br />
State Library and Archives Trust<br />
Superannuation Provision Account<br />
Schools Registration Board<br />
Tasmanian Technical and Further<br />
<strong>Education</strong><br />
Tasmanian Home <strong>Education</strong> Advisory<br />
Council<br />
Tasmanian Library Advisory Board<br />
Teachers Registration Board<br />
Tasmanian State Service Award<br />
vocational education and training<br />
youth transition officer<br />
youth learning officer<br />
150 Appendices » Abbreviations and Acronyms
Publications<br />
Curriculum Services<br />
• Supporting Literacy and Numeracy Success: A teacher’s<br />
resource for Early Years to Year 12<br />
<strong>Education</strong> and Care<br />
• Sundry information sheets<br />
• Approved Registration Bodies Licence Fees 2013–2014 –<br />
pamphlet (updated)<br />
• Centre Based Care Licence Fees 2013–2014 – pamphlet<br />
(updated)<br />
<strong>Education</strong>al Performance Services<br />
• School Improvement Reports – website<br />
• Assessment and Reporting Policy<br />
• Enrolment, Attendance and Participation Policy<br />
• Accountability Policy<br />
• Assessment and Reporting Procedures<br />
• School Attendance Procedures<br />
• School Enrolment Procedures<br />
• Enrolment brochure for schools<br />
• Attendance brochure for schools<br />
• NAPLAN 2013 brochure for schools<br />
English as an Additional Language Program<br />
• English as an Additional Language (EAL) Guidelines 2012<br />
Further <strong>Education</strong> and Training<br />
• Discussion paper Future provision of Years 11 and 12<br />
education in regional Tasmania<br />
• <strong>Education</strong> agent handbook and procedures manual<br />
• <strong>Education</strong> agent registration policy and procedure<br />
• Future provision of Years 11 and 12 education in<br />
regional Tasmania Minister’s Action Plan<br />
• GETI Tasmania tuition, accommodation and<br />
administration fee information and term/semester<br />
dates<br />
• Guaranteeing Futures – 2012 Year in Review<br />
• Homestay accommodation overview – booklet and<br />
brochure<br />
• Homestay host – handbook and general overview<br />
• Polytechnic graduation – booklet<br />
• Polytechnic Handbook – electronic<br />
• Promotional materials: flyers, brochures and<br />
presentations for education exhibitions and education<br />
agent training sessions<br />
• School-based Apprenticeships – brochure<br />
• Student Information Book (Tasmanian Polytechnic)<br />
• Student pre-departure guide<br />
• Tasmanian Government Schools: Australia<br />
• Tasmanian TAFE Diplomas 2013: International TAFE courses<br />
at the Tasmanian Polytechnic<br />
• Workplace Learning Guidelines<br />
• yourFuture – magazines<br />
• Your Guide to <strong>Education</strong> and Training in Years 11 and 12<br />
LINC Tasmania<br />
Newsletters:<br />
• On the Record (No. 9, October 2012; No.<br />
10 March 2013)<br />
• Central Highlands Digest – Ouse Online Access Centre<br />
(monthly)<br />
• Bagdad News – Bagdad Online Access Centre (monthly)<br />
• The Great Oyster Bay News – Swansea Online Access<br />
Centre (fortnightly)<br />
• Bicheno Forward – Bicheno Online Access Centre<br />
(monthly)<br />
• Richmond News – Richmond Online Access Centre<br />
(monthly)<br />
• Newsletter – Fingal Online Access Centre (monthly)<br />
• What’s on at Huon LINC (monthly)<br />
• Sorell and South East Literacy Service Newsletter<br />
• 26TEN e-news (on the 26TEN website)<br />
• LearnXpress e-news<br />
YouTube audio-visual publications:<br />
• On a plate – from glass negative to digital image (Kingston<br />
LINC and TAHO) – public YouTube clip (May 2013)<br />
• 26TEN – five promotional videos – public YouTube clips<br />
(October 2012)<br />
Annual publications:<br />
• Derwent Valley Calendar – Derwent Valley Online Access<br />
Centre<br />
• Derwent Valley Business and Services directory – Derwent<br />
Valley Online Access Centre<br />
• Ouse Calendar – Ouse Online Access Centre<br />
Statewide events – promotional publications:<br />
• Premier’s Reading Challenge promotional material –<br />
online, poster, bookmark, reading log, Guide to PRC in<br />
your school (May 2013)<br />
• Summer Holiday Program promotional material – online,<br />
brochures, flyers (December 2012)<br />
• School Holiday Programs promotional material – Holiday<br />
Fun graphics, online, brochure, flyers (June 2013)<br />
• Reading Hour promotional material – posters, online,<br />
brochure and 10 localised bookmarks (July 2012)<br />
• Library and Information Week 2013 promotional material<br />
– poster, online<br />
• 5 good reasons to join your LINC – brochure (original and<br />
modified reprint)<br />
• Children’s Services – flyers, bookmarks, posters<br />
promoting ‘Storytime’ and ‘Rock & Rhyme’, online<br />
(May 2013)<br />
General publications:<br />
• 26TEN promotional material – postcard, brochure,<br />
poster, profile sheets<br />
• Allport Library and Museum of Fine Arts – brochure<br />
(February 2013)<br />
• LearnXpress seasonal course guides (Winter/Spring/<br />
Autumn)<br />
• LINC Tasmania Christmas card (December 2013)<br />
• Modernising Tasmania’s Archives and Libraries Legislation –<br />
consultation paper (May 2013)<br />
• Promotional flyers and posters for one off events held<br />
at LINC Tasmania sites<br />
Appendices » Publications<br />
151
Marketing Services 1<br />
• Four-term information flyer<br />
• Department of <strong>Education</strong> Awards Program poster<br />
and flyer<br />
• Literacy and Numeracy Framework<br />
• Supporting Literacy and Numeracy Success resource<br />
• School Transition Fund flyer<br />
• Strategic Plan 2012–2015 Half-Yearly Highlights<br />
• School Life booklet<br />
1. A number of publications listed under other business units in this section<br />
were produced by Marketing Services.<br />
Professional Learning Institute<br />
• Prospectus<br />
Tasmanian Archive and Heritage Office<br />
Information Management Advices published online:<br />
• No. 3: Day batching of source records (January 2013)<br />
• No. 24: How to manage 3½ and 5¼ inch discs<br />
(December 2012)<br />
• No. 27: Managing Email (October 2012)<br />
• No. 28: Getting Started on the Development of an<br />
Agency Functional Disposal Schedule (November 2012)<br />
• No. 29: Managing Legacy Records (November 2012)<br />
• No. 30: Digitisation dilemmas (February 2013)<br />
• No. 36: Legislative mapping for information managers<br />
(May 2013)<br />
• No. 37: Keeping digital records accessible (May 2013)<br />
• No. 39: Developing an information asset register<br />
(May 2013)<br />
State Records Guidelines published online:<br />
• No. 8: Management of Source Records that have been<br />
Copied, Converted or Migrated (revised January 2013)<br />
• No. 10: Outsourcing of Government Business –<br />
recordkeeping issues (revised April 2013)<br />
• No. 20: Records required for legal proceedings –<br />
Implications for Tasmanian Government Agencies<br />
(December 2012)<br />
• No. 21: Approved destruction methods for state<br />
records (April 2013)<br />
Records Disposal Schedules published online:<br />
• DA222: Workers Rehabilitation and Compensation<br />
Tribunal (May 2013)<br />
• DA2101: Tasmanian Electoral Commission<br />
(January 2013)<br />
• DA2297: Department of Primary Industries, Parks,<br />
Water and Environment (April 2013)<br />
• DA2351: Department of Police and Emergency<br />
Management (May 2013)<br />
• DA2400: Environmental Management<br />
(December 2012)<br />
• DA2416: Retirement Benefits Fund (January 2013)<br />
152 Appendices » Publications
Contact Details<br />
Postal address:<br />
Department of <strong>Education</strong><br />
GPO Box 169<br />
Hobart TAS 7001<br />
Telephone: 1800 816 057<br />
Facsimile: (03) 6233 7720<br />
Email:<br />
Website contacts:<br />
servicecentre@education.tas.gov.au<br />
http://www.education.tas.gov.au/About_us/contact-us/<br />
Appendices » Contact Details<br />
153
Index<br />
A<br />
Abbreviations and Acronyms<br />
150<br />
Aboriginal programs<br />
7, 10, 21, 32, 39<br />
Administered Payments<br />
22, 82<br />
Allport Library and Museum of Fine Arts<br />
54, 75, 76, 93, 94, 95, 151<br />
Apprenticeships and traineeships<br />
45<br />
Archives<br />
50, 52, 53, 75, 76, 90, 92, 150, 151<br />
Asset Management<br />
78, 83<br />
Auditor-General’s Report<br />
140, 144<br />
Australian Curriculum<br />
5–8, 10, 12–13, 30–31, 33, 79, 97, 148, 150<br />
Australian Early Development Index (AEDI)<br />
27<br />
C<br />
Capital Investment Program<br />
22, 51<br />
Certification of Financial Statements<br />
144<br />
Child and family centres<br />
6, 12, 13, 24, 25, 26, 27, 30, 73, 83, 85, 110, 137<br />
Class sizes<br />
17, 148<br />
Clients – overview<br />
17<br />
Climate Change<br />
79, 80, 81<br />
Closing the Gap on Aboriginal Outcomes 2012–14<br />
7, 32, 39<br />
Contact Details<br />
96, 153<br />
Contracts and Tenders<br />
86<br />
D<br />
Debts Written Off<br />
83<br />
Departmental output schedules<br />
118–123<br />
Disability Framework for Action<br />
71, 72, 150<br />
E<br />
Early Years<br />
2, 5, 6, 7, 12, 13, 14, 15, 16, 20, 24–27, 29, 30, 31, 42, 61, 68<br />
Early Years Learning Framework<br />
6, 13, 24, 25, 30, 150<br />
<strong>Education</strong> and care (child care)<br />
6, 13, 15<br />
Employee development programs<br />
67, 158<br />
Employment<br />
20–21, 60–66<br />
Expenditure summary<br />
22<br />
F<br />
Financial Statements<br />
101–143<br />
Flexible learning<br />
13, 47<br />
G<br />
Grievances and investigations<br />
65<br />
Guaranteeing Futures<br />
8, 42, 43, 44, 75, 151<br />
K<br />
Kindergarten Development Check<br />
27, 29<br />
L<br />
Launching into Learning<br />
6, 13, 24–25, 27, 29, 30<br />
Lead School/Lead Teacher strategy<br />
31, 32<br />
Learning and Information Network Centres (LINCs)<br />
14, 51<br />
Learning Services<br />
12, 13, 16, 40, 61, 69, 97, 110, 119<br />
LearnXpress<br />
19, 151<br />
Legislation Administered, Enacted and Amended<br />
75<br />
LINC Tasmania<br />
2, 6, 10, 12, 14, 15, 16, 18, 22, 49–57, 61, 66, 70, 78, 85,<br />
90–91, 95, 110, 111, 121, 127, 151<br />
Literacy<br />
2, 5, 6, 7, 12–14, 24, 29, 30–40, 50–57, 69, 72, 82, 86,<br />
91, 110, 111<br />
Literacy and Numeracy Framework<br />
7, 10, 11, 12, 30–32, 69, 152<br />
Loss and Damage<br />
83, 158<br />
154 Appendices » Index
M<br />
Major Capital Projects<br />
84–85<br />
N<br />
National Assessment Program – Literacy and Numeracy<br />
(NAPLAN)<br />
7, 13, 27, 31, 32, 33, 34–35, 36, 37, 38, 39, 69, 97, 151<br />
National Quality Standard (education and care)<br />
26, 29, 150<br />
National partnerships<br />
13, 82, 124, 125<br />
New arrangements<br />
14, 15<br />
Non-statutory Bodies<br />
76–77<br />
Notes to the Financial Statements<br />
108–144<br />
Numeracy<br />
2, 5, 6, 7, 12, 13, 24, 29, 30–40, 51, 52, 69<br />
O<br />
Occupational Health and Safety<br />
65, 78<br />
Organisation chart<br />
16, 61<br />
P<br />
Partnerships in Teaching Excellence (PiTE)<br />
33, 63<br />
Pathway planning<br />
14, 42, 43, 44<br />
Performance measures<br />
6, 27, 48, 148–149<br />
Performance Indicators in Primary Schools (PIPS)<br />
27, 29, 34<br />
Performance management<br />
5, 67–68<br />
Performance and Development Framework<br />
9, 64, 67–68<br />
Post-Compulsory <strong>Education</strong> and Skills Development<br />
2, 14, 22, 41–48<br />
Pre-Compulsory and Compulsory <strong>Education</strong><br />
2, 22, 23–40, 110, 119<br />
Premier’s Reading Challenge<br />
33, 151<br />
Pricing Policies<br />
82<br />
Principal network leaders<br />
10, 12, 13, 16, 31, 33, 68<br />
Professional learning<br />
5, 8, 9, 10, 11, 12, 13, 16, 24, 25, 31, 32, 33, 61, 67, 69, 70, 71,<br />
72, 150, 152<br />
Public Access to the Department<br />
74, 157<br />
Publications<br />
11, 15, 54, 55, 74, 151–152<br />
R<br />
Raising the Bar<br />
7, 30, 31, 32<br />
Required Reporting<br />
59–100<br />
Retention<br />
8, 11, 12, 24, 31, 43, 44, 45, 48, 52, 78<br />
Retention and Attainment Strategy<br />
8, 43, 44<br />
Right to information<br />
15, 74<br />
Risk Management<br />
14, 78, 83, 124, 127, 138, 142<br />
Review of the Role and Function of<br />
Tasmania’s Public VET Providers<br />
11, 43, 56<br />
S<br />
Schools Registration Board<br />
76, 98–99, 107, 112, 140, 141, 150<br />
Services – overview<br />
12<br />
Significant accounting policies<br />
106, 110<br />
Skills Tasmania<br />
6, 10, 42, 48, 61, 66, 68, 72, 76, 84, 110, 112, 120, 125, 140<br />
State Library and Archives Trust<br />
76, 92, 150<br />
Statement of Cash Flows<br />
104<br />
Statement of Changes in Equity<br />
105<br />
Statement of Comprehensive Income<br />
102<br />
Statement of Financial Position<br />
103<br />
Statutory Bodies<br />
76–77, 157<br />
Strategic Plan, Department of <strong>Education</strong><br />
4–6, 10, 12, 13, 24, 30, 64, 67, 69<br />
Superannuation Certificate<br />
89<br />
T<br />
TasTAFE<br />
10, 14, 42, 43, 44, 47, 52, 88, 110, 125, 150<br />
Tasmanian Adult Literacy Action Plan<br />
51, 52, 72<br />
Tasmanian Curriculum<br />
6, 12, 13, 30<br />
Tasmanian Home <strong>Education</strong> Advisory Council<br />
77, 96, 150<br />
Appendices » Index<br />
155
Tasmanian Library Advisory Board<br />
76, 90, 150<br />
Tasmanian Literacy and Numeracy Framework<br />
30, 31<br />
Tasmanian Polytechnic<br />
10, 12, 14, 15, 16, 42, 43, 46, 47, 56, 61, 75, 84, 110, 111, 120,<br />
125, 151<br />
Tasmanian Skills Strategy<br />
111<br />
Trade training centres<br />
8, 14, 42, 46, 47, 85, 137<br />
V<br />
Vocational education and training<br />
10, 42, 48, 56, 75, 76, 110, 111, 124, 125, 150<br />
#<br />
26TEN Strategy<br />
51, 91<br />
156 Appendices » Index
Compliance Index<br />
This index identifies compliance with the statutory disclosure requirements for annual reporting of:<br />
• Financial Management and Audit Act 1990<br />
• State Service Act 2000<br />
• Right to Information Act 2009<br />
• Public Interest Disclosures Act 2002<br />
• State Service Regulations 2011<br />
• Integrity Commission Act 2009<br />
• various Treasurer’s Instructions and whole-of-government directions<br />
• National <strong>Education</strong> Agreement (2012).<br />
Requirement Section Page<br />
Aids to Access<br />
Table of contents Introduction 1<br />
Compliance Index Appendix – Compliance Index 157<br />
List of abbreviations Appendix – Abbreviations and Acronyms 150<br />
Head of Agency Performance<br />
A report on the performance of the functions and<br />
powers of the Head of Agency under any written law<br />
Strategic Planning<br />
An overview of agency’s strategic plan including<br />
its aims, functions and related programs<br />
Major Changes<br />
Details of any major changes that have taken<br />
place in relation to the programs, aims, functions<br />
or organisational structure of the agency<br />
Organisational Structure<br />
Organisational chart as at the end of the reporting<br />
year showing administrative structure<br />
A description of the relationship between<br />
the organisational structure and the program<br />
management structure of the agency<br />
Performance Information<br />
A narrative summary together with quantitative<br />
measures where relevant, of the functions<br />
and targets of programs or projects<br />
Economic and other factors that have affected<br />
the achievement of operational objectives<br />
Major Initiatives<br />
Details of major initiatives taken by the department<br />
to develop and give effect to government policy<br />
Statutory Offices<br />
A report by any statutory office holder employed<br />
in or attached to the department except where<br />
required to report under any other Act<br />
Statutory/Non Statutory Bodies<br />
A list of names of organisations<br />
Legislation Administered<br />
A list of legislation administered by the department<br />
Community Awareness<br />
Details of activities to develop community awareness<br />
of the department and the services it provides<br />
Whole–of-government policies<br />
Annual Report<br />
Department at a Glance – Strategic Focus 6–11<br />
Department at a Glance – New Arrangements 15<br />
Department at a Glance – Organisation 16<br />
Department at a Glance – Services 12–15<br />
Output Group Chapters 23–58<br />
Department at a Glance – Strategic Focus 6–11<br />
Output Group Chapters 23–58<br />
Required Reporting – Other Annual Reports 90–99<br />
Required Reporting – Statutory<br />
and Non-Statutory Bodies<br />
Required Reporting – Legislation,<br />
Administered Enacted and Amended<br />
76–77<br />
Required Reporting – Public Access to the Department 74<br />
Carbon Emission Reduction Plan Required Reporting – Climate Change 79–81<br />
Disability Framework for Action Required Reporting – Employment 71–73<br />
75<br />
Appendices » Compliance Index<br />
157
Requirement Section Page<br />
Right to Information<br />
Right to Information details Required Reporting – Public Access to the Department 74<br />
Public Interest Disclosures<br />
The location of procedures for<br />
public interest disclosures<br />
Asset management, risk management and pricing policies<br />
Required Reporting – Public Access to the Department 74<br />
Statement of pricing policies of goods and services Required Reporting – Pricing Policies 82<br />
Statement of administered payments Required Reporting – Administered payments 82<br />
Information on major capital projects Required Reporting – Major capital projects 84–85<br />
Statement of risk management<br />
policies, activities or initiatives<br />
Statement of asset management<br />
policies, strategies and initiatives<br />
Required Reporting – Risk management 78<br />
Required Reporting – Asset management 78<br />
Statement of debts written off Required Reporting – Debts written off 83<br />
Statement of loss and damage Required Reporting – Loss and damage 83<br />
Human Resources Management<br />
Details of recruitment policies and programs,<br />
including statistical information<br />
Information on workforce composition,<br />
including indigenous<br />
Information relating to employee training<br />
and development activities<br />
Outline of training provided to staff<br />
in relation to ethical conduct<br />
Description of department workplace diversity<br />
programs, including statistical information<br />
Required Reporting – Employment 60–70<br />
Department at a Glance – Workforce 20–21<br />
Required Reporting – Employee<br />
Development Programs<br />
Required Reporting – Employee Performance<br />
And Development Programs<br />
67–68<br />
Required Reporting – Employment 64<br />
Summary of internal grievance procedures Required Reporting – Employment 65<br />
Outline of occupational health and safety strategies Required Reporting – Employment 65<br />
Outline of processes available against<br />
decisions made by the agency<br />
Certification by the relevant agency manager relating<br />
to contributions to non-RBF superannuation funds<br />
Government Procurement<br />
A narrative statement regarding the<br />
department’s support for local business<br />
Table summarising department support for local<br />
business, including the number of procurement<br />
contracts awarded, the number of tenders called<br />
and the number of bids received and the extent<br />
of local participation in procurement activities<br />
Detailed information on all contracts awarded,<br />
including consultancy contracts, including a<br />
description of the contract, the total value of the<br />
contract and the name and locality of contractors<br />
Financial Statements<br />
Financial statements of the department including<br />
statements of any public body not required<br />
to report under any other Act, together with<br />
the audit opinion on those statements<br />
Agency Publications<br />
A list of major documents or publications<br />
produced by the department<br />
Contacts<br />
A list of contact officers and points of public access<br />
in relation to services provided by the Agency<br />
Required Reporting – Public Access to the Department 74<br />
Required Reporting – Superannuation Certificate 89<br />
Required Reporting – Contracts and Tenders 86<br />
Required Reporting – Contracts and Tenders 86<br />
Required Reporting – Contracts and Tenders 86–88<br />
Financial Statements 102–146<br />
Appendix – Publications 151–152<br />
Appendix – Contact Details 153<br />
70<br />
158 Appendices » Compliance Index
Department of <strong>Education</strong><br />
Level 1, 73 Murray Street<br />
Hobart Tasmania 7000<br />
Telephone 1800 816 057<br />
GPO Box 169<br />
Hobart Tasmania 7001<br />
www.education.tas.gov.au<br />
ISSN 1449-1575<br />
© State of Tasmania, Department of <strong>Education</strong>, 2013<br />
You may copy, distribute, display, download and otherwise freely deal with this work<br />
provided that you attribute the Department of <strong>Education</strong>, Tasmania.