Education
DoE Annual Report 2012-2013 - Department of Education
DoE Annual Report 2012-2013 - Department of Education
- No tags were found...

Create successful ePaper yourself
Turn your PDF publications into a flip-book with our unique Google optimized e-Paper software.
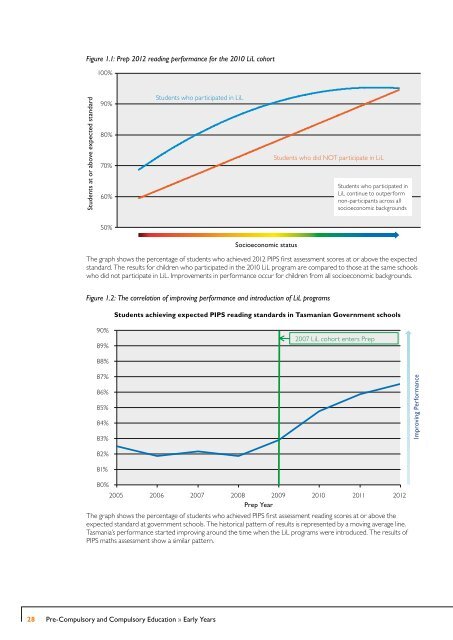
Figure 1.1: Prep 2012 reading performance for the 2010 LiL cohort<br />
100%<br />
Students at or above expected standard<br />
90%<br />
80%<br />
70%<br />
60%<br />
Students who participated in LiL<br />
Students who did NOT participate in LiL<br />
Students who participated in<br />
LiL continue to outperform<br />
non-participants across all<br />
socioeconomic backgrounds<br />
50%<br />
Socioeconomic status<br />
The graph shows the percentage of students who achieved 2012 PIPS first assessment scores at or above the expected<br />
standard. The results for children who participated in the 2010 LiL program are compared to those at the same schools<br />
who did not participate in LiL. Improvements in performance occur for children from all socioeconomic backgrounds.<br />
Figure 1.2: The correlation of improving performance and introduction of LiL programs<br />
Students achieving expected PIPS reading standards in Tasmanian Government schools<br />
90%<br />
89%<br />
2007 LiL cohort enters Prep<br />
88%<br />
87%<br />
86%<br />
85%<br />
84%<br />
83%<br />
Improving Performance<br />
82%<br />
81%<br />
80%<br />
2005 2006 2007 2008 2009 2010 2011 2012<br />
Prep Year<br />
The graph shows the percentage of students who achieved PIPS first assessment reading scores at or above the<br />
expected standard at government schools. The historical pattern of results is represented by a moving average line.<br />
Tasmania’s performance started improving around the time when the LiL programs were introduced. The results of<br />
PIPS maths assessment show a similar pattern.<br />
28<br />
Pre-Compulsory and Compulsory <strong>Education</strong> » Early Years