Education
DoE Annual Report 2012-2013 - Department of Education
DoE Annual Report 2012-2013 - Department of Education
- No tags were found...

You also want an ePaper? Increase the reach of your titles
YUMPU automatically turns print PDFs into web optimized ePapers that Google loves.
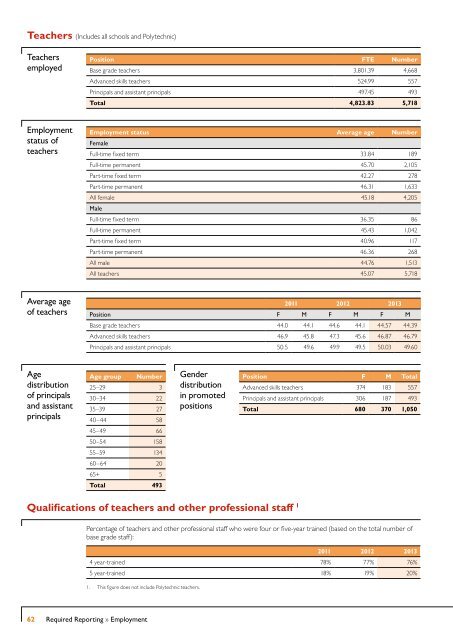
Teachers (Includes all schools and Polytechnic)<br />
Teachers<br />
employed<br />
Position FTE Number<br />
Base grade teachers 3,801.39 4,668<br />
Advanced skills teachers 524.99 557<br />
Principals and assistant principals 497.45 493<br />
Total 4,823.83 5,718<br />
Employment<br />
status of<br />
teachers<br />
Employment status Average age Number<br />
Female<br />
Full-time fixed term 33.84 189<br />
Full-time permanent 45.70 2,105<br />
Part-time fixed term 42.27 278<br />
Part-time permanent 46.31 1,633<br />
All female 45.18 4,205<br />
Male<br />
Full-time fixed term 36.35 86<br />
Full-time permanent 45.43 1,042<br />
Part-time fixed term 40.96 117<br />
Part-time permanent 46.36 268<br />
All male 44.76 1,513<br />
All teachers 45.07 5,718<br />
Average age<br />
of teachers<br />
2011 2012 2013<br />
Position F M F M F M<br />
Base grade teachers 44.0 44.1 44.6 44.1 44.57 44.39<br />
Advanced skills teachers 46.9 45.8 47.3 45.6 46.87 46.79<br />
Principals and assistant principals 50.5 49.6 49.9 49.5 50.03 49.60<br />
Age<br />
distribution<br />
of principals<br />
and assistant<br />
principals<br />
Age group Number<br />
25–29 3<br />
30–34 22<br />
35–39 27<br />
40–44 58<br />
Gender<br />
distribution<br />
in promoted<br />
positions<br />
Position F M Total<br />
Advanced skills teachers 374 183 557<br />
Principals and assistant principals 306 187 493<br />
Total 680 370 1,050<br />
45–49 66<br />
50–54 158<br />
55–59 134<br />
60–64 20<br />
65+ 5<br />
Total 493<br />
Qualifications of teachers and other professional staff 1<br />
Percentage of teachers and other professional staff who were four or five-year trained (based on the total number of<br />
base grade staff):<br />
2011 2012 2013<br />
4 year-trained 78% 77% 76%<br />
5 year-trained 18% 19% 20%<br />
1. This figure does not include Polytechnic teachers.<br />
62 Required Reporting » Employment