Education
DoE Annual Report 2012-2013 - Department of Education
DoE Annual Report 2012-2013 - Department of Education
- No tags were found...

You also want an ePaper? Increase the reach of your titles
YUMPU automatically turns print PDFs into web optimized ePapers that Google loves.
Clients<br />
Number of education and child services in Tasmania 1<br />
April 2013<br />
Services in<br />
government<br />
school sites<br />
Total<br />
number of<br />
services<br />
Number of education and care services 2 70 224 3<br />
Number of licensed child care services 4 4 40<br />
Total 74 264<br />
1. This data is not comparable with data provided prior to the 2011–12 report as it<br />
reflects the number of services, rather than the service types (e.g. after school care,<br />
before school, long day care) reported previously.<br />
2. Number of services and places approved under the <strong>Education</strong> and Care National Law<br />
Act (Tasmania) 2011.<br />
3. There has been a reduction in services since 2011–12, largely because, under the<br />
national regulations, services provided on the same or adjacent site/s can have one<br />
service approval.<br />
4. Number of services and places licensed under the Child Care Act 2001. These services<br />
may transition to education and care services over time.<br />
Students 1<br />
as at August 2012<br />
School Type FTE Number<br />
Primary 2 30,645.8 32,442<br />
Secondary 14,263.5 14,276<br />
Combined 7,222.0 7,490<br />
Senior secondary 3 7,045.7 7,602<br />
Polytechnic 1,235.1 1,671<br />
Special 419.6 792<br />
Total 60,831.7 64,273<br />
1. Mid-year 2012 census data.<br />
2. The primary school FTE student count includes Kindergarten students who attend<br />
school on a part-time basis.<br />
3. Senior secondary schools were previously referred to as colleges.<br />
Class sizes (average number of students) 1, 2<br />
Sector 2011 2012 2013<br />
Kindergarten 19.2 19.3 19.5<br />
Primary 23.0 23.2 23.4<br />
Secondary 3 22.7 23.4 23.4<br />
1. First term 2013 census data.<br />
2. Class size is based on FTE for Prep to Year 10 and headcount for Kinder. The FTE<br />
of students in classes containing the relevant year levels is divided by the number of<br />
classes containing those year levels.<br />
3. Secondary school students are not organised into classes which exclusively undertake a<br />
complete education program, therefore the department has adopted the English class<br />
size as a proxy measure.<br />
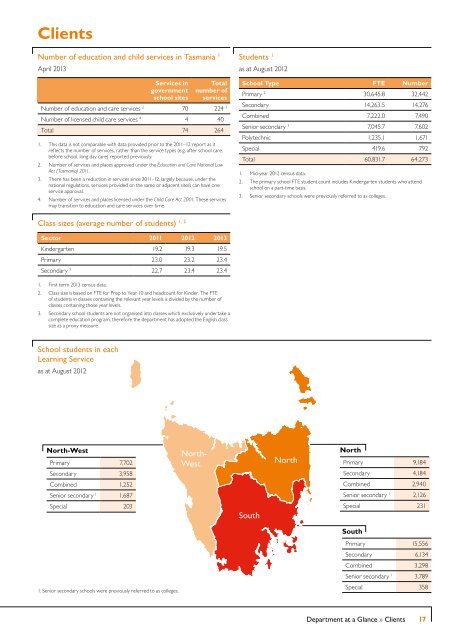
School students in each<br />
Learning Service<br />
as at August 2012<br />
North-West<br />
Primary 7,702<br />
Secondary 3,958<br />
North-<br />
West<br />
North<br />
North<br />
Primary 9,184<br />
Secondary 4,184<br />
Combined 1,252<br />
Combined 2,940<br />
Senior secondary 1 1,687<br />
Senior secondary 1 2,126<br />
Special 203<br />
South<br />
Special 231<br />
South<br />
1. Senior secondary schools were previously referred to as colleges.<br />
Primary 15,556<br />
Secondary 6,134<br />
Combined 3,298<br />
Senior secondary 1 3,789<br />
Special 358<br />
Department at a Glance » Clients<br />
17