Education
DoE Annual Report 2012-2013 - Department of Education
DoE Annual Report 2012-2013 - Department of Education
- No tags were found...

Create successful ePaper yourself
Turn your PDF publications into a flip-book with our unique Google optimized e-Paper software.
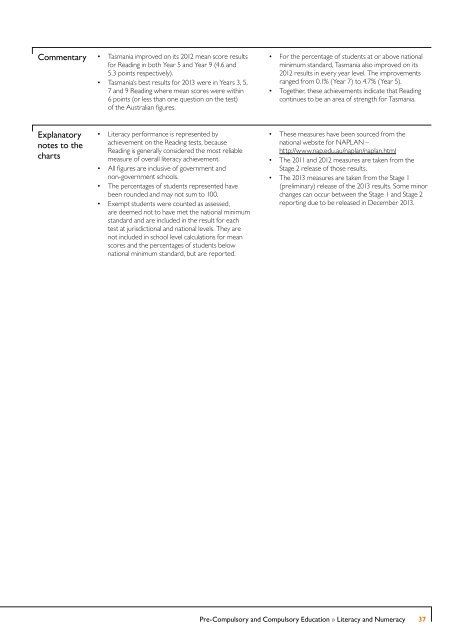
Commentary<br />
• Tasmania improved on its 2012 mean score results<br />
for Reading in both Year 5 and Year 9 (4.6 and<br />
5.3 points respectively).<br />
• Tasmania’s best results for 2013 were in Years 3, 5,<br />
7 and 9 Reading where mean scores were within<br />
6 points (or less than one question on the test)<br />
of the Australian figures.<br />
• For the percentage of students at or above national<br />
minimum standard, Tasmania also improved on its<br />
2012 results in every year level. The improvements<br />
ranged from 0.1% (Year 7) to 4.7% (Year 5).<br />
• Together, these achievements indicate that Reading<br />
continues to be an area of strength for Tasmania.<br />
Explanatory<br />
notes to the<br />
charts<br />
• Literacy performance is represented by<br />
achievement on the Reading tests, because<br />
Reading is generally considered the most reliable<br />
measure of overall literacy achievement.<br />
• All figures are inclusive of government and<br />
non-government schools.<br />
• The percentages of students represented have<br />
been rounded and may not sum to 100.<br />
• Exempt students were counted as assessed,<br />
are deemed not to have met the national minimum<br />
standard and are included in the result for each<br />
test at jurisdictional and national levels. They are<br />
not included in school level calculations for mean<br />
scores and the percentages of students below<br />
national minimum standard, but are reported.<br />
• These measures have been sourced from the<br />
national website for NAPLAN –<br />
http://www.nap.edu.au/naplan/naplan.html<br />
• The 2011 and 2012 measures are taken from the<br />
Stage 2 release of those results.<br />
• The 2013 measures are taken from the Stage 1<br />
(preliminary) release of the 2013 results. Some minor<br />
changes can occur between the Stage 1 and Stage 2<br />
reporting due to be released in December 2013.<br />
Pre-Compulsory and Compulsory <strong>Education</strong> » Literacy and Numeracy<br />
37