Education
DoE Annual Report 2012-2013 - Department of Education
DoE Annual Report 2012-2013 - Department of Education
- No tags were found...

You also want an ePaper? Increase the reach of your titles
YUMPU automatically turns print PDFs into web optimized ePapers that Google loves.
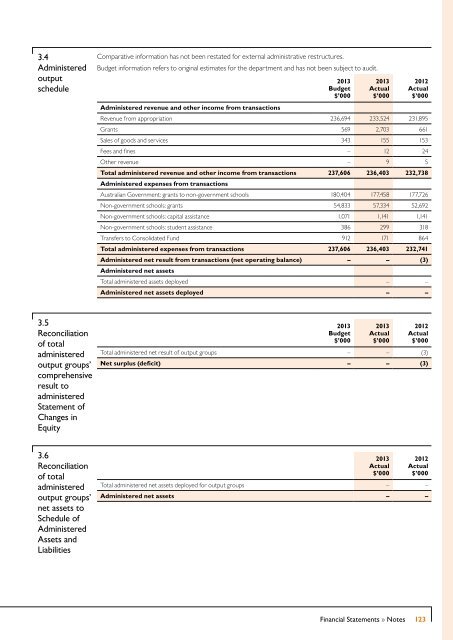
3.4<br />
Administered<br />
output<br />
schedule<br />
Comparative information has not been restated for external administrative restructures.<br />
Budget information refers to original estimates for the department and has not been subject to audit.<br />
Administered revenue and other income from transactions<br />
2013<br />
Budget<br />
$’000<br />
2013<br />
Actual<br />
$’000<br />
2012<br />
Actual<br />
$’000<br />
Revenue from appropriation 236,694 233,524 231,895<br />
Grants 569 2,703 661<br />
Sales of goods and services 343 155 153<br />
Fees and fines – 12 24<br />
Other revenue – 9 5<br />
Total administered revenue and other income from transactions 237,606 236,403 232,738<br />
Administered expenses from transactions<br />
Australian Government: grants to non-government schools 180,404 177,458 177,726<br />
Non-government schools: grants 54,833 57,334 52,692<br />
Non-government schools: capital assistance 1,071 1,141 1,141<br />
Non-government schools: student assistance 386 299 318<br />
Transfers to Consolidated Fund 912 171 864<br />
Total administered expenses from transactions 237,606 236,403 232,741<br />
Administered net result from transactions (net operating balance) – – (3)<br />
Administered net assets<br />
Total administered assets deployed – –<br />
Administered net assets deployed – –<br />
3.5<br />
Reconciliation<br />
of total<br />
administered<br />
output groups’<br />
comprehensive<br />
result to<br />
administered<br />
Statement of<br />
Changes in<br />
Equity<br />
2013<br />
Budget<br />
$’000<br />
2013<br />
Actual<br />
$’000<br />
2012<br />
Actual<br />
$’000<br />
Total administered net result of output groups – – (3)<br />
Net surplus (deficit) – – (3)<br />
3.6<br />
Reconciliation<br />
of total<br />
administered<br />
output groups’<br />
net assets to<br />
Schedule of<br />
Administered<br />
Assets and<br />
Liabilities<br />
2013<br />
Actual<br />
$’000<br />
2012<br />
Actual<br />
$’000<br />
Total administered net assets deployed for output groups – –<br />
Administered net assets – –<br />
Financial Statements » Notes<br />
123