Education
DoE Annual Report 2012-2013 - Department of Education
DoE Annual Report 2012-2013 - Department of Education
- No tags were found...

Create successful ePaper yourself
Turn your PDF publications into a flip-book with our unique Google optimized e-Paper software.
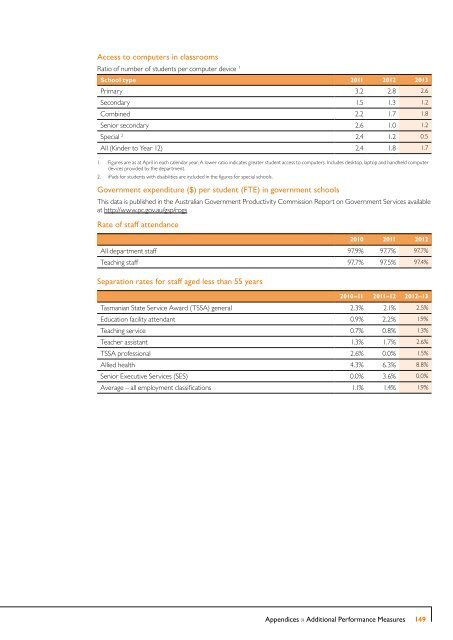
Access to computers in classrooms<br />
Ratio of number of students per computer device 1<br />
School type 2011 2012 2013<br />
Primary 3.2 2.8 2.6<br />
Secondary 1.5 1.3 1.2<br />
Combined 2.2 1.7 1.8<br />
Senior secondary 2.6 1.0 1.2<br />
Special 2 2.4 1.2 0.5<br />
All (Kinder to Year 12) 2.4 1.8 1.7<br />
1. Figures are as at April in each calendar year. A lower ratio indicates greater student access to computers. Includes desktop, laptop and handheld computer<br />
devices provided by the department.<br />
2. iPads for students with disabilities are included in the figures for special schools.<br />
Government expenditure ($) per student (FTE) in government schools<br />
This data is published in the Australian Government Productivity Commission Report on Government Services available<br />
at http://www.pc.gov.au/gsp/rogs<br />
Rate of staff attendance<br />
2010 2011 2012<br />
All department staff 97.9% 97.7% 97.7%<br />
Teaching staff 97.7% 97.5% 97.4%<br />
Separation rates for staff aged less than 55 years<br />
2010–11 2011–12 2012–13<br />
Tasmanian State Service Award (TSSA) general 2.3% 2.1% 2.5%<br />
<strong>Education</strong> facility attendant 0.9% 2.2% 1.9%<br />
Teaching service 0.7% 0.8% 1.3%<br />
Teacher assistant 1.3% 1.7% 2.6%<br />
TSSA professional 2.6% 0.0% 1.5%<br />
Allied health 4.3% 6.3% 8.8%<br />
Senior Executive Services (SES) 0.0% 3.6% 0.0%<br />
Average – all employment classifications 1.1% 1.4% 1.9%<br />
Appendices » Additional Performance Measures<br />
149