Education
DoE Annual Report 2012-2013 - Department of Education
DoE Annual Report 2012-2013 - Department of Education
- No tags were found...

Create successful ePaper yourself
Turn your PDF publications into a flip-book with our unique Google optimized e-Paper software.
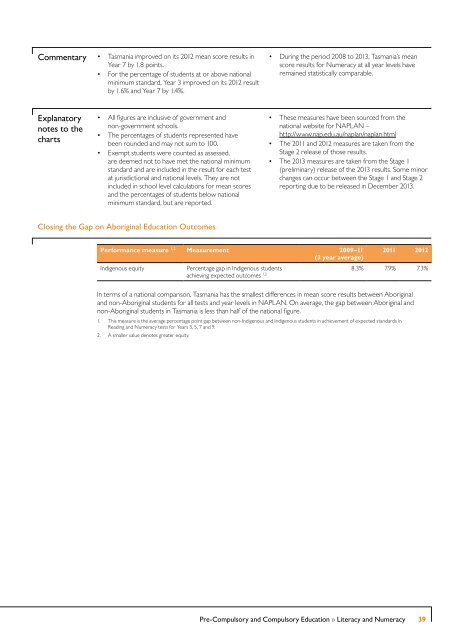
Commentary<br />
• Tasmania improved on its 2012 mean score results in<br />
Year 7 by 1.8 points.<br />
• For the percentage of students at or above national<br />
minimum standard, Year 3 improved on its 2012 result<br />
by 1.6% and Year 7 by 1.4%.<br />
• During the period 2008 to 2013, Tasmania’s mean<br />
score results for Numeracy at all year levels have<br />
remained statistically comparable.<br />
Explanatory<br />
notes to the<br />
charts<br />
• All figures are inclusive of government and<br />
non-government schools.<br />
• The percentages of students represented have<br />
been rounded and may not sum to 100.<br />
• Exempt students were counted as assessed,<br />
are deemed not to have met the national minimum<br />
standard and are included in the result for each test<br />
at jurisdictional and national levels. They are not<br />
included in school level calculations for mean scores<br />
and the percentages of students below national<br />
minimum standard, but are reported.<br />
• These measures have been sourced from the<br />
national website for NAPLAN –<br />
http://www.nap.edu.au/naplan/naplan.html<br />
• The 2011 and 2012 measures are taken from the<br />
Stage 2 release of those results.<br />
• The 2013 measures are taken from the Stage 1<br />
(preliminary) release of the 2013 results. Some minor<br />
changes can occur between the Stage 1 and Stage 2<br />
reporting due to be released in December 2013.<br />
Closing the Gap on Aboriginal <strong>Education</strong> Outcomes<br />
Performance measure 1,2 Measurement 2009–11<br />
(3 year average)<br />
Indigenous equity<br />
2011 2012<br />
Percentage gap in Indigenous students<br />
8.3% 7.9% 7.3%<br />
achieving expected outcomes 1,2<br />
In terms of a national comparison, Tasmania has the smallest differences in mean score results between Aboriginal<br />
and non-Aboriginal students for all tests and year levels in NAPLAN. On average, the gap between Aboriginal and<br />
non-Aboriginal students in Tasmania is less than half of the national figure.<br />
1. This measure is the average percentage point gap between non-Indigenous and Indigenous students in achievement of expected standards in<br />
Reading and Numeracy tests for Years 3, 5, 7 and 9.<br />
2. A smaller value denotes greater equity.<br />
Pre-Compulsory and Compulsory <strong>Education</strong> » Literacy and Numeracy<br />
39