Education
DoE Annual Report 2012-2013 - Department of Education
DoE Annual Report 2012-2013 - Department of Education
- No tags were found...

You also want an ePaper? Increase the reach of your titles
YUMPU automatically turns print PDFs into web optimized ePapers that Google loves.
Australian<br />
Early<br />
Development<br />
Index<br />
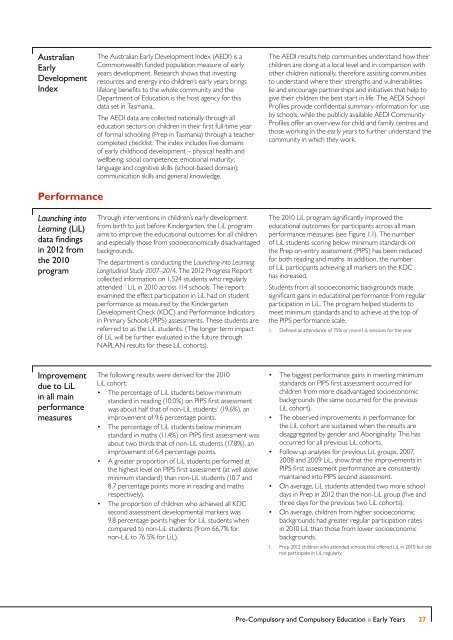
The Australian Early Development Index (AEDI) is a<br />
Commonwealth funded population measure of early<br />
years development. Research shows that investing<br />
resources and energy into children’s early years brings<br />
lifelong benefits to the whole community and the<br />
Department of <strong>Education</strong> is the host agency for this<br />
data set in Tasmania.<br />
The AEDI data are collected nationally through all<br />
education sectors on children in their first full-time year<br />
of formal schooling (Prep in Tasmania) through a teacher<br />
completed checklist. The index includes five domains<br />
of early childhood development – physical health and<br />
wellbeing; social competence; emotional maturity;<br />
language and cognitive skills (school-based domain);<br />
communication skills and general knowledge.<br />
The AEDI results help communities understand how their<br />
children are doing at a local level and in comparison with<br />
other children nationally, therefore assisting communities<br />
to understand where their strengths and vulnerabilities<br />
lie and encourage partnerships and initiatives that help to<br />
give their children the best start in life. The AEDI School<br />
Profiles provide confidential summary information for use<br />
by schools, while the publicly available AEDI Community<br />
Profiles offer an overview for child and family centres and<br />
those working in the early years to further understand the<br />
community in which they work.<br />
Performance<br />
Launching into<br />
Learning (LiL)<br />
data findings<br />
in 2012 from<br />
the 2010<br />
program<br />
Through interventions in children’s early development<br />
from birth to just before Kindergarten, the LiL program<br />
aims to improve the educational outcomes for all children<br />
and especially those from socioeconomically disadvantaged<br />
backgrounds.<br />
The department is conducting the Launching into Learning<br />
Longitudinal Study 2007–2014. The 2012 Progress Report<br />
collected information on 1,524 students who regularly<br />
attended 1 LiL in 2010 across 114 schools. The report<br />
examined the effect participation in LiL had on student<br />
performance as measured by the Kindergarten<br />
Development Check (KDC) and Performance Indicators<br />
in Primary Schools (PIPS) assessments. These students are<br />
referred to as the LiL students. (The longer term impact<br />
of LiL will be further evaluated in the future through<br />
NAPLAN results for these LiL cohorts).<br />
The 2010 LiL program significantly improved the<br />
educational outcomes for participants across all main<br />
performance measures (see Figure 1.1). The number<br />
of LiL students scoring below minimum standards on<br />
the Prep on-entry assessment (PIPS) has been reduced<br />
for both reading and maths. In addition, the number<br />
of LiL participants achieving all markers on the KDC<br />
has increased.<br />
Students from all socioeconomic backgrounds made<br />
significant gains in educational performance from regular<br />
participation in LiL. The program helped students to<br />
meet minimum standards and to achieve at the top of<br />
the PIPS performance scale.<br />
1. Defined as attendance of 75% or more LiL sessions for the year.<br />
Improvement<br />
due to LiL<br />
in all main<br />
performance<br />
measures<br />
The following results were derived for the 2010<br />
LiL cohort:<br />
• The percentage of LiL students below minimum<br />
standard in reading (10.0%) on PIPS first assessment<br />
was about half that of non-LiL students 1 (19.6%), an<br />
improvement of 9.6 percentage points.<br />
• The percentage of LiL students below minimum<br />
standard in maths (11.4%) on PIPS first assessment was<br />
about two thirds that of non-LiL students (17.8%), an<br />
improvement of 6.4 percentage points.<br />
• A greater proportion of LiL students performed at<br />
the highest level on PIPS first assessment (at well above<br />
minimum standard) than non-LiL students (10.7 and<br />
8.7 percentage points more in reading and maths<br />
respectively).<br />
• The proportion of children who achieved all KDC<br />
second assessment developmental markers was<br />
9.8 percentage points higher for LiL students when<br />
compared to non-LiL students (from 66.7% for<br />
non-LiL to 76.5% for LiL).<br />
• The biggest performance gains in meeting minimum<br />
standards on PIPS first assessment occurred for<br />
children from more disadvantaged socioeconomic<br />
backgrounds (the same occurred for the previous<br />
LiL cohort).<br />
• The observed improvements in performance for<br />
the LiL cohort are sustained when the results are<br />
disaggregated by gender and Aboriginality. This has<br />
occurred for all previous LiL cohorts.<br />
• Follow up analyses for previous LiL groups, 2007,<br />
2008 and 2009 LiL, show that the improvements in<br />
PIPS first assessment performance are consistently<br />
maintained into PIPS second assessment.<br />
• On average, LiL students attended two more school<br />
days in Prep in 2012 than the non-LiL group (five and<br />
three days for the previous two LiL cohorts).<br />
• On average, children from higher socioeconomic<br />
backgrounds had greater regular participation rates<br />
in 2010 LiL than those from lower socioeconomic<br />
backgrounds.<br />
1. Prep 2012 children who attended schools that offered LiL in 2010 but did<br />
not participate in LiL regularly.<br />
Pre-Compulsory and Compulsory <strong>Education</strong> » Early Years<br />
27