Education
DoE Annual Report 2012-2013 - Department of Education
DoE Annual Report 2012-2013 - Department of Education
- No tags were found...

You also want an ePaper? Increase the reach of your titles
YUMPU automatically turns print PDFs into web optimized ePapers that Google loves.
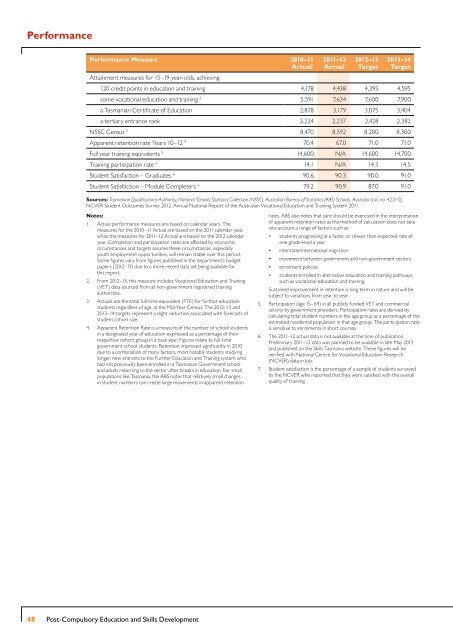
Performance<br />
Performance Measure 2010–11 2011–12 2012–13<br />
Actual 1 Actual 1 Target<br />
Attainment measures for 15–19 year-olds, achieving:<br />
2013–14<br />
Target<br />
120 credit points in education and training 4,178 4,438 4,395 4,595<br />
some vocational education and training 2 5,591 7,634 7,600 7,900<br />
a Tasmanian Certificate of <strong>Education</strong> 2,878 3,179 3,075 3,404<br />
a tertiary entrance rank 2,224 2,237 2,428 2,382<br />
NSSC Census 3 8,470 8,592 8,200 8,300<br />
Apparent retention rate Years 10–12 4 70.4 67.0 71.0 71.0<br />
Full year training equivalents 5 14,600 N/A 14,600 14,700<br />
Training participation rate 5 14.1 N/A 14.3 14.5<br />
Student Satisfaction – Graduates 6 90.6 90.3 90.0 91.0<br />
Student Satisfaction – Module Completers 6 79.2 90.9 87.0 91.0<br />
Sources: Tasmanian Qualifications Authority, National Schools Statistics Collection (NSSC), Australian Bureau of Statistics (ABS) Schools, Australia (cat. no. 4221.0),<br />
NCVER Student Outcomes Survey 2012, Annual National Report of the Australian Vocational <strong>Education</strong> and Training System 2011.<br />
Notes:<br />
1. Actual performance measures are based on calendar years. The<br />
measures for the 2010–11 Actual are based on the 2011 calendar year,<br />
while the measures for 2011–12 Actual are based on the 2012 calendar<br />
year. Completion and participation rates are affected by economic<br />
circumstances and targets assume these circumstances, especially<br />
youth employment opportunities, will remain stable over this period.<br />
Some figures vary from figures published in the department’s budget<br />
papers (2012–13) due to a more recent data set being available for<br />
this report.<br />
2. From 2012–13, this measure includes Vocational <strong>Education</strong> and Training<br />
(VET) data sourced from all non-government registered training<br />
authorities.<br />
3. Actuals are the total full-time equivalent (FTE) for further education<br />
students regardless of age, at the Mid-Year Census. The 2012–13 and<br />
2013–14 targets represent a slight reduction associated with forecasts of<br />
student cohort size.<br />
4. Apparent Retention Rate is a measure of the number of school students<br />
in a designated year of education expressed as a percentage of their<br />
respective cohort group in a base year. Figures relate to full-time<br />
government school students. Retention improved significantly in 2010<br />
due to a combination of many factors, most notably students studying<br />
longer, new entrants to the Further <strong>Education</strong> and Training system who<br />
had not previously been enrolled in a Tasmanian Government school<br />
and adults returning to the sector after breaks in education. For small<br />
populations like Tasmania, the ABS notes that relatively small changes<br />
in student numbers can create large movements in apparent retention<br />
rates. ABS also notes that care should be exercised in the interpretation<br />
of apparent retention rates as the method of calculation does not take<br />
into account a range of factors such as:<br />
• students progressing at a faster or slower than expected rate of<br />
one grade-level a year<br />
• interstate/international migration<br />
• movement between government and non-government sectors<br />
• enrolment policies<br />
• students enrolled in alternative education and training pathways,<br />
such as vocational education and training.<br />
Sustained improvement in retention is long term in nature and will be<br />
subject to variations from year to year.<br />
5. Participation (age 15–64) in all publicly funded VET and commercial<br />
activity by government providers. Participation rates are derived by<br />
calculating total student numbers in the age group as a percentage of the<br />
estimated residential population in that age group. The participation rate<br />
is sensitive to enrolments in short courses.<br />
6. The 2011–12 actual data is not available at the time of publication.<br />
Preliminary 2011–12 data was planned to be available in late May 2013<br />
and published on the Skills Tasmania website. These figures will be<br />
verified with National Centre for Vocational <strong>Education</strong> Research<br />
(NCVER) data in July.<br />
7. Student satisfaction is the percentage of a sample of students surveyed<br />
by the NCVER who reported that they were satisfied with the overall<br />
quality of training.<br />
48 Post-Compulsory <strong>Education</strong> and Skills Development