Education
DoE Annual Report 2012-2013 - Department of Education
DoE Annual Report 2012-2013 - Department of Education
- No tags were found...

Create successful ePaper yourself
Turn your PDF publications into a flip-book with our unique Google optimized e-Paper software.
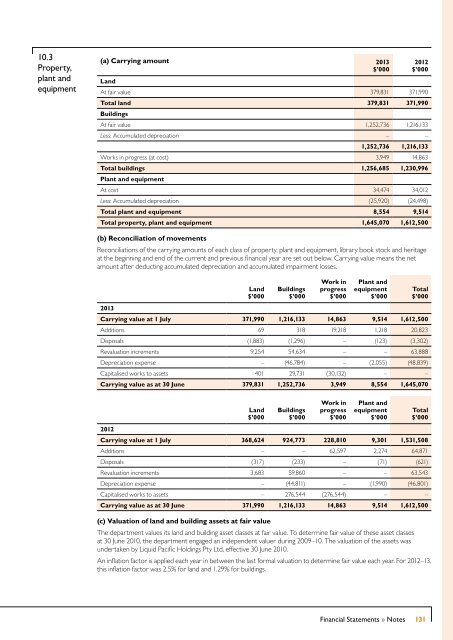
10.3<br />
Property,<br />
plant and<br />
equipment<br />
(a) Carrying amount 2013<br />
$’000<br />
Land<br />
2012<br />
$’000<br />
At fair value 379,831 371,990<br />
Total land 379,831 371,990<br />
Buildings<br />
At fair value 1,252,736 1,216,133<br />
Less: Accumulated depreciation – –<br />
1,252,736 1,216,133<br />
Works in progress (at cost) 3,949 14,863<br />
Total buildings 1,256,685 1,230,996<br />
Plant and equipment<br />
At cost 34,474 34,012<br />
Less: Accumulated depreciation (25,920) (24,498)<br />
Total plant and equipment 8,554 9,514<br />
Total property, plant and equipment 1,645,070 1,612,500<br />
(b) Reconciliation of movements<br />
Reconciliations of the carrying amounts of each class of property, plant and equipment, library book stock and heritage<br />
at the beginning and end of the current and previous financial year are set out below. Carrying value means the net<br />
amount after deducting accumulated depreciation and accumulated impairment losses.<br />
2013<br />
Land<br />
$’000<br />
Buildings<br />
$’000<br />
Work in<br />
progress<br />
$’000<br />
Plant and<br />
equipment<br />
$’000<br />
Total<br />
$’000<br />
Carrying value at 1 July 371,990 1,216,133 14,863 9,514 1,612,500<br />
Additions 69 318 19,218 1,218 20,823<br />
Disposals (1,883) (1,296) – (123) (3,302)<br />
Revaluation increments 9,254 54,634 – – 63,888<br />
Depreciation expense – (46,784) – (2,055) (48,839)<br />
Capitalised works to assets 401 29,731 (30,132) – –<br />
Carrying value as at 30 June 379,831 1,252,736 3,949 8,554 1,645,070<br />
2012<br />
Land<br />
$’000<br />
Buildings<br />
$’000<br />
Work in<br />
progress<br />
$’000<br />
Plant and<br />
equipment<br />
$’000<br />
Total<br />
$’000<br />
Carrying value at 1 July 368,624 924,773 228,810 9,301 1,531,508<br />
Additions – – 62,597 2,274 64,871<br />
Disposals (317) (233) – (71) (621)<br />
Revaluation increments 3,683 59,860 – – 63,543<br />
Depreciation expense – (44,811) – (1,990) (46,801)<br />
Capitalised works to assets – 276,544 (276,544) – –<br />
Carrying value as at 30 June 371,990 1,216,133 14,863 9,514 1,612,500<br />
(c) Valuation of land and building assets at fair value<br />
The department values its land and building asset classes at fair value. To determine fair value of these asset classes<br />
at 30 June 2010, the department engaged an independent valuer during 2009–10. The valuation of the assets was<br />
undertaken by Liquid Pacific Holdings Pty Ltd, effective 30 June 2010.<br />
An inflation factor is applied each year in between the last formal valuation to determine fair value each year. For 2012–13,<br />
this inflation factor was 2.5% for land and 1.29% for buildings.<br />
Financial Statements » Notes<br />
131