Education
DoE Annual Report 2012-2013 - Department of Education
DoE Annual Report 2012-2013 - Department of Education
- No tags were found...

Create successful ePaper yourself
Turn your PDF publications into a flip-book with our unique Google optimized e-Paper software.
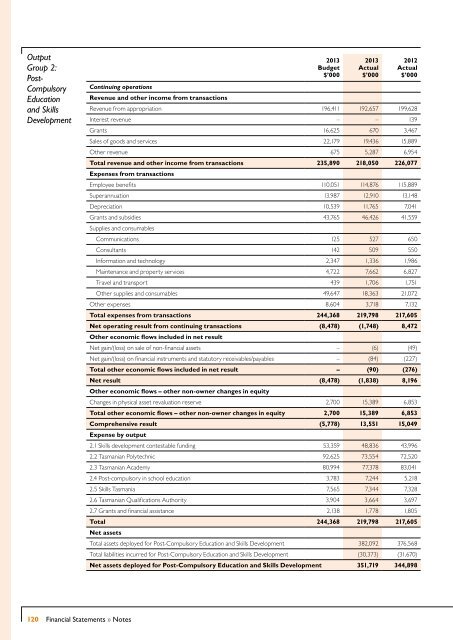
Output<br />
Group 2:<br />
Post-<br />
Compulsory<br />
<strong>Education</strong><br />
and Skills<br />
Development<br />
Continuing operations<br />
Revenue and other income from transactions<br />
2013<br />
Budget<br />
$’000<br />
2013<br />
Actual<br />
$’000<br />
2012<br />
Actual<br />
$’000<br />
Revenue from appropriation 196,411 192,657 199,628<br />
Interest revenue – – 139<br />
Grants 16,625 670 3,467<br />
Sales of goods and services 22,179 19,436 15,889<br />
Other revenue 675 5,287 6,954<br />
Total revenue and other income from transactions 235,890 218,050 226,077<br />
Expenses from transactions<br />
Employee benefits 110,051 114,876 115,889<br />
Superannuation 13,987 12,910 13,148<br />
Depreciation 10,539 11,765 7,041<br />
Grants and subsidies 43,765 46,426 41,559<br />
Supplies and consumables<br />
Communications 125 527 650<br />
Consultants 142 509 550<br />
Information and technology 2,347 1,336 1,986<br />
Maintenance and property services 4,722 7,662 6,827<br />
Travel and transport 439 1,706 1,751<br />
Other supplies and consumables 49,647 18,363 21,072<br />
Other expenses 8,604 3,718 7,132<br />
Total expenses from transactions 244,368 219,798 217,605<br />
Net operating result from continuing transactions (8,478) (1,748) 8,472<br />
Other economic flows included in net result<br />
Net gain/(loss) on sale of non-financial assets – (6) (49)<br />
Net gain/(loss) on financial instruments and statutory receivables/payables – (84) (227)<br />
Total other economic flows included in net result – (90) (276)<br />
Net result (8,478) (1,838) 8,196<br />
Other economic flows – other non-owner changes in equity<br />
Changes in physical asset revaluation reserve 2,700 15,389 6,853<br />
Total other economic flows – other non-owner changes in equity 2,700 15,389 6,853<br />
Comprehensive result (5,778) 13,551 15,049<br />
Expense by output<br />
2.1 Skills development contestable funding 53,359 48,836 43,996<br />
2.2 Tasmanian Polytechnic 92,625 73,554 72,520<br />
2.3 Tasmanian Academy 80,994 77,378 83,041<br />
2.4 Post-compulsory in school education 3,783 7,244 5,218<br />
2.5 Skills Tasmania 7,565 7,344 7,328<br />
2.6 Tasmanian Qualifications Authority 3,904 3,664 3,697<br />
2.7 Grants and financial assistance 2,138 1,778 1,805<br />
Total 244,368 219,798 217,605<br />
Net assets<br />
Total assets deployed for Post-Compulsory <strong>Education</strong> and Skills Development 382,092 376,568<br />
Total liabilities incurred for Post-Compulsory <strong>Education</strong> and Skills Development (30,373) (31,670)<br />
Net assets deployed for Post-Compulsory <strong>Education</strong> and Skills Development 351,719 344,898<br />
120 Financial Statements » Notes