INFORME ECONOMICO MENSUAL
INFORME ECONOMICO MENSUAL - Sofofa
INFORME ECONOMICO MENSUAL - Sofofa

You also want an ePaper? Increase the reach of your titles
YUMPU automatically turns print PDFs into web optimized ePapers that Google loves.
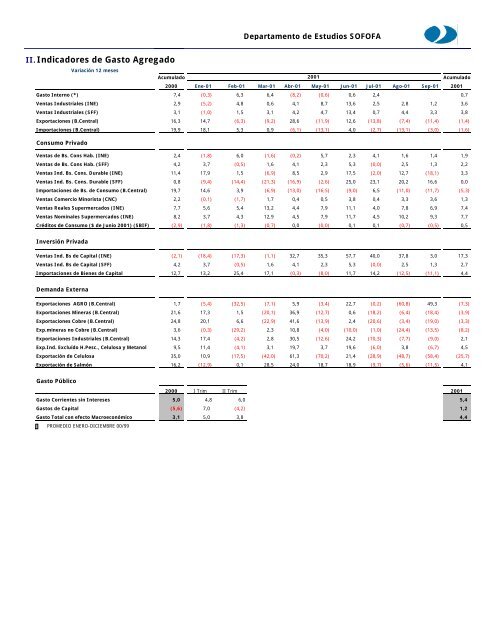
Departamento de Estudios SOFOFA<br />
II.Indicadores de Gasto Agregado<br />
Variación 12 meses<br />
Acumulado<br />
2001<br />
Acumulado<br />
2000 Ene-01 Feb-01 Mar-01 Abr-01 May-01 Jun-01 Jul-01 Ago-01 Sep-01 2001<br />
Gasto Interno (*) 7,4 (0,3) 6,3 6,4 (8,2) (0,6) 0,6 2,4 0,7<br />
Ventas Industriales (INE) 2,9 (5,2) 4,8 0,6 4,1 8,7 13,6 2,5 2,8 1,2 3,6<br />
Ventas Industriales (SFF) 3,1 (1,0) 1,5 3,1 4,2 4,7 13,4 0,7 4,4 3,3 3,8<br />
Exportaciones (B.Central) 16,3 14,7 (6,3) (9,2) 28,6 (11,9) 12,6 (13,8) (7,4) (11,4) (1,4)<br />
Importaciones (B.Central) 19,9 18,1 5,3 0,9 (6,1) (13,1) 4,0 (2,7) (13,1) (3,0) (1,6)<br />
Consumo Privado<br />
Ventas de Bs. Cons Hab. (INE) 2,4 (1,8) 6,0 (1,6) (0,2) 5,7 2,3 4,1 1,6 1,4 1,9<br />
Ventas de Bs. Cons Hab. (SFF) 4,2 3,7 (0,5) 1,6 4,1 2,3 5,3 (0,0) 2,5 1,3 2,2<br />
Ventas Ind. Bs. Cons. Durable (INE) 11,4 17,9 1,5 (6,9) 8,5 2,9 17,5 (2,0) 12,7 (18,1) 3,3<br />
Ventas Ind. Bs. Cons. Durable (SFF) 0,8 (9,4) (14,4) (21,3) (16,9) (2,6) 25,0 23,1 20,2 16,6 0,0<br />
Importaciones de Bs. de Consumo (B.Central) 19,7 14,6 3,9 (6,9) (13,0) (16,5) (9,0) 6,5 (11,0) (11,7) (5,3)<br />
Ventas Comercio Minorista (CNC) 2,2 (0,1) (1,7) 1,7 0,4 0,5 3,8 0,4 3,3 3,6 1,3<br />
Ventas Reales Supermercados (INE) 7,7 5,6 5,4 13,2 4,4 7,9 11,1 4,0 7,8 6,9 7,4<br />
Ventas Nominales Supermercados (INE) 8,2 3,7 4,3 12,9 4,5 7,9 11,7 4,5 10,2 9,3 7,7<br />
Créditos de Consumo ($ de Junio 2001) (SBIF) (2,9) (1,8) (1,3) (0,7) 0,0 (0,0) 0,1 0,1 (0,7) (0,5) 0,5<br />
Inversión Privada<br />
Ventas Ind. Bs de Capital (INE) (2,1) (18,4) (17,3) (1,1) 32,7 35,3 57,7 40,0 37,8 3,0 17,3<br />
Ventas Ind. Bs de Capital (SFF) 4,2 3,7 (0,5) 1,6 4,1 2,3 5,3 (0,0) 2,5 1,3 2,7<br />
Importaciones de Bienes de Capital 12,7 13,2 25,4 17,1 (0,3) (8,0) 11,7 14,2 (12,5) (11,1) 4,4<br />
Demanda Externa<br />
Exportaciones AGRO (B.Central) 1,7 (5,4) (32,5) (7,1) 5,9 (3,4) 22,7 (0,2) (60,8) 49,3 (7,3)<br />
Exportaciones Mineras (B.Central) 21,6 17,3 1,5 (20,1) 36,9 (12,7) 0,6 (18,2) (6,4) (18,4) (3,9)<br />
Exportaciones Cobre (B.Central) 24,8 20,1 6,6 (22,9) 41,6 (13,9) 2,4 (20,6) (3,4) (19,0) (3,3)<br />
Exp.mineras no Cobre (B.Central) 3,6 (0,3) (29,2) 2,3 10,8 (4,0) (10,0) (1,0) (24,4) (13,5) (8,2)<br />
Exportaciones Industriales (B.Central) 14,3 17,4 (4,2) 2,8 30,5 (12,6) 24,2 (10,3) (7,7) (9,0) 2,1<br />
Exp.Ind. Excluído H.Pesc., Celulosa y Metanol 9,5 11,4 (4,1) 3,1 19,7 3,7 19,6 (6,0) 3,8 (6,7) 4,5<br />
Exportación de Celulosa 35,0 10,9 (17,5) (42,0) 61,3 (70,2) 21,4 (28,9) (48,7) (58,4) (25,7)<br />
Exportación de Salmón 16,2 (12,9) 0,1 28,5 24,0 18,7 18,9 (9,7) (5,6) (11,5) 4,1<br />
Gasto Público<br />
2000 I Trim II Trim 2001<br />
Gasto Corrientes sin Intereses 5,0 4,8 6,0 5,4<br />
Gastos de Capital (5,6) 7,0 (4,2) 1,2<br />
Gasto Total con efecto Macroeconómico 3,1 5,0 3,8 4,4<br />
PROMEDIO ENERO-DICIEMBRE 00/99