INFORME ECONOMICO MENSUAL
INFORME ECONOMICO MENSUAL - Sofofa
INFORME ECONOMICO MENSUAL - Sofofa

You also want an ePaper? Increase the reach of your titles
YUMPU automatically turns print PDFs into web optimized ePapers that Google loves.
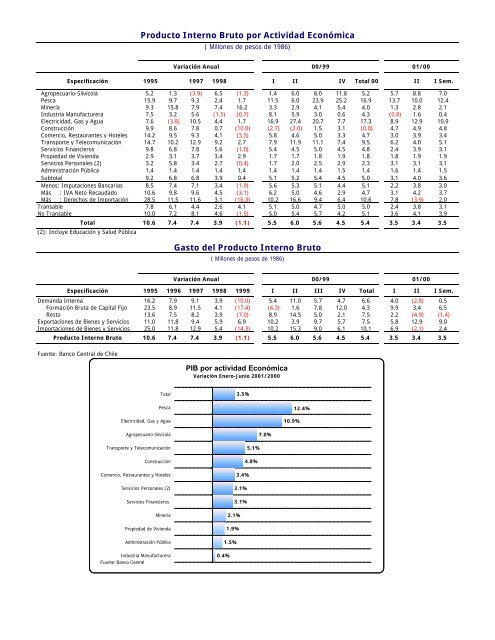
Producto Interno Bruto por Actividad Económica<br />
( Millones de pesos de 1986)<br />
Especificación 1995 1997 1998 I II IV Total 00 II I Sem.<br />
Agropecuario-Silvícola 5.2 1.3 (3.9) 6.5 (1.3) 1.4 6.0 8.0 11.8 5.2 5.7 8.8 7.0<br />
Pesca 15.9 9.7 9.3 2.4 1.7 11.5 6.0 23.9 25.2 16.9 13.7 10.0 12.4<br />
Minería 9.3 15.8 7.9 7.4 16.2 3.3 2.9 4.1 5.4 4.0 1.3 2.8 2.1<br />
Industria Manufacturera 7.5 3.2 5.6 (1.5) (0.7) 8.1 5.9 3.0 0.6 4.3 (0.8) 1.6 0.4<br />
Electricidad, Gas y Agua 7.6 (3.8) 10.5 4.4 1.7 16.9 27.4 20.7 7.7 17.3 8.9 12.9 10.9<br />
Construcción 9.9 8.6 7.8 0.7 (10.0) (2.7) (2.0) 1.5 3.1 (0.0) 4.7 4.9 4.8<br />
Comercio, Restaurantes y Hoteles 14.2 9.5 9.3 4.1 (3.5) 5.8 4.6 5.0 3.3 4.7 3.0 3.9 3.4<br />
Transporte y Telecomunicación 14.7 10.2 12.9 9.2 2.7 7.9 11.9 11.1 7.4 9.5 6.2 4.0 5.1<br />
Servicios Financieros 9.8 6.8 7.8 5.6 (1.0) 5.4 4.5 5.0 4.5 4.8 2.4 3.9 3.1<br />
Propiedad de Vivienda 2.9 3.1 3.7 3.4 2.9 1.7 1.7 1.8 1.9 1.8 1.8 1.9 1.9<br />
Servicios Personales (2) 3.2 5.8 3.4 2.7 (0.4) 1.7 2.0 2.5 2.9 2.3 3.1 3.1 3.1<br />
Administración Pública 1.4 1.4 1.4 1.4 1.4 1.4 1.4 1.4 1.5 1.4 1.6 1.4 1.5<br />
Subtotal 9.2 6.8 6.8 3.9 0.4 5.1 5.2 5.4 4.5 5.0 3.1 4.0 3.6<br />
Menos: Imputaciones Bancarias 8.5 7.4 7.1 3.4 (1.9) 5.6 5.3 5.1 4.4 5.1 2.2 3.8 3.0<br />
Más : IVA Neto Recaudado 10.6 9.8 9.6 4.5 (3.1) 6.2 5.0 4.6 2.9 4.7 3.1 4.2 3.7<br />
Más : Derechos de Importación 28.5 11.5 11.6 3.1 (16.3) 10.2 16.6 9.4 6.4 10.6 7.8 (3.9) 2.0<br />
Transable 7.8 6.1 4.4 2.6 4.1 5.1 5.0 4.7 5.0 5.0 2.4 3.8 3.1<br />
No Transable 10.0 7.2 8.1 4.6 (1.5) 5.0 5.4 5.7 4.2 5.1 3.6 4.1 3.9<br />
Total 10.6 7.4 7.4 3.9 (1.1) 5.5 6.0 5.6 4.5 5.4 3.5 3.4 3.5<br />
(2): Incluye Educación y Salud Pública<br />
Variación Anual 00/99<br />
01/00<br />
Gasto del Producto Interno Bruto<br />
( Millones de pesos de 1986)<br />
Variación Anual<br />
00/99<br />
01/00<br />
Especificación 1995 1996 1997 1998 1999 I II III IV Total I II I Sem.<br />
Demanda Interna 16.2 7.9 9.1 3.9 (10.0) 5.4 11.0 5.7 4.7 6.6 4.0 (2.8) 0.5<br />
Formación Bruta de Capital Fijo 23.5 8.9 11.5 4.1 (17.4) (4.3) 1.6 7.8 12.0 4.3 9.9 3.4 6.5<br />
Resto 13.6 7.5 8.2 3.9 (7.0) 8.9 14.5 5.0 2.1 7.5 2.2 (4.9) (1.4)<br />
Exportaciones de Bienes y Servicios 11.0 11.8 9.4 5.9 6.9 10.2 3.9 9.7 5.7 7.5 5.8 12.9 9.0<br />
Importaciones de Bienes y Servicios 25.0 11.8 12.9 5.4 (14.3) 10.2 15.3 9.0 6.1 10.1 6.9 (2.1) 2.4<br />
Producto Interno Bruto 10.6 7.4 7.4 3.9 (1.1) 5.5 6.0 5.6 4.5 5.4 3.5 3.4 3.5<br />
Fuente: Banco Central de Chile<br />
PIB por actividad Económica<br />
Variación Enero-Junio 2001/2000<br />
Total<br />
3.5%<br />
Pesca<br />
Electricidad, Gas y Agua<br />
10.9%<br />
12.4%<br />
Agropecuario-Silvícola<br />
Transporte y Telecomunicación<br />
Construcción<br />
Comercio, Restaurantes y Hoteles<br />
Servicios Personales (2)<br />
Servicios Financieros<br />
Minería<br />
Propiedad de Vivienda<br />
Administración Pública<br />
Industria Manufacturera<br />
Fuente: Banco Central<br />
7.0%<br />
5.1%<br />
4.8%<br />
3.4%<br />
3.1%<br />
3.1%<br />
2.1%<br />
1.9%<br />
1.5%<br />
0.4%