


You also want an ePaper? Increase the reach of your titles
YUMPU automatically turns print PDFs into web optimized ePapers that Google loves.
Gorgey AS et al . Adiposity and SCI<br />
3500<br />
Number <strong>of</strong> pixels<br />
3000<br />
2500<br />
2000<br />
1500<br />
1000<br />
Muscle peak<br />
Fat peak<br />
8<br />
9<br />
1<br />
6<br />
2<br />
10<br />
HO 7<br />
5<br />
3<br />
500<br />
0<br />
0 500 1000 1500<br />
4<br />
Signal intensity<br />
Figure 1 Histogram analysis <strong>of</strong> the whole thigh region representing both<br />
muscle (left) and fat (right) peaks as well as the mid-point signal intensity<br />
that is used a cut-<strong>of</strong>f point to separate between muscle or inter-intramuscular<br />
fat pixels.<br />
not been well validated in the field <strong>of</strong> body composition<br />
and SCI, with a considerable debate about its efficacy<br />
in identifying those at risks <strong>of</strong> developing cardiometabolic<br />
complications. It is well established that BMI<br />
underestimates the percentage fat mass (FM) in persons<br />
with SCI, with a continuous effort to develop a population<br />
specific BMI criteria [17] . The term adiposity refers to<br />
infiltration or storage <strong>of</strong> adipose tissue in subcutaneous<br />
or ectopic sites due to inactivity, disruption in hormonal<br />
secretion, altered body composition and poor nutritional<br />
choices after SCI. Studying whole and regional adiposity<br />
may need specialized body composition assessment<br />
techniques to accurately quantify adiposity after SCI.<br />
Although the prevalence <strong>of</strong> obesity may easily exceed<br />
two-thirds <strong>of</strong> the SCI population [23] ; we believe that that<br />
the SCI population suffers from excessive adiposity that<br />
exceeds 30% <strong>of</strong> the whole body mass [6,17] . This may be<br />
true in 50% <strong>of</strong> the SCI population despite having normal<br />
BMI, which leads to significant metabolic and health<br />
implications [6] .<br />
TYPES OF ADIPOSE TISSUE<br />
Advances in imaging technology similar to the use <strong>of</strong><br />
MRI, ultrasound and dual-energy X-ray absorptiometry<br />
(DXA) facilitate the study <strong>of</strong> the distribution <strong>of</strong> regional<br />
adiposity [19-22] . DXA scans are commonly used in the<br />
clinical settings to measure total, regional body composition<br />
and bone mineral density or content. However,<br />
DXA is limited in distinguishing between subcutaneous<br />
adipose tissue (SAT) and ectopic adipose tissue [6] .<br />
The anatomy and distribution <strong>of</strong> adipose tissue is <strong>of</strong><br />
particular interest to the metabolic health after SCI [5-7,16] .<br />
Triglycerides can be either stored in subcutaneous or<br />
ectopic sites similar to the peritoneum, visceral adipose<br />
tissue (VAT), in the liver (steatosis), in the muscle<br />
such as IMF or IeMF and in the bone marrow as BMF.<br />
The mechanisms by which triglycerides are stored in<br />
subcutaneous or ectopic sites are poorly understood;<br />
however, it is linked to genetic and lifestyle factors.<br />
Adopting an active lifestyle including routine exercise<br />
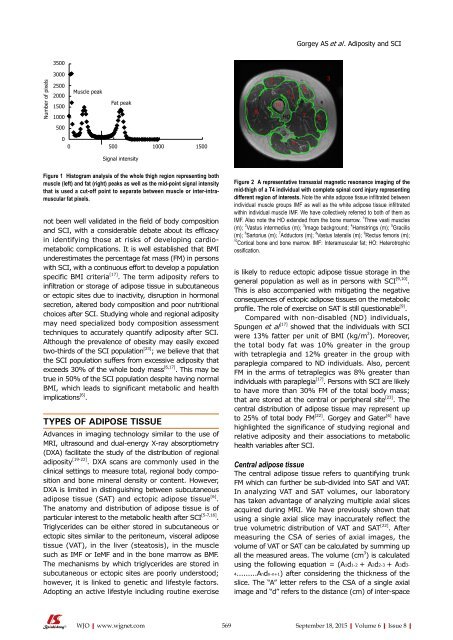
Figure 2 A representative transaxial magnetic resonance imaging <strong>of</strong> the<br />
mid-thigh <strong>of</strong> a T4 individual with complete spinal cord injury representing<br />
different region <strong>of</strong> interests. Note the white adipose tissue infiltrated between<br />
individual muscle groups IMF as well as the white adipose tissue infiltrated<br />
within individual muscle IMF. We have collectively referred to both <strong>of</strong> them as<br />
IMF. Also note the HO extended from the bone marrow. 1 Three vasti muscles<br />
(m); 2 Vastus intermedius (m); 3 Image background; 4 Hamstrings (m); 5 Gracilis<br />
(m); 6 Sartorius (m); 7 Adductors (m); 8 Vastus lateralis (m); 9 Rectus femoris (m);<br />
10<br />
Cortical bone and bone marrow. IMF: Interamuscular fat; HO: Heterotrophic<br />
ossification.<br />
is likely to reduce ectopic adipose tissue storage in the<br />
general population as well as in persons with SCI [9,10] .<br />
This is also accompanied with mitigating the negative<br />
consequences <strong>of</strong> ectopic adipose tissues on the metabolic<br />
pr<strong>of</strong>ile. The role <strong>of</strong> exercise on SAT is still questionable [9] .<br />
Compared with non-disabled (ND) individuals,<br />
Spungen et al [17] showed that the individuals with SCI<br />
were 13% fatter per unit <strong>of</strong> BMI (kg/m 2 ). Moreover,<br />
the total body fat was 10% greater in the group<br />
with tetraplegia and 12% greater in the group with<br />
paraplegia compared to ND individuals. Also, percent<br />
FM in the arms <strong>of</strong> tetraplegics was 8% greater than<br />
individuals with paraplegia [17] . Persons with SCI are likely<br />
to have more than 30% FM <strong>of</strong> the total body mass;<br />
that are stored at the central or peripheral site [23] . The<br />
central distribution <strong>of</strong> adipose tissue may represent up<br />
to 25% <strong>of</strong> total body FM [22] . Gorgey and Gater [6] have<br />
highlighted the significance <strong>of</strong> studying regional and<br />
relative adiposity and their associations to metabolic<br />
health variables after SCI.<br />
Central adipose tissue<br />
The central adipose tissue refers to quantifying trunk<br />
FM which can further be sub-divided into SAT and VAT.<br />
In analyzing VAT and SAT volumes, our laboratory<br />
has taken advantage <strong>of</strong> analyzing multiple axial slices<br />
acquired during MRI. We have previously shown that<br />
using a single axial slice may inaccurately reflect the<br />
true volumetric distribution <strong>of</strong> VAT and SAT [22] . After<br />
measuring the CSA <strong>of</strong> series <strong>of</strong> axial images, the<br />
volume <strong>of</strong> VAT or SAT can be calculated by summing up<br />
all the measured areas. The volume (cm 3 ) is calculated<br />
using the following equation = (A1d1-2 + A2d2-3 + A3d3-<br />
4.........Andn-n+1) after considering the thickness <strong>of</strong> the<br />
slice. The “A” letter refers to the CSA <strong>of</strong> a single axial<br />
image and “d” refers to the distance (cm) <strong>of</strong> inter-space<br />
WJO|www.wjgnet.com 569<br />
September 18, 2015|Volume 6|Issue 8|