


You also want an ePaper? Increase the reach of your titles
YUMPU automatically turns print PDFs into web optimized ePapers that Google loves.
Sathiyakumar V et al . Isolated sacral injuries<br />
Table 1 Demographic characteristics <strong>of</strong> patients<br />
ORIF (n = 31) Percutaneous (n = 63) Total<br />
Average age (yr) 44 37.1 39.3<br />
Gender (n)<br />
Male 19 22 41<br />
Female 12 41 53<br />
Average BMI (kg/m 2 ) 26.1 24.8 25.5<br />
25.00%<br />
20.00%<br />
15.00%<br />
10.00%<br />
5.00%<br />
ORIF<br />
Percutaneous<br />
ORIF: Open reduction and internal fixation; BMI: Body mass index.<br />
0.00%<br />
Complications<br />
Readmissions<br />
$ 50000<br />
$ 45000<br />
$ 40000<br />
$ 35000<br />
$ 30000<br />
$ 25000<br />
$ 20000<br />
$ 15000<br />
$ 10000<br />
$ 5000<br />
$ 0<br />
to readmission were also collected for each patient,<br />
including the number <strong>of</strong> emergency room visits and clinic<br />
visits before a patient was admitted or readmitted to the<br />
hospital. The average cost per inpatient day ($4530/d)<br />
as well as all costs associated with anesthesia, surgery,<br />
and ancillary support (i.e., postoperative lab tests,<br />
radiography, consults, etc.) was obtained from the<br />
institution’s patient financial services department.<br />
Fisher’s exact, student’s t-tests (for parametric<br />
variables such as LOS), and Mann-Whitney U tests<br />
(for non-parametric variables such as number <strong>of</strong> clinic<br />
visits) were employed to compare patients undergoing<br />
ORIF to those undergoing percutaneous fixation to note<br />
differences in hospital LOS and subsequent inpatient<br />
costs, complication rates, and readmission rates.<br />
RESULTS<br />
$ 45300<br />
Inpatient cost<br />
$ 31710<br />
ORIF (LOS = 10) Percutaneous (LOS = 7)<br />
Figure 1 Differences in inpatient costs based on operative approach.<br />
ORIF: Open reduction and internal fixation; LOS: Length <strong>of</strong> stay.<br />
Ninety-four patients with isolated sacral injuries were<br />
identified for analysis: 31 patients (30.4%) underwent<br />
ORIF vs 63 patients (67.0%) who underwent<br />
percutaneous fixation (Table 1). The average age <strong>of</strong> all<br />
patients was 39.3 years, with ORIF patients older than<br />
percutaneous patients. There were 53 females and 41<br />
males included in the study, with more men in the ORIF<br />
group and more women in the percutaneous group.<br />
The average BMI <strong>of</strong> all patients was 25.5. There were<br />
no significant differences in any baseline demographic<br />
between the ORIF and percutaneous groups. The<br />
majority <strong>of</strong> patients (51.1%) had an ASA score <strong>of</strong> 2,<br />
with similar distributions <strong>of</strong> ASA scores between the<br />
ORIF and percutaneous groups.<br />
Table 2 lists hospital LOS, inpatient costs, and<br />
average number <strong>of</strong> emergency room and clinic visits<br />
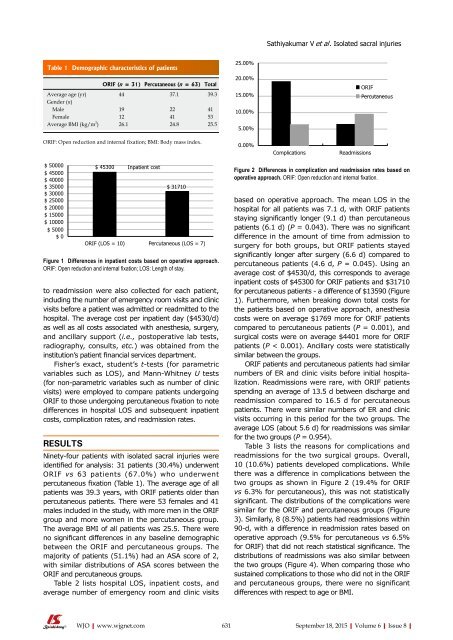
Figure 2 Differences in complication and readmission rates based on<br />
operative approach. ORIF: Open reduction and internal fixation.<br />
based on operative approach. The mean LOS in the<br />
hospital for all patients was 7.1 d, with ORIF patients<br />
staying significantly longer (9.1 d) than percutaneous<br />
patients (6.1 d) (P = 0.043). There was no significant<br />
difference in the amount <strong>of</strong> time from admission to<br />
surgery for both groups, but ORIF patients stayed<br />
significantly longer after surgery (6.6 d) compared to<br />
percutaneous patients (4.6 d, P = 0.045). Using an<br />
average cost <strong>of</strong> $4530/d, this corresponds to average<br />
inpatient costs <strong>of</strong> $45300 for ORIF patients and $31710<br />
for percutaneous patients - a difference <strong>of</strong> $13590 (Figure<br />
1). Furthermore, when breaking down total costs for<br />
the patients based on operative approach, anesthesia<br />
costs were on average $1769 more for ORIF patients<br />
compared to percutaneous patients (P = 0.001), and<br />
surgical costs were on average $4401 more for ORIF<br />
patients (P < 0.001). Ancillary costs were statistically<br />
similar between the groups.<br />
ORIF patients and percutaneous patients had similar<br />
numbers <strong>of</strong> ER and clinic visits before initial hospitalization.<br />
Readmissions were rare, with ORIF patients<br />
spending an average <strong>of</strong> 13.5 d between discharge and<br />
readmission compared to 16.5 d for percutaneous<br />
patients. There were similar numbers <strong>of</strong> ER and clinic<br />
visits occurring in this period for the two groups. The<br />
average LOS (about 5.6 d) for readmissions was similar<br />
for the two groups (P = 0.954).<br />
Table 3 lists the reasons for complications and<br />
readmissions for the two surgical groups. Overall,<br />
10 (10.6%) patients developed complications. While<br />
there was a difference in complications between the<br />
two groups as shown in Figure 2 (19.4% for ORIF<br />
vs 6.3% for percutaneous), this was not statistically<br />
significant. The distributions <strong>of</strong> the complications were<br />
similar for the ORIF and percutaneous groups (Figure<br />
3). Similarly, 8 (8.5%) patients had readmissions within<br />
90-d, with a difference in readmission rates based on<br />
operative approach (9.5% for percutaneous vs 6.5%<br />
for ORIF) that did not reach statistical significance. The<br />
distributions <strong>of</strong> readmissions was also similar between<br />
the two groups (Figure 4). When comparing those who<br />
sustained complications to those who did not in the ORIF<br />
and percutaneous groups, there were no significant<br />
differences with respect to age or BMI.<br />
WJO|www.wjgnet.com 631<br />
September 18, 2015|Volume 6|Issue 8|