


You also want an ePaper? Increase the reach of your titles
YUMPU automatically turns print PDFs into web optimized ePapers that Google loves.
Moya-Angeler J et al . Current concepts on osteonecrosis <strong>of</strong> the femoral head<br />
A<br />
B<br />
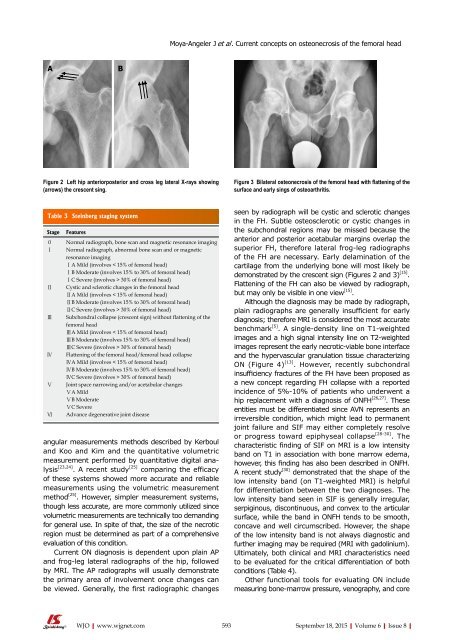
Figure 2 Left hip anteriorposterior and cross leg lateral X-rays showing<br />
(arrows) the crescent sing.<br />
Figure 3 Bilateral osteonecrosis <strong>of</strong> the femoral head with flattening <strong>of</strong> the<br />
surface and early sings <strong>of</strong> osteoarthritis.<br />
Table 3 Steinberg staging system<br />
Stage<br />
Features<br />
0 Normal radiograph, bone scan and magnetic resonance imaging<br />
Ⅰ Normal radiograph, abnormal bone scan and or magnetic<br />
resonance imaging<br />
ⅠA Mild (involves < 15% <strong>of</strong> femoral head)<br />
ⅠB Moderate (involves 15% to 30% <strong>of</strong> femoral head)<br />
ⅠC Severe (involves > 30% <strong>of</strong> femoral head)<br />
Ⅱ Cystic and sclerotic changes in the femoral head<br />
ⅡA Mild (involves < 15% <strong>of</strong> femoral head)<br />
ⅡB Moderate (involves 15% to 30% <strong>of</strong> femoral head)<br />
ⅡC Severe (involves > 30% <strong>of</strong> femoral head)<br />
Ⅲ Subchondral collapse (crescent sign) without flattening <strong>of</strong> the<br />
femoral head<br />
ⅢA Mild (involves < 15% <strong>of</strong> femoral head)<br />
ⅢB Moderate (involves 15% to 30% <strong>of</strong> femoral head)<br />
ⅢC Severe (involves > 30% <strong>of</strong> femoral head)<br />
Ⅳ Flattening <strong>of</strong> the femoral head/femoral head collapse<br />
ⅣA Mild (involves < 15% <strong>of</strong> femoral head)<br />
ⅣB Moderate (involves 15% to 30% <strong>of</strong> femoral head)<br />
ⅣC Severe (involves > 30% <strong>of</strong> femoral head)<br />
Ⅴ Joint space narrowing and/or acetabular changes<br />
ⅤA Mild<br />
ⅤB Moderate<br />
ⅤC Severe<br />
Ⅵ Advance degenerative joint disease<br />
angular measurements methods described by Kerboul<br />
and Koo and Kim and the quantitative volumetric<br />
measurement performed by quantitative digital analysis<br />
[23,24] . A recent study [25]<br />
comparing the efficacy<br />
<strong>of</strong> these systems showed more accurate and reliable<br />
measurements using the volumetric measurement<br />
method [25] . However, simpler measurement systems,<br />
though less accurate, are more commonly utilized since<br />
volumetric measurements are technically too demanding<br />
for general use. In spite <strong>of</strong> that, the size <strong>of</strong> the necrotic<br />
region must be determined as part <strong>of</strong> a comprehensive<br />
evaluation <strong>of</strong> this condition.<br />
Current ON diagnosis is dependent upon plain AP<br />
and frog-leg lateral radiographs <strong>of</strong> the hip, followed<br />
by MRI. The AP radiographs will usually demonstrate<br />
the primary area <strong>of</strong> involvement once changes can<br />
be viewed. Generally, the first radiographic changes<br />
seen by radiograph will be cystic and sclerotic changes<br />
in the FH. Subtle osteosclerotic or cystic changes in<br />
the subchondral regions may be missed because the<br />
anterior and posterior acetabular margins overlap the<br />
superior FH, therefore lateral frog-leg radiographs<br />
<strong>of</strong> the FH are necessary. Early delamination <strong>of</strong> the<br />
cartilage from the underlying bone will most likely be<br />
demonstrated by the crescent sign (Figures 2 and 3) [15] .<br />
Flattening <strong>of</strong> the FH can also be viewed by radiograph,<br />
but may only be visible in one view [15] .<br />
Although the diagnosis may be made by radiograph,<br />
plain radiographs are generally insufficient for early<br />
diagnosis; therefore MRI is considered the most accurate<br />
benchmark [5] . A single-density line on T1-weighted<br />
images and a high signal intensity line on T2-weighted<br />
images represent the early necrotic-viable bone interface<br />
and the hypervascular granulation tissue characterizing<br />
ON (Figure 4) [13] . However, recently subchondral<br />
insufficiency fractures <strong>of</strong> the FH have been proposed as<br />
a new concept regarding FH collapse with a reported<br />
incidence <strong>of</strong> 5%-10% <strong>of</strong> patients who underwent a<br />
hip replacement with a diagnosis <strong>of</strong> ONFH [26,27] . These<br />
entities must be differentiated since AVN represents an<br />
irreversible condition, which might lead to permanent<br />
joint failure and SIF may either completely resolve<br />
or progress toward epiphyseal collapse [28-30] . The<br />
characteristic finding <strong>of</strong> SIF on MRI is a low intensity<br />
band on T1 in association with bone marrow edema,<br />
however, this finding has also been described in ONFH.<br />
A recent study [30] demonstrated that the shape <strong>of</strong> the<br />
low intensity band (on T1-weighted MRI) is helpful<br />
for differentiation between the two diagnoses. The<br />
low intensity band seen in SIF is generally irregular,<br />
serpiginous, discontinuous, and convex to the articular<br />
surface, while the band in ONFH tends to be smooth,<br />
concave and well circumscribed. However, the shape<br />
<strong>of</strong> the low intensity band is not always diagnostic and<br />
further imaging may be required (MRI with gadolinium).<br />
Ultimately, both clinical and MRI characteristics need<br />
to be evaluated for the critical differentiation <strong>of</strong> both<br />
conditions (Table 4).<br />
Other functional tools for evaluating ON include<br />
measuring bone-marrow pressure, venography, and core<br />
WJO|www.wjgnet.com 593<br />
September 18, 2015|Volume 6|Issue 8|