Standard & Poors Ratings Direct (12 April 2011 - Stora Enso
Standard & Poors Ratings Direct (12 April 2011 - Stora Enso
Standard & Poors Ratings Direct (12 April 2011 - Stora Enso
You also want an ePaper? Increase the reach of your titles
YUMPU automatically turns print PDFs into web optimized ePapers that Google loves.
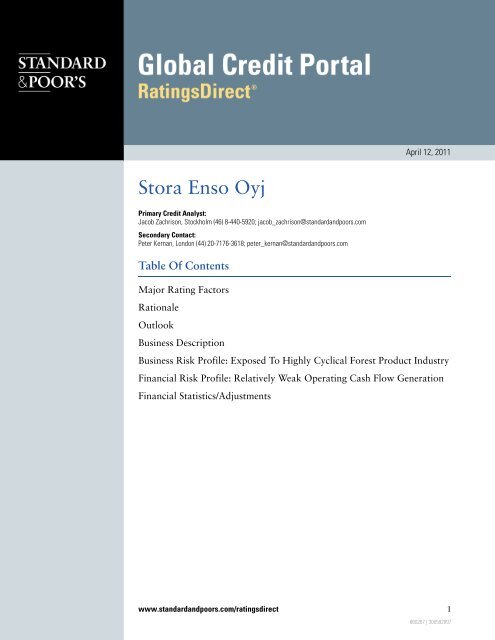
<strong>Stora</strong> <strong>Enso</strong> Oyj<br />
Primary Credit Analyst:<br />
Jacob Zachrison, Stockholm (46) 8-440-5920; jacob_zachrison@standardandpoors.com<br />
Secondary Contact:<br />
Peter Kernan, London (44) 20-7176-3618; peter_kernan@standardandpoors.com<br />
Table Of Contents<br />
Major Rating Factors<br />
Rationale<br />
Outlook<br />
Business Description<br />
Business Risk Profile: Exposed To Highly Cyclical Forest Product Industry<br />
Financial Risk Profile: Relatively Weak Operating Cash Flow Generation<br />
Financial Statistics/Adjustments<br />
<strong>April</strong> <strong>12</strong>, <strong>2011</strong><br />
www.standardandpoors.com/ratingsdirect 1<br />
860267 | 300592897
<strong>Stora</strong> <strong>Enso</strong> Oyj<br />
Major Rating Factors<br />
Strengths:<br />
• One of the world's largest forest products companies, with a diverse<br />
earnings base.<br />
• Competitive cost position.<br />
• Moderate debt leverage.<br />
Weaknesses:<br />
• Presence in cyclical and currently oversupplied paper markets.<br />
Corporate Credit Rating<br />
BB/Positive/B<br />
Nordic National Scale Rating<br />
--/--/K-4<br />
• Exposure to the graphic paper segments, where demand is hampered by structural challenges.<br />
• Weak profitability and cash generation, albeit currently improving.<br />
Rationale<br />
The ratings on Finland-based forest products group <strong>Stora</strong> <strong>Enso</strong> Oyj reflect its fair business risk and significant<br />
financial risk profiles.<br />
The fair business risk profile is based on the group's exposure to the highly competitive, commoditized, and cyclical<br />
forest product industry (especially graphic paper), and its relatively weak, albeit improving, profitability. These<br />
negative factors are balanced by strong positions in the relatively stable and less export-dependent packaging<br />
segments, significant pulp and energy integration including low-cost South American assets, and broad product and<br />
geographic diversification.<br />
The group's significant financial risk profile is based on its cyclical and generally weak operating cash flow<br />
generation (albeit currently improving), which is offset by a balanced capital structure with modest debt leverage,<br />
and strong liquidity.<br />
Key business and profitability developments<br />
Following a severe drop in demand for European forest products in 2009 and materially lower prices, including<br />
price decreases in newsprint and magazine paper at the beginning of 2010, market conditions in the industry<br />
gradually improved during 2010. A recovery in demand and increased pulp prices supported a gradual recovery in<br />
paper and board prices. As a result of improved market conditions and internal cost savings mitigating cost<br />
inflation, <strong>Stora</strong> <strong>Enso</strong>'s operating performance improved materially in 2010. Sales increased by about 15% compared<br />
with 2009, and the adjusted EBITDA margin increased to 11.9% from 8.6% in 2009.<br />
Although we believe that the industry will remain cyclical, the near-term industry outlook is generally favorable,<br />
with average prices in many segments likely to be higher in <strong>2011</strong> than in 2010. This is especially valid for newsprint<br />
(accounting for about <strong>12</strong>% of external group sales), where we understand that price increases in Europe of<br />
15%-20% were agreed at the beginning of the year. In our opinion, there are good prospects that <strong>Stora</strong> <strong>Enso</strong> will be<br />
able to maintain its current operating performance over the near term.<br />
<strong>Standard</strong> & Poor’s | <strong>Ratings</strong><strong>Direct</strong> on the Global Credit Portal | <strong>April</strong> <strong>12</strong>, <strong>2011</strong> 2<br />
860267 | 300592897
Key cash flow and capital-structure developments<br />
During 2008 and 2009 <strong>Stora</strong> <strong>Enso</strong>'s cash flow debt-protection measures were below levels that we consider<br />
consistent with the ratings, as a result of weak market conditions and operating performance. Improved market<br />
conditions in 2010, translated, however, into significantly increased operating cash flows, with adjusted funds from<br />
operations increasing to €1.1 billion from €0.7 billion in 2009. Combined with low investment levels, with capital<br />
expenditures at €0.4 billion, credit measures improved significantly. Adjusted funds from operations to debt and<br />
adjusted debt to EBITDA were about 31% and 3.0x in 2010, compared with 18.5% and 4.9x respectively for<br />
full-year 2009.<br />
Current credit measures are strong in relation to our expectations for the ratings, i.e. adjusted funds from operations<br />
to debt of above 20% and adjusted debt to EBITDA of about 3.5x. In our opinion, there are good prospects that<br />
<strong>Stora</strong> <strong>Enso</strong> will maintain its current credit measures over the near term, reflecting the favorable near-term industry<br />
outlook. The group's financial position could, however, weaken if the group were significantly to increase spending<br />
levels, although our base case assumes modestly increased capital expenditure levels compared with 2010. For<br />
example, in January <strong>2011</strong>, the group announced that it would build a new pulp mill in Uruguay through a joint<br />
venture company Montes del Plata (in which <strong>Stora</strong> <strong>Enso</strong> has a 50% share), and also that the group would build a<br />
new containerboard mill in Poland. <strong>Stora</strong> <strong>Enso</strong>'s acquisition activity was low in 2010, and we expect continued low<br />
acquisition spending in the near term.<br />
Liquidity<br />
The short term rating is 'B'. In our view <strong>Stora</strong> <strong>Enso</strong>'s overall liquidity is strong, as liquidity resources substantially<br />
exceed short-term cash uses, loan documentation is free from restrictive financial covenants, and the group has a<br />
solid relationship with its banks. This was evidenced in December 2010, when the group signed a new three-year<br />
committed credit facility of €700 million, with no financial covenants.<br />
The group's primary liquidity sources consist of:<br />
• Cash and liquid assets of €1.1 billion at year-end 2010 (of which we consider about €0.9 billion to be excess<br />
cash);<br />
• An undrawn committed revolving credit facility of €0.7 billion maturing in January 2014 (free of financial<br />
covenants that would restrict <strong>Stora</strong> <strong>Enso</strong> from drawing on the facility); and<br />
• About €700 million (on Dec. 31, 2010) from various long-term sources, including Finnish pension fund loans.<br />
• Funds from operations, which were €1.1 billion in 2010.<br />
These sources should be well in excess of the following near term outflows:<br />
• Debt-maturities of about €0.7 billion in <strong>2011</strong>, and about €0.3 billion in 20<strong>12</strong>.<br />
• Working capital increases (which were about €0.3 billion in 2010) and capital expenditures (about €0.4 billion in<br />
2010, but expected to be higher in <strong>2011</strong>); and<br />
• Dividend payments (€158 million paid in 2010, proposed to be about €197 million in <strong>2011</strong>).<br />
Recovery analysis<br />
The various unsecured debt issued by <strong>Stora</strong> <strong>Enso</strong> is rated 'BB', the same level as the corporate credit rating. The<br />
recovery rating is '3', indicating our expectation of meaningful (50%-70%) recovery in an event of payment default.<br />
Cover is at the low end of the range.<br />
<strong>Stora</strong> <strong>Enso</strong> Oyj<br />
www.standardandpoors.com/ratingsdirect 3<br />
860267 | 300592897
For the purpose of our analysis, we simulate a hypothetical payment default. In our hypothetical scenario, we<br />
believe that the group would face pressure on profitability resulting from over-supply, pressure on prices, and input<br />
cost volatility. The group's EBITDA margin at the simulated point of default is below 6%. Accordingly, we have<br />
extended the default year from 2013 to 2014 in line with the maturity of the new revolving credit facility.<br />
In our hypothetical scenario, we have valued the business using a going-concern approach supported by <strong>Stora</strong> <strong>Enso</strong>'s<br />
leading market positions, modern and efficient asset base, broad product and geographic diversity, and significant<br />
vertical integration. The valuation at the point of hypothetical default results from a combination of discounted cash<br />
flow and market multiple approaches, taking into account historical valuations in the paper sector, and is based on<br />
stressed EBITDA of €515 million and a blended multiple of 6.2x EBITDA.<br />
At the hypothetical point of default, the stressed enterprise value amounts to about €3.2 billion and is reduced by<br />
priority obligations estimated at about €1.27 billion. These would comprise the enforcement costs as well as finance<br />
leases, mortgage loans, and structurally senior bank debt of subsidiaries. This would result in a residual enterprise<br />
value of about €1.9 billion for the holders of the €3.6 billion unsecured debt. The waterfall of payments would lead<br />
to recovery prospects for the unsecured debt in the 50%-70% range.<br />
We have assumed that the new €700 million revolving facility due 2014 would be fully drawn at default and would<br />
rank pari passu with existing unsecured debt. We have assumed that drawings under the pension loan at the time of<br />
default would be about €235 million, and that the loan would also rank pari passu with the rated notes due to its<br />
unsecured nature.<br />
In our view, if the pension loan drawings were to increase to the €800 million limit currently available, this would<br />
not materially impact the recovery ratings. However, in the event that such borrowings were secured by any of <strong>Stora</strong><br />
<strong>Enso</strong>'s assets, unsecured debt recoveries might be significantly lower.<br />
Outlook<br />
The positive outlook reflects <strong>Stora</strong> <strong>Enso</strong>'s improved operating performance, cash flows, and credit measures, which<br />
if sustained could lead to a higher rating within the next year. This would be exemplified by a maintained adjusted<br />
EBITDA margin of at least <strong>12</strong>%, adjusted funds from operations of 25%-30%, and adjusted debt to EBITDA of<br />
about 3x.<br />
The outlook could be revised to stable if operating performance and credit measures were to weaken from their<br />
current levels, with, for example, adjusted funds from operations to debt falling below 25%, and adjusted debt to<br />
EBITDA increasing to about 3.5x. This could be a result of a decline in industry conditions and price levels. It could<br />
also result from materially higher debt levels due to expansionary investments, although our base case assumes a<br />
modest increase in investment levels in <strong>2011</strong>.<br />
Business Description<br />
With sales of €10.3 billion in 2010, <strong>Stora</strong> <strong>Enso</strong> is among the largest diversified forest product companies globally,<br />
with leading positions in newsprint, magazine paper, fine paper, and consumer and industrial packaging board.<br />
Operations also include specialty paper, pulp production--primarily used in the group's own mills--and wood supply<br />
and wood products.<br />
<strong>Stora</strong> <strong>Enso</strong> Oyj<br />
<strong>Standard</strong> & Poor’s | <strong>Ratings</strong><strong>Direct</strong> on the Global Credit Portal | <strong>April</strong> <strong>12</strong>, <strong>2011</strong> 4<br />
860267 | 300592897
Table 1<br />
<strong>Stora</strong> <strong>Enso</strong> Oyj Operating Statistics, Continuing Operations*<br />
(Mil. € ) Sales Operating margin (%)<br />
2010 2009 2008 2010 2009 2008<br />
Newsprint & bookpaper <strong>12</strong>61.6 1325.8 1,594.7 (0.9) 9.7 8.8<br />
Magazine paper 2054.2 1676 2,177.0 4.4 2.4 4.1<br />
Fine paper 2<strong>12</strong>5.7 1823.9 2,111.7 <strong>12</strong>.2 1.8 3.8<br />
Consumer board 2314.7 1895.9 2,231.9 <strong>12</strong>.0 8.7 4.8<br />
Industrial packaging 949.5 815.5 1,076.5 6.9 2.2 6.9<br />
Wood products 1588.7 <strong>12</strong>39.6 1,503.3 4.5 (0.7) (4.5)<br />
*Excluding non-recurring items and fair valuations<br />
The group has production facilities in several countries, including Finland, Sweden, Germany, Belgium, Brazil,<br />
Russia, and China. Production and sales are focused on Europe, but North America and Asia are also important<br />
markets (see table 2).<br />
Table 2<br />
<strong>Stora</strong> <strong>Enso</strong> Oyj Geographical Sales Breakdown - Continuing Operations<br />
(Mil. €) 2010 2009 2008<br />
Europe 7,942.5 7,180.0 8,848.1<br />
US 153.0 <strong>12</strong>3.7 106.2<br />
Latin America 381.7 262.3 360.2<br />
Asia 1054.9 779.5 901.6<br />
Africa 252.8 237.1 246.9<br />
Other 5<strong>12</strong> 362.5 565.8<br />
Total 10,296.9 8,945.1 11,028.8<br />
<strong>Stora</strong> <strong>Enso</strong>'s strategy includes the following key points:<br />
• New growth markets in emerging countries;<br />
• Maintaining and developing its global leadership position in fiber-based packaging;<br />
• Increased integration with plantation-based pulp; and<br />
• Presence in selected paper grades.<br />
<strong>Stora</strong> <strong>Enso</strong> is domiciled in Finland, and is listed on the Helsinki and Stockholm stock exchanges. The Finnish state<br />
holds 25% of the voting rights, but no state support is factored into the ratings.<br />
Business Risk Profile: Exposed To Highly Cyclical Forest Product Industry<br />
The main weaknesses of the group's "fair" business risk profile, according to our classifications, are:<br />
• Exposure to the highly cyclical forest product industry, characterized by demand fluctuations resulting from<br />
economic activity, recurring periods of over-capacity, and pricing pressure.<br />
• A history of intense competition within the industry. Here the focus has been on market share and capacity<br />
utilization (due to high fixed costs), as well as market fragmentation.<br />
<strong>Stora</strong> <strong>Enso</strong> Oyj<br />
• High sensitivity to the cost of raw materials, and limited pass-through of costs because of poor pricing power.<br />
www.standardandpoors.com/ratingsdirect 5<br />
860267 | 300592897
• Export dependence in many segments and exposure to foreign exchange rate developments. A strengthening of<br />
the euro against the U.S. dollar makes <strong>Stora</strong> <strong>Enso</strong> and other European producers less cost competitive than their<br />
U.S.-based competitors; in addition, such a strengthening could lower European paper prices.<br />
• Moderate barriers to entry, especially in many growth markets. This reflects a high degree of product<br />
commoditization, moderate production difficulties, and considerable cost advantages for producers with new<br />
equipment. These factors are balanced by a limited degree of product differentiation and benefits of scale.<br />
• A still significant exposure to graphic paper (with newsprint, magazine, and fine paper representing almost 50%<br />
of sales in 2010). These are generally more cyclical than packaging or hygiene grades, and are challenged with<br />
structurally declining demand.<br />
• Limited wood supply integration, with less than 10% of sourcing from own forestland (in Brazil, China and<br />
Uruguay). This is partly balanced by long-term supply agreements.<br />
These negative factors are partly offset by:<br />
• <strong>Stora</strong> <strong>Enso</strong>'s somewhat better-than-industry-average cost position. This reflects the large size and efficiency of its<br />
paper machines, major restructuring and cost savings initiatives over the past few years, fairly high energy<br />
integration, and high levels of pulp integration.<br />
• Strong presence in the consumer and industrial packaging segments (about 30% of sales in 2010), which tend to<br />
show more resilience to cyclical downturns.<br />
• Self-sufficiency in terms of pulp needs. This is mainly a result of low-cost plantation-based pulp in Latin America,<br />
which will grow further in next few years following the decision to build a new pulp mill in Uruguay. In addition,<br />
the group currently benefits from being a net seller of pulp as pulp prices increased significantly in 2010.<br />
• Self-sufficiency in electricity and energy is high, in our view, at about 60% at a group level. The group owns a<br />
large amount of low-cost energy generation facilities (hydro, nuclear, and coal).<br />
• A well-diversified asset and product portfolio. Although the main paper grades partly overlap, packaging and<br />
wood products partly follow a different demand pattern, which helps reduce earnings cyclicality, in our view.<br />
• Strong and growing presence in emerging markets. This includes magazine and fine paper production in China, as<br />
well as pulp and magazine capacity in Latin America (supported by own forestland assets).<br />
Financial Risk Profile: Relatively Weak Operating Cash Flow Generation<br />
The main weaknesses of the group's "significant" financial risk profile, according to our classifications, are:<br />
• Relatively weak operating cash flow generation over the past few years, reflecting weak market conditions. This<br />
put pressure on coverage ratios, although a recovery was seen in 2010.<br />
• Significant volatility in free operating cash flow, reflecting working capital use and differences in capital<br />
expenditure levels. Capital expenditures are likely to increase in the next few years, reflecting growth investments<br />
in, for example, Latin America.<br />
This is balanced by the following supportive factors:<br />
• Moderate debt leverage. <strong>Stora</strong> <strong>Enso</strong>'s adjusted debt-to-capital ratio was 37% as of Dec. 31, 2010, and has been<br />
between 37% and 44% over the past five years.<br />
<strong>Stora</strong> <strong>Enso</strong> Oyj<br />
• Ability and willingness to temporarily reduce capital expenditures and dividends to preserve cash. This was<br />
evidenced in 2009, when market conditions remained weak, and the company reduced capital expenditures to<br />
<strong>Standard</strong> & Poor’s | <strong>Ratings</strong><strong>Direct</strong> on the Global Credit Portal | <strong>April</strong> <strong>12</strong>, <strong>2011</strong> 6<br />
860267 | 300592897
about €0.4 billion from €0.7 billion in 2008, and cut dividends by 55%.<br />
• A strong liquidity position, in our view, with liquidity resources well in excess of the next two years' debt<br />
maturities.<br />
Financial Statistics/Adjustments<br />
In accordance with our criteria, we make several adjustments to <strong>Stora</strong> <strong>Enso</strong>'s financial position (see table 3).<br />
<strong>Stora</strong> <strong>Enso</strong> has material interests in certain companies that are reported as associated companies and recorded under<br />
the equity method. These companies are primarily Bergvik Skog AB (not rated; 43% equity stake), Veracel Celulose<br />
S.A. (not rated; 50%), and Tornator Oy (not rated; 41%). The debts in Bergvik and Tornator are non-recourse to<br />
<strong>Stora</strong> <strong>Enso</strong>, and we make no debt adjustment. <strong>Stora</strong> <strong>Enso</strong> is exposed to Bergvik and Tornator through its ownership<br />
stakes and long-term supply contracts. The exposure to Bergvik and Tornator is mitigated by the favorable<br />
characteristics of the companies' asset bases; namely, forestland, which normally does not decrease in value over<br />
time. <strong>Stora</strong> <strong>Enso</strong> guarantees its share of Veracel's debt, and we include this liability in our analysis.<br />
Included in available-for-sale investments, <strong>Stora</strong> <strong>Enso</strong> reports its 14.8% stake in Finnish power generation company<br />
Pohjalan Voima Oy (PVO; not rated), which, in turn, indirectly owns 57% of a Finnish nuclear operator,<br />
Teollisuuden Voima Oy (TVO; not rated). Although this is a strategic asset for the group, we believe that the value<br />
of the PVO holding, given the current high energy price environment, more than balances <strong>Stora</strong> <strong>Enso</strong>'s<br />
proportionate share in the liabilities of PVO. Our view could change, however, should energy prices fall significantly<br />
below the procurement costs for the PVO supplies.<br />
In the surplus cash adjustment to debt, we have excluded €250 million from the reported cash balances, reflecting<br />
our view of what we consider as cash tied up in the group's operations.<br />
Table 3<br />
Reconciliation Of <strong>Stora</strong> <strong>Enso</strong> Oyj Reported Amounts With <strong>Standard</strong> & Poor's Adjusted Amounts (Mil. €)*<br />
<strong>Stora</strong> <strong>Enso</strong> Oyj reported amounts<br />
--Fiscal year ended Dec. 31, 2010--<br />
Operating Operating Operating<br />
Cash flow<br />
Shareholders' income income income (after Interest<br />
from<br />
Debt<br />
equity (before D&A) (before D&A) D&A) expense operations<br />
Reported 4,011.2 6,202.9 1,309.5 1,309.5 1,026.8 108.0 811.9<br />
<strong>Standard</strong> & Poor's adjustments<br />
Operating leases (Note 31<br />
Commitments and<br />
Contingencies p. 117, 5%<br />
discount rate applied)<br />
Postretirement benefit<br />
obligations (Note 22<br />
Post-Employment Benefits p.<br />
89)<br />
Guarantee to Veracel (Note 31,<br />
p. 117)<br />
Surplus cash and near cash<br />
investments (Note 24 Other<br />
Provisions - minimum cash<br />
requirements)<br />
<strong>Stora</strong> <strong>Enso</strong> Oyj<br />
109.0 -- 29.8 5.1 5.1 5.1 24.7<br />
246.2 (0.8) <strong>12</strong>.8 <strong>12</strong>.8 <strong>12</strong>.8 <strong>12</strong>.7 15.0<br />
<strong>12</strong>3.5 -- -- -- -- -- --<br />
(860.9) -- -- -- -- -- --<br />
www.standardandpoors.com/ratingsdirect 7<br />
860267 | 300592897
Table 3<br />
Reconciliation Of <strong>Stora</strong> <strong>Enso</strong> Oyj Reported Amounts With <strong>Standard</strong> & Poor's Adjusted Amounts (Mil. €)* (cont.)<br />
Capitalized interest (Note 9, p.<br />
67)<br />
Share-based compensation<br />
expense (Note 7, p. 62)<br />
Reclassification of<br />
nonoperating income<br />
(expenses) (Note 9, p. 64)<br />
Reclassification of<br />
working-capital cash flow<br />
changes<br />
-- -- -- -- -- 11.5 (11.5)<br />
-- -- -- 28.0 -- -- --<br />
-- -- -- -- 23.7 -- --<br />
-- -- -- -- -- -- --<br />
Minority interests -- 51.8 -- -- -- -- --<br />
Fair valuations, and other (Note<br />
3, p. 51)<br />
Equity accounted investments<br />
result (Note 5, . 58)<br />
Change in value of biological<br />
assets (Note 5, p. 58)<br />
Restructuring costs excluding<br />
fixed asset impairment (Note 3,<br />
p. 51)<br />
Fixed assets and impairment<br />
charges (Note <strong>12</strong> p. 70)<br />
-- -- (59.2) (59.2) (59.2) -- --<br />
-- -- (1<strong>12</strong>.5) (1<strong>12</strong>.5) -- --<br />
-- -- 4.0 4.0 4.0 -- --<br />
-- -- 39.7 39.7 39.7 -- --<br />
-- -- -- -- (246.2) -- --<br />
Total adjustments (382.2) 51.0 (85.5) (82.1) (220.1) 29.3 28.2<br />
<strong>Standard</strong> & Poor's adjusted amounts<br />
Operating<br />
Cash flow<br />
income<br />
Interest<br />
from<br />
Debt Equity (before D&A) EBITDA EBIT expense operations<br />
Adjusted 3,629.0 6,253.9 1,224.1 1,227.4 806.7 137.3 840.1<br />
*Please note that two reported amounts (operating income before D&A and cash flow from operations) are used to derive more than one <strong>Standard</strong> & Poor's-adjusted<br />
amount (operating income before D&A and EBITDA, and cash flow from operations and funds from operations, respectively). Consequently, the first section in some tables<br />
may feature duplicate descriptions and amounts.<br />
Table 4<br />
<strong>Stora</strong> <strong>Enso</strong> Oyj -- Peer Comparison*<br />
<strong>Stora</strong> <strong>Enso</strong> Oyj UPM-Kymmene Corp. Mondi Group<br />
Rating as of <strong>April</strong> <strong>12</strong>, <strong>2011</strong> BB/Positive/B BB/Stable/B BB+/Positive/--<br />
--Average of past three fiscal years--<br />
(Mil. €)<br />
Revenues 10,090.3 8,770.0 5,943.3<br />
EBITDA 981.2 1,253.6 795.5<br />
Funds from operations (FFO) 794.1 959.4 616.5<br />
Capital expenditures 521.1 362.6 617.8<br />
Debt 3,966.5 4,634.7 2,039.5<br />
Equity 5,695.6 6,453.2 2,932.1<br />
Adjusted ratios<br />
EBITDA/revenues (%) 9.7 14.3 13.4<br />
Oper. income (bef. D&A)/revenues (%) 9.8 14.4 13.9<br />
EBITDA interest coverage (x) 5.8 5.5 4.5<br />
<strong>Stora</strong> <strong>Enso</strong> Oyj<br />
<strong>Standard</strong> & Poor’s | <strong>Ratings</strong><strong>Direct</strong> on the Global Credit Portal | <strong>April</strong> <strong>12</strong>, <strong>2011</strong> 8<br />
860267 | 300592897
Table 4<br />
<strong>Stora</strong> <strong>Enso</strong> Oyj -- Peer Comparison* (cont.)<br />
Return on capital (%) 4.8 3.7 8.3<br />
FFO/debt (%) 20.0 20.7 30.2<br />
Free operating cash flow/debt (%) 10.6 14.8 2.5<br />
Debt/EBITDA (x) 4.0 3.7 2.6<br />
Total debt/debt plus equity (%) 41.1 41.8 41.0<br />
*Fully adjusted (including postretirement obligations). Excess cash and investments netted against debt.<br />
Table 5<br />
<strong>Stora</strong> <strong>Enso</strong> Oyj -- Financial Summary*<br />
Rating history<br />
--Fiscal year ended Dec. 31--<br />
2010 2009 2008 2007 2006<br />
BB/Positive/B BB/Negative/B BB+/Stable/B BBB-/Negative/A-3 BBB/Stable/A-2<br />
(Mil. €)<br />
Revenues 10,296.9 8,945.1 11,028.8 11,848.0 11,460.0<br />
EBITDA 1,227.4 768.9 947.3 1,450.1 1,702.4<br />
Net income from continuing operations 766.0 (879.7) (677.7) 10.5 683.1<br />
Funds from operations (FFO) 1,111.8 702.4 568.0 1,281.8 1,239.0<br />
Capital expenditures 428.6 427.8 706.9 826.5 609.7<br />
Debt 3,629.0 3,801.1 4,469.5 4,441.7 5,965.3<br />
Equity 6,253.9 5,182.5 5,650.5 7,548.0 7,919.4<br />
Debt and equity 9,882.9 8,983.6 10,<strong>12</strong>0.0 11,989.7 13,884.7<br />
Adjusted ratios<br />
EBITDA/revenues (%) 11.9 8.6 8.6 <strong>12</strong>.2 14.9<br />
Oper. income (bef. D&A)/revenues (%) 11.9 8.8 8.7 <strong>12</strong>.5 14.9<br />
EBIT interest coverage (x) 5.9 2.5 1.4 4.5 4.2<br />
EBITDA interest coverage (x) 8.9 5.2 4.3 6.1 7.3<br />
Return on capital (%) 8.2 3.8 2.7 7.9 6.5<br />
FFO/debt (%) 30.6 18.5 <strong>12</strong>.7 28.9 20.8<br />
Free operating cash flow/debt (%) 11.3 24.0 (1.3) 2.8 15.4<br />
Discretionary cash flow/debt (%) 7.0 19.9 (9.2) (5.2) 9.4<br />
Debt/EBITDA (x) 3.0 4.9 4.7 3.1 3.5<br />
Debt/debt and equity (%) 36.7 42.3 44.2 37.0 43.0<br />
*Fully adjusted (including postretirement obligations). Excess cash and investments netted against debt.<br />
<strong>Ratings</strong> Detail (As Of <strong>April</strong> <strong>12</strong>, <strong>2011</strong>)*<br />
<strong>Stora</strong> <strong>Enso</strong> Oyj<br />
Corporate Credit Rating BB/Positive/B<br />
Nordic National Scale Rating --/--/K-4<br />
Commercial Paper<br />
Foreign Currency B<br />
Nordic National Scale Rating K-4<br />
Senior Unsecured (10 Issues) BB<br />
<strong>Stora</strong> <strong>Enso</strong> Oyj<br />
www.standardandpoors.com/ratingsdirect 9<br />
860267 | 300592897
<strong>Ratings</strong> Detail (As Of <strong>April</strong> <strong>12</strong>, <strong>2011</strong>)*(cont.)<br />
Corporate Credit <strong>Ratings</strong> History<br />
15-Dec-2010 BB/Positive/B<br />
14-May-2009 BB/Negative/B<br />
24-Apr-2009 BB+/Watch Neg/B<br />
24-Feb-2009 BB+/Negative/B<br />
11-Nov-2008 BB+/Stable/B<br />
22-Oct-2007 BBB-/Negative/A-3<br />
05-Jun-2007 BBB/Negative/A-3<br />
11-Nov-2008 Nordic National Scale Rating --/--/K-4<br />
11-Nov-2008 --/--/K-3<br />
Business Risk Profile Fair<br />
Financial Risk Profile Significant<br />
Debt Maturities<br />
(As of Dec. 31, 2010)<br />
<strong>2011</strong>: €752 mil.<br />
20<strong>12</strong>: €257 mil.<br />
2013: €100 mil.<br />
2014: €772 mil.<br />
2015: €560 mil.<br />
Thereafter: €1,570 mil.<br />
Related Entities<br />
<strong>Stora</strong> Kopparbergs Bergslags AB<br />
Issuer Credit Rating BB/Positive/B<br />
*Unless otherwise noted, all ratings in this report are global scale ratings. <strong>Standard</strong> & Poor's credit ratings on the global scale are comparable across countries. <strong>Standard</strong><br />
& Poor's credit ratings on a national scale are relative to obligors or obligations within that specific country.<br />
Additional Contact:<br />
Industrial <strong>Ratings</strong> Europe; CorporateFinanceEurope@standardandpoors.com<br />
Additional Contact:<br />
Industrial <strong>Ratings</strong> Europe; CorporateFinanceEurope@standardandpoors.com<br />
<strong>Stora</strong> <strong>Enso</strong> Oyj<br />
<strong>Standard</strong> & Poor’s | <strong>Ratings</strong><strong>Direct</strong> on the Global Credit Portal | <strong>April</strong> <strong>12</strong>, <strong>2011</strong> 10<br />
860267 | 300592897
Copyright © <strong>2011</strong> by <strong>Standard</strong> & <strong>Poors</strong> Financial Services LLC (S&P), a subsidiary of The McGraw-Hill Companies, Inc. All rights reserved.<br />
No content (including ratings, credit-related analyses and data, model, software or other application or output therefrom) or any part thereof (Content) may be modified,<br />
reverse engineered, reproduced or distributed in any form by any means, or stored in a database or retrieval system, without the prior written permission of S&P. The Content<br />
shall not be used for any unlawful or unauthorized purposes. S&P, its affiliates, and any third-party providers, as well as their directors, officers, shareholders, employees or<br />
agents (collectively S&P Parties) do not guarantee the accuracy, completeness, timeliness or availability of the Content. S&P Parties are not responsible for any errors or<br />
omissions, regardless of the cause, for the results obtained from the use of the Content, or for the security or maintenance of any data input by the user. The Content is<br />
provided on an "as is" basis. S&P PARTIES DISCLAIM ANY AND ALL EXPRESS OR IMPLIED WARRANTIES, INCLUDING, BUT NOT LIMITED TO, ANY WARRANTIES OF<br />
MERCHANTABILITY OR FITNESS FOR A PARTICULAR PURPOSE OR USE, FREEDOM FROM BUGS, SOFTWARE ERRORS OR DEFECTS, THAT THE CONTENT'S FUNCTIONING<br />
WILL BE UNINTERRUPTED OR THAT THE CONTENT WILL OPERATE WITH ANY SOFTWARE OR HARDWARE CONFIGURATION. In no event shall S&P Parties be liable to any<br />
party for any direct, indirect, incidental, exemplary, compensatory, punitive, special or consequential damages, costs, expenses, legal fees, or losses (including, without<br />
limitation, lost income or lost profits and opportunity costs) in connection with any use of the Content even if advised of the possibility of such damages.<br />
Credit-related analyses, including ratings, and statements in the Content are statements of opinion as of the date they are expressed and not statements of fact or<br />
recommendations to purchase, hold, or sell any securities or to make any investment decisions. S&P assumes no obligation to update the Content following publication in any<br />
form or format. The Content should not be relied on and is not a substitute for the skill, judgment and experience of the user, its management, employees, advisors and/or<br />
clients when making investment and other business decisions. S&P's opinions and analyses do not address the suitability of any security. S&P does not act as a fiduciary or<br />
an investment advisor. While S&P has obtained information from sources it believes to be reliable, S&P does not perform an audit and undertakes no duty of due diligence or<br />
independent verification of any information it receives.<br />
S&P keeps certain activities of its business units separate from each other in order to preserve the independence and objectivity of their respective activities. As a result,<br />
certain business units of S&P may have information that is not available to other S&P business units. S&P has established policies and procedures to maintain the<br />
confidentiality of certain non-public information received in connection with each analytical process.<br />
S&P may receive compensation for its ratings and certain credit-related analyses, normally from issuers or underwriters of securities or from obligors. S&P reserves the right<br />
to disseminate its opinions and analyses. S&P's public ratings and analyses are made available on its Web sites, www.standardandpoors.com (free of charge), and<br />
www.ratingsdirect.com and www.globalcreditportal.com (subscription), and may be distributed through other means, including via S&P publications and third-party<br />
redistributors. Additional information about our ratings fees is available at www.standardandpoors.com/usratingsfees.<br />
www.standardandpoors.com/ratingsdirect 11<br />
860267 | 300592897


