FINANCIAL
Financial report 2005/2006 (PDF) - Vision Australia
Financial report 2005/2006 (PDF) - Vision Australia
- No tags were found...

Create successful ePaper yourself
Turn your PDF publications into a flip-book with our unique Google optimized e-Paper software.
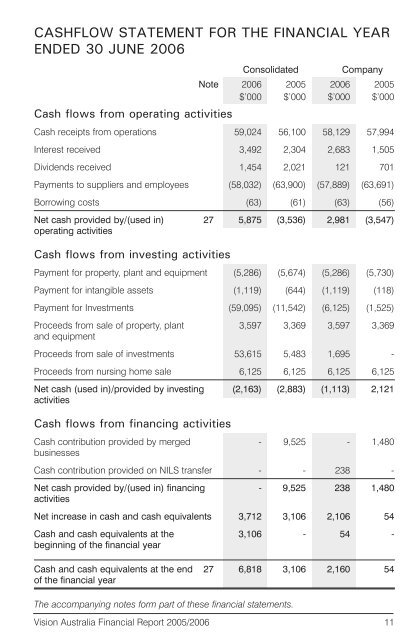
CASHFLOW STATEMENT FOR THE <strong>FINANCIAL</strong> YEAR<br />
ENDED 30 JUNE 2006<br />
Cash flows from operating activities<br />
Consolidated Company<br />
Note 2006 2005 2006 2005<br />
$’000 $’000 $’000 $’000<br />
Cash receipts from operations 59,024 56,100 58,129 57,994<br />
Interest received 3,492 2,304 2,683 1,505<br />
Dividends received 1,454 2,021 121 701<br />
Payments to suppliers and employees (58,032) (63,900) (57,889) (63,691)<br />
Borrowing costs (63) (61) (63) (56)<br />
Net cash provided by/(used in) 27 5,875 (3,536) 2,981 (3,547)<br />
operating activities<br />
Cash flows from investing activities<br />
Payment for property, plant and equipment (5,286) (5,674) (5,286) (5,730)<br />
Payment for intangible assets (1,119) (644) (1,119) (118)<br />
Payment for Investments (59,095) (11,542) (6,125) (1,525)<br />
Proceeds from sale of property, plant 3,597 3,369 3,597 3,369<br />
and equipment<br />
Proceeds from sale of investments 53,615 5,483 1,695 -<br />
Proceeds from nursing home sale 6,125 6,125 6,125 6,125<br />
Net cash (used in)/provided by investing (2,163) (2,883) (1,113) 2,121<br />
activities<br />
Cash flows from financing activities<br />
Cash contribution provided by merged - 9,525 - 1,480<br />
businesses<br />
Cash contribution provided on NILS transfer - - 238 -<br />
Net cash provided by/(used in) financing - 9,525 238 1,480<br />
activities<br />
Net increase in cash and cash equivalents 3,712 3,106 2,106 54<br />
Cash and cash equivalents at the 3,106 - 54 -<br />
beginning of the financial year<br />
Cash and cash equivalents at the end 27 6,818 3,106 2,160 54<br />
of the financial year<br />
The accompanying notes form part of these financial statements.<br />
Vision Australia Financial Report 2005/2006 11